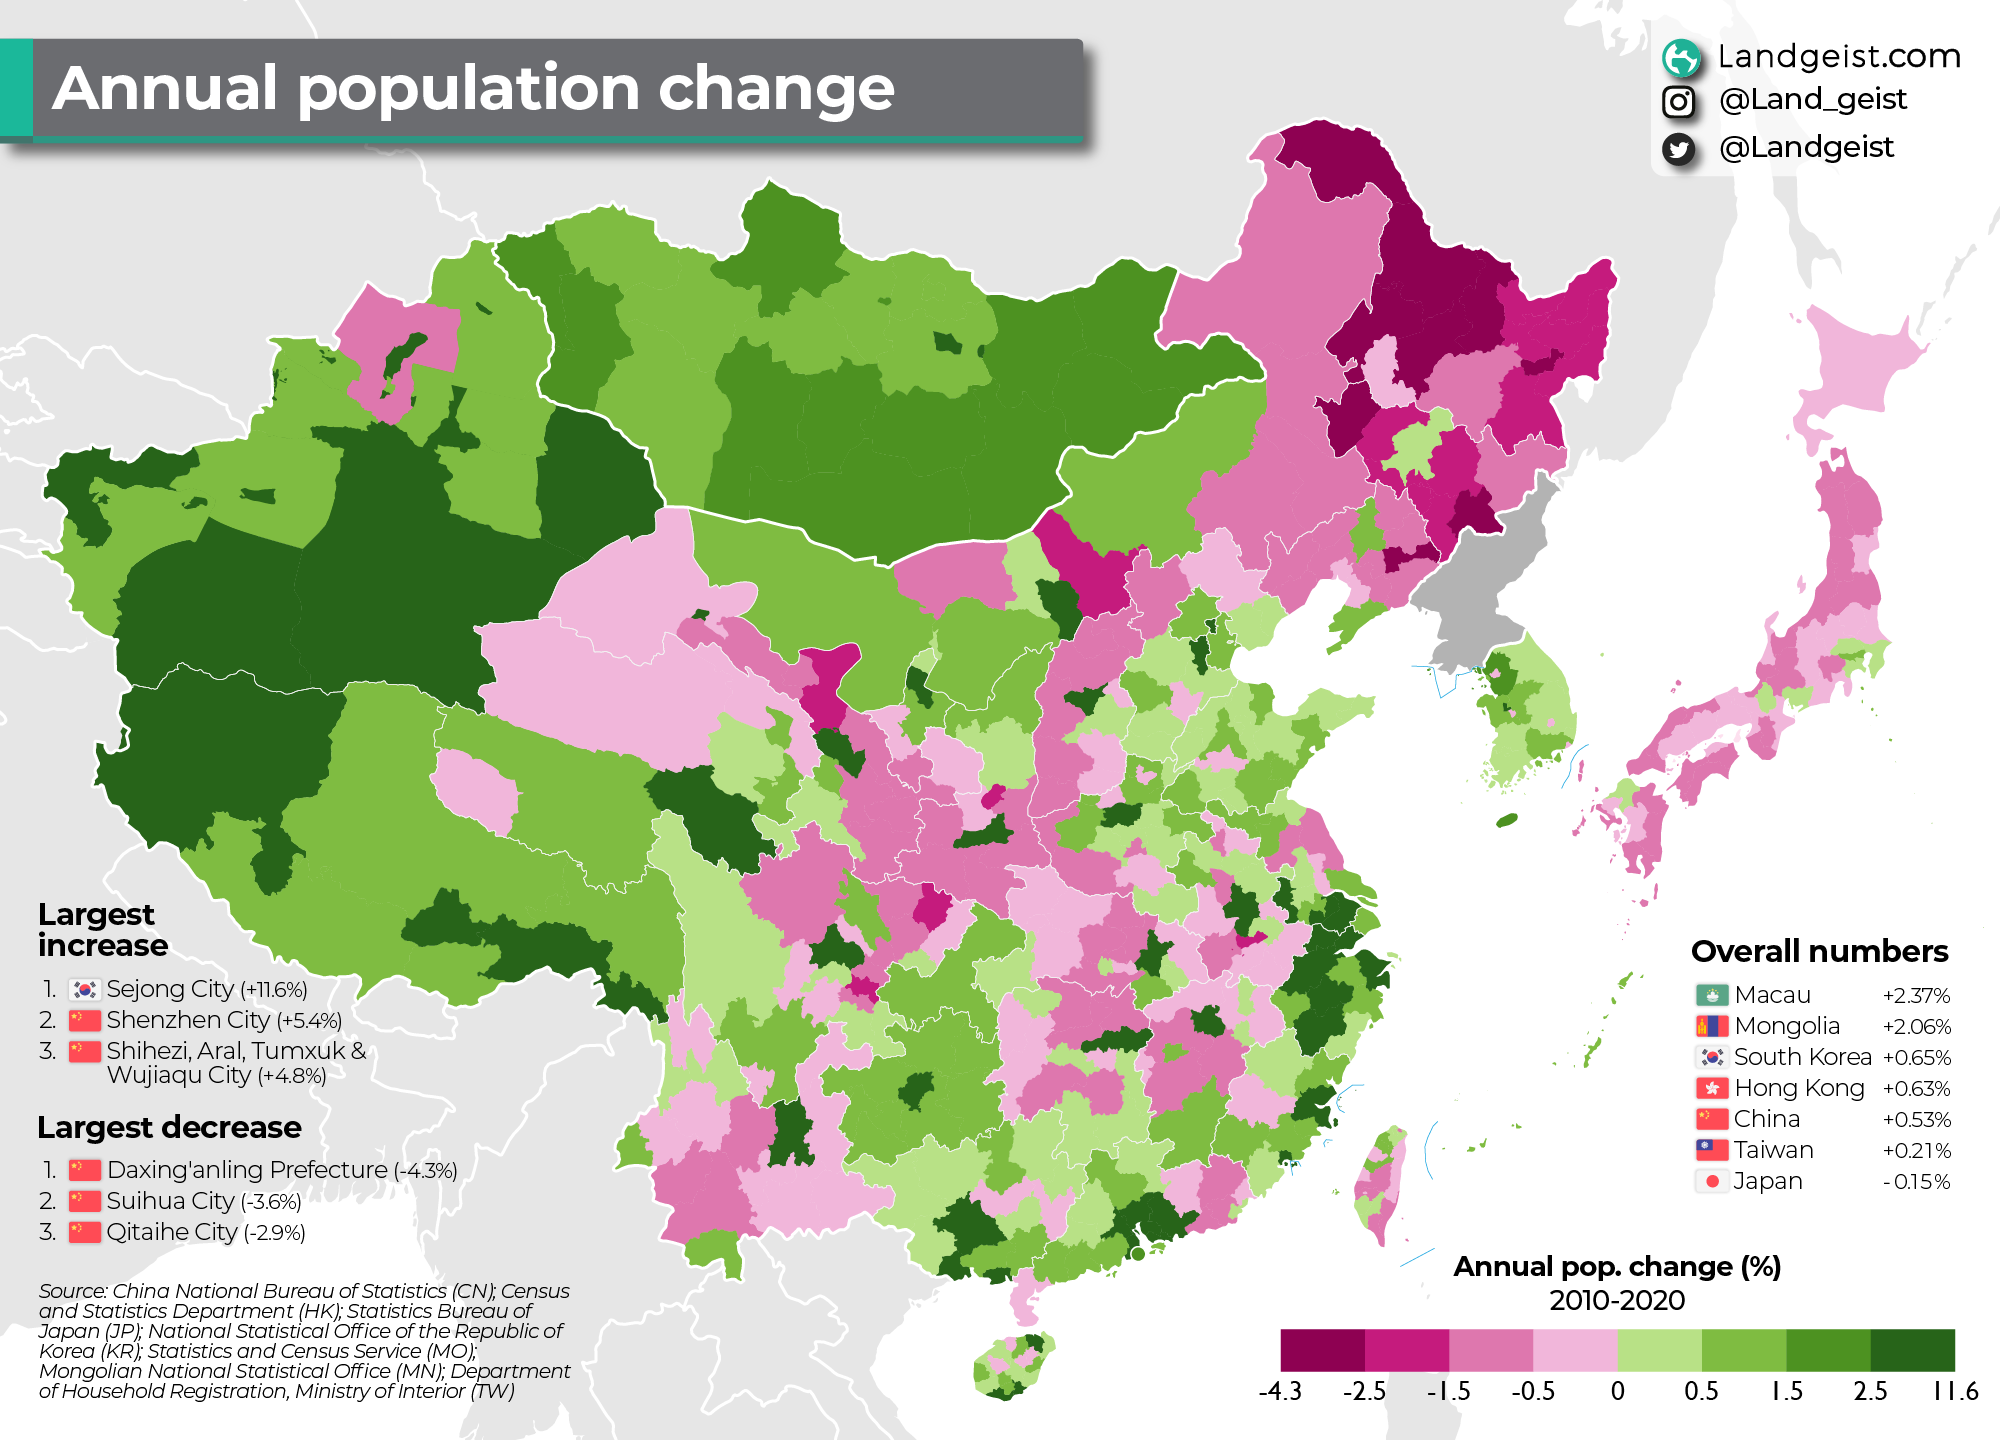
Annual Population Change Map of East Asia 2010-2020

Marcus Rodriguez
Historical Geography Expert
Marcus Rodriguez specializes in historical cartography and geographic data analysis. With a background in both history and geography, he brings unique...
Geographic Analysis
What This Map Shows
This map illustrates the annual population change in East Asia from 2010 to 2020, providing a vivid snapshot of demographic trends across this dynamic region. By visualizing shifts in population over the decade, the map helps us understand where growth is occurring and where populations are declining, shedding light on regional patterns influenced by various socio-economic factors.
Deep Dive into Population Dynamics in East Asia
Population dynamics are a critical aspect of geography, especially in a region as diverse and rapidly evolving as East Asia. This area, which includes countries like China, Japan, South Korea, Taiwan, and Mongolia, has experienced significant demographic changes over the past decade.
One of the most striking aspects of population change in East Asia is the stark contrast between urban and rural areas. Urban centers, particularly in China, have seen explosive growth. Cities like Shanghai and Beijing have attracted millions of migrants seeking better job opportunities and living conditions. Interestingly, China's urbanization rate rose from approximately 49% in 2010 to over 60% by 2020, showcasing the rapid shift toward urban living.
Conversely, rural areas in many East Asian countries have experienced population decline. For instance, Japan has faced a significant demographic challenge, with its rural regions emptying as younger populations migrate to urban centers. Japan's overall population has been decreasing, driven by low birth rates, an aging population, and limited immigration. In fact, Japan's population fell from 128 million in 2010 to about 126 million in 2020, highlighting a concerning trend that could have long-term implications for its economy and social structure.
In terms of fertility rates, East Asia has some of the lowest in the world. Countries like South Korea and Taiwan have struggled with declining birth rates, falling below the replacement level of 2.1 births per woman. This phenomenon is influenced by various factors, including economic pressures, changing social norms, and increased participation of women in the workforce. South Korea's fertility rate was recorded at 0.84 in 2020, one of the lowest globally, prompting the government to implement policies aimed at encouraging families to have more children.
Additionally, migration patterns play a crucial role in shaping population changes. East Asia has seen significant inward migration, particularly in urban areas. For instance, South Korea has welcomed many foreign workers, while Japan has started to relax its traditionally strict immigration policies in response to labor shortages. The influx of migrants can rejuvenate local economies, but it also raises questions about integration and social cohesion.
Regional Analysis
When we examine the regions shown in the map, we can observe varying trends in population change. China, as the most populous country globally, has regions with both substantial growth and decline. The eastern coastal provinces, such as Guangdong and Jiangsu, are thriving due to industrialization, while some interior provinces like Heilongjiang are facing population losses due to out-migration.
In Japan, the contrast is even more pronounced. Metropolitan areas like Tokyo continue to grow, while rural prefectures such as Aomori and Akita are experiencing steep population declines. This rural depopulation trend is accompanied by an aging demographic, presenting unique challenges for local economies and social services.
Interestingly, South Korea's population distribution reveals a concentration of people in the Seoul Capital Area, which houses nearly half of the country’s population. This urban-centric growth highlights the ongoing urbanization trend while also leading to challenges such as overcrowding and increased living costs.
Mongolia, although not as densely populated, has shown a different trend. The capital, Ulaanbaatar, has been rapidly growing, largely due to rural-urban migration driven by harsh climatic conditions in the countryside. The capital's population has surged, leading to both opportunities and infrastructural challenges.
Significance and Impact
Understanding population changes in East Asia is crucial for several reasons. First, these demographic shifts have profound implications for economic development, labor markets, and social services. Countries experiencing rapid urbanization must adapt their infrastructure and policies to accommodate growing populations, particularly in housing, transportation, and healthcare.
Moreover, the declining birth rates and aging populations in countries like Japan and South Korea raise critical questions about sustainability. As fewer workers support an increasing number of retirees, economic productivity may suffer, prompting governments to rethink their approaches to immigration and family support policies.
Current trends indicate that these population dynamics will continue to evolve, influenced by globalization, climate change, and economic factors. As East Asia navigates these challenges, it remains imperative for policymakers to understand the underlying demographic trends to foster sustainable growth and social harmony in the region.
In conclusion, the annual population change map of East Asia from 2010 to 2020 serves as a vital tool for understanding the complexities of demographic trends in this diverse region. By analyzing these shifts, we gain insights into the future trajectory of East Asia and the potential challenges and opportunities that lie ahead.
Visualization Details
- Published
- August 21, 2025
- Views
- 190
Comments
Loading comments...