Children per Woman in Europe 1960 Map

Alex Cartwright
Senior Cartographer & GIS Specialist
Alex Cartwright is a renowned cartographer and geographic information systems specialist with over 15 years of experience in spatial analysis and data...
Geographic Analysis
What This Map Shows
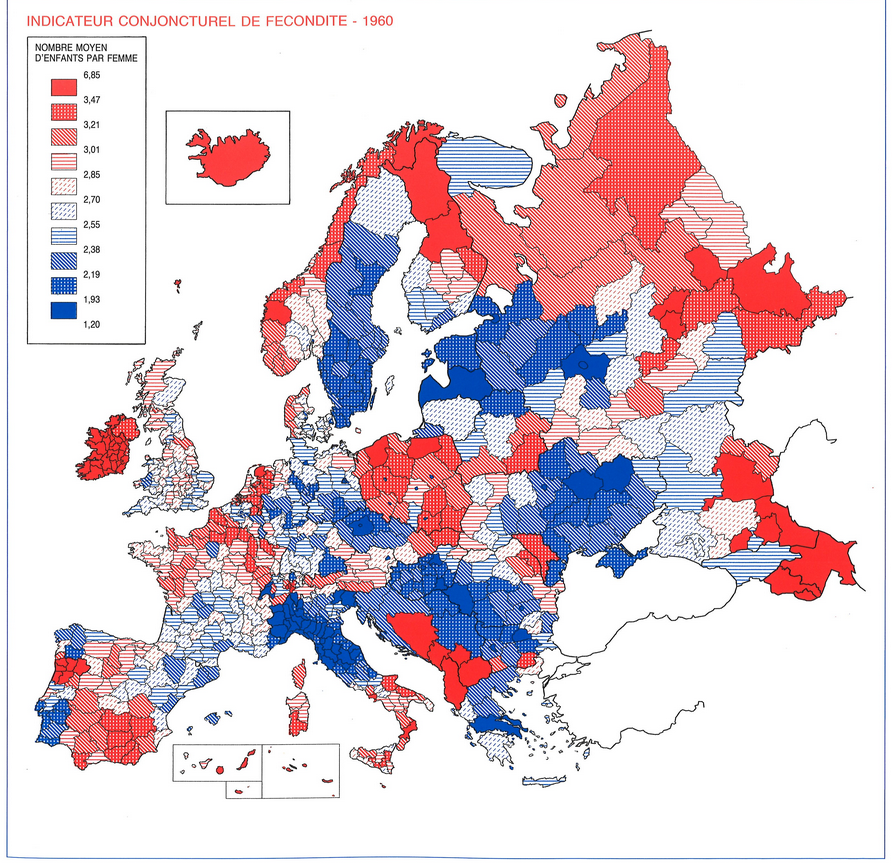
The map titled "Children per Woman in Europe in the Year 1960" provides a striking visualization of fertility rates across different European nations at a pivotal point in history. The data reveals how many children each woman was expected to have on average, offering a lens into the social and economic conditions of the time. This snapshot from 1960 is particularly significant as it marks the beginning of substantial demographic shifts influenced by various factors such as industrialization, changes in societal norms, and governmental policies regarding family and healthcare.
Deep Dive into Fertility Rates in 1960
Fertility rates are a crucial demographic indicator that reflect a society's reproductive behavior and health. In 1960, Europe was experiencing a transition post-World War II, characterized by a significant baby boom in many regions. However, the rates were not uniform across the continent. For instance, countries like Ireland and France recorded relatively high fertility rates, with women having upwards of four children on average. This tendency was bolstered by cultural norms that favored larger families, especially in rural areas.
Conversely, nations like West Germany and the Scandinavian countries exhibited lower fertility rates, closer to the two-child mark. The reasons behind this variation are multifaceted. Socio-economic development played a crucial role; wealthier nations often promoted family planning and women's education, which correlated with lower birth rates. Moreover, the context of post-war recovery saw many couples delaying marriage and childbirth to establish financial stability first.
Interestingly, the late 1950s and early 1960s were also the dawn of the contraceptive revolution in several parts of Europe, contributing to declining fertility rates. The introduction and acceptance of birth control methods allowed women greater autonomy over their reproductive choices, leading to smaller family sizes. This was a transformative period, where societal norms began to shift towards valuing women's participation in the workforce over traditional family structures.
Statistical analysis reveals that the average fertility rate in Western Europe was around 2.5 children per woman, while Eastern European countries exhibited slightly higher figures, influenced by different political and economic climates. For example, in countries like Hungary and Poland, the government often incentivized larger families through welfare programs, resulting in higher birth rates compared to their Western counterparts.
Regional Analysis
When we look closely at the regional distributions on the map, several patterns emerge. Southern Europe, particularly countries like Italy and Greece, show a higher concentration of fertility rates, often exceeding the European average. This can be attributed to traditional family values and the influence of the Catholic Church, which upheld the idea of large families.
In contrast, Northern European countries such as Denmark and Sweden, while also experiencing a baby boom, had begun to see a decline in fertility rates due to progressive social policies that promoted gender equality and family planning. The Scandinavian model, with its robust welfare states, provided support for working mothers, enabling them to balance careers and family life more effectively.
Eastern Europe, influenced by Soviet policies, often had fertility rates that were artificially sustained through state support for families. Countries like Bulgaria and Romania demonstrated this phenomenon, where government incentives encouraged larger families despite the economic challenges facing these nations.
Significance and Impact
Understanding the fertility rates of 1960 is essential for grasping the demographic changes that shaped modern Europe. The variations across the continent highlight how cultural, economic, and political factors intertwine to influence family structures and population growth. The implications of these fertility rates are profound; they set the stage for population aging, shifts in labor markets, and the evolution of social policies that we continue to analyze today.
What's fascinating is how these historical fertility trends have lasting impacts on contemporary society. For instance, countries that experienced significant declines in fertility rates have had to adapt to an aging population, leading to discussions about immigration policies and sustainability of pension systems. Projections indicate that many European nations will continue to face challenges related to population decline, prompting renewed interest in supporting families and encouraging higher birth rates.
In conclusion, the map of children per woman in Europe in 1960 is not just a display of numbers but a window into the past. It encapsulates the socio-economic dynamics of the time and serves as a crucial reference point for understanding ongoing demographic trends in Europe. As we look to the future, learning from these historical patterns will be vital in addressing the challenges of tomorrow's society.
Visualization Details
- Published
- September 18, 2025
- Views
- 58
Comments
Loading comments...