Fertility Rates by Country Map 2024

David Chen
Data Visualization Specialist
David Chen is an expert in transforming complex geographic datasets into compelling visual narratives. He combines his background in computer science ...
Geographic Analysis
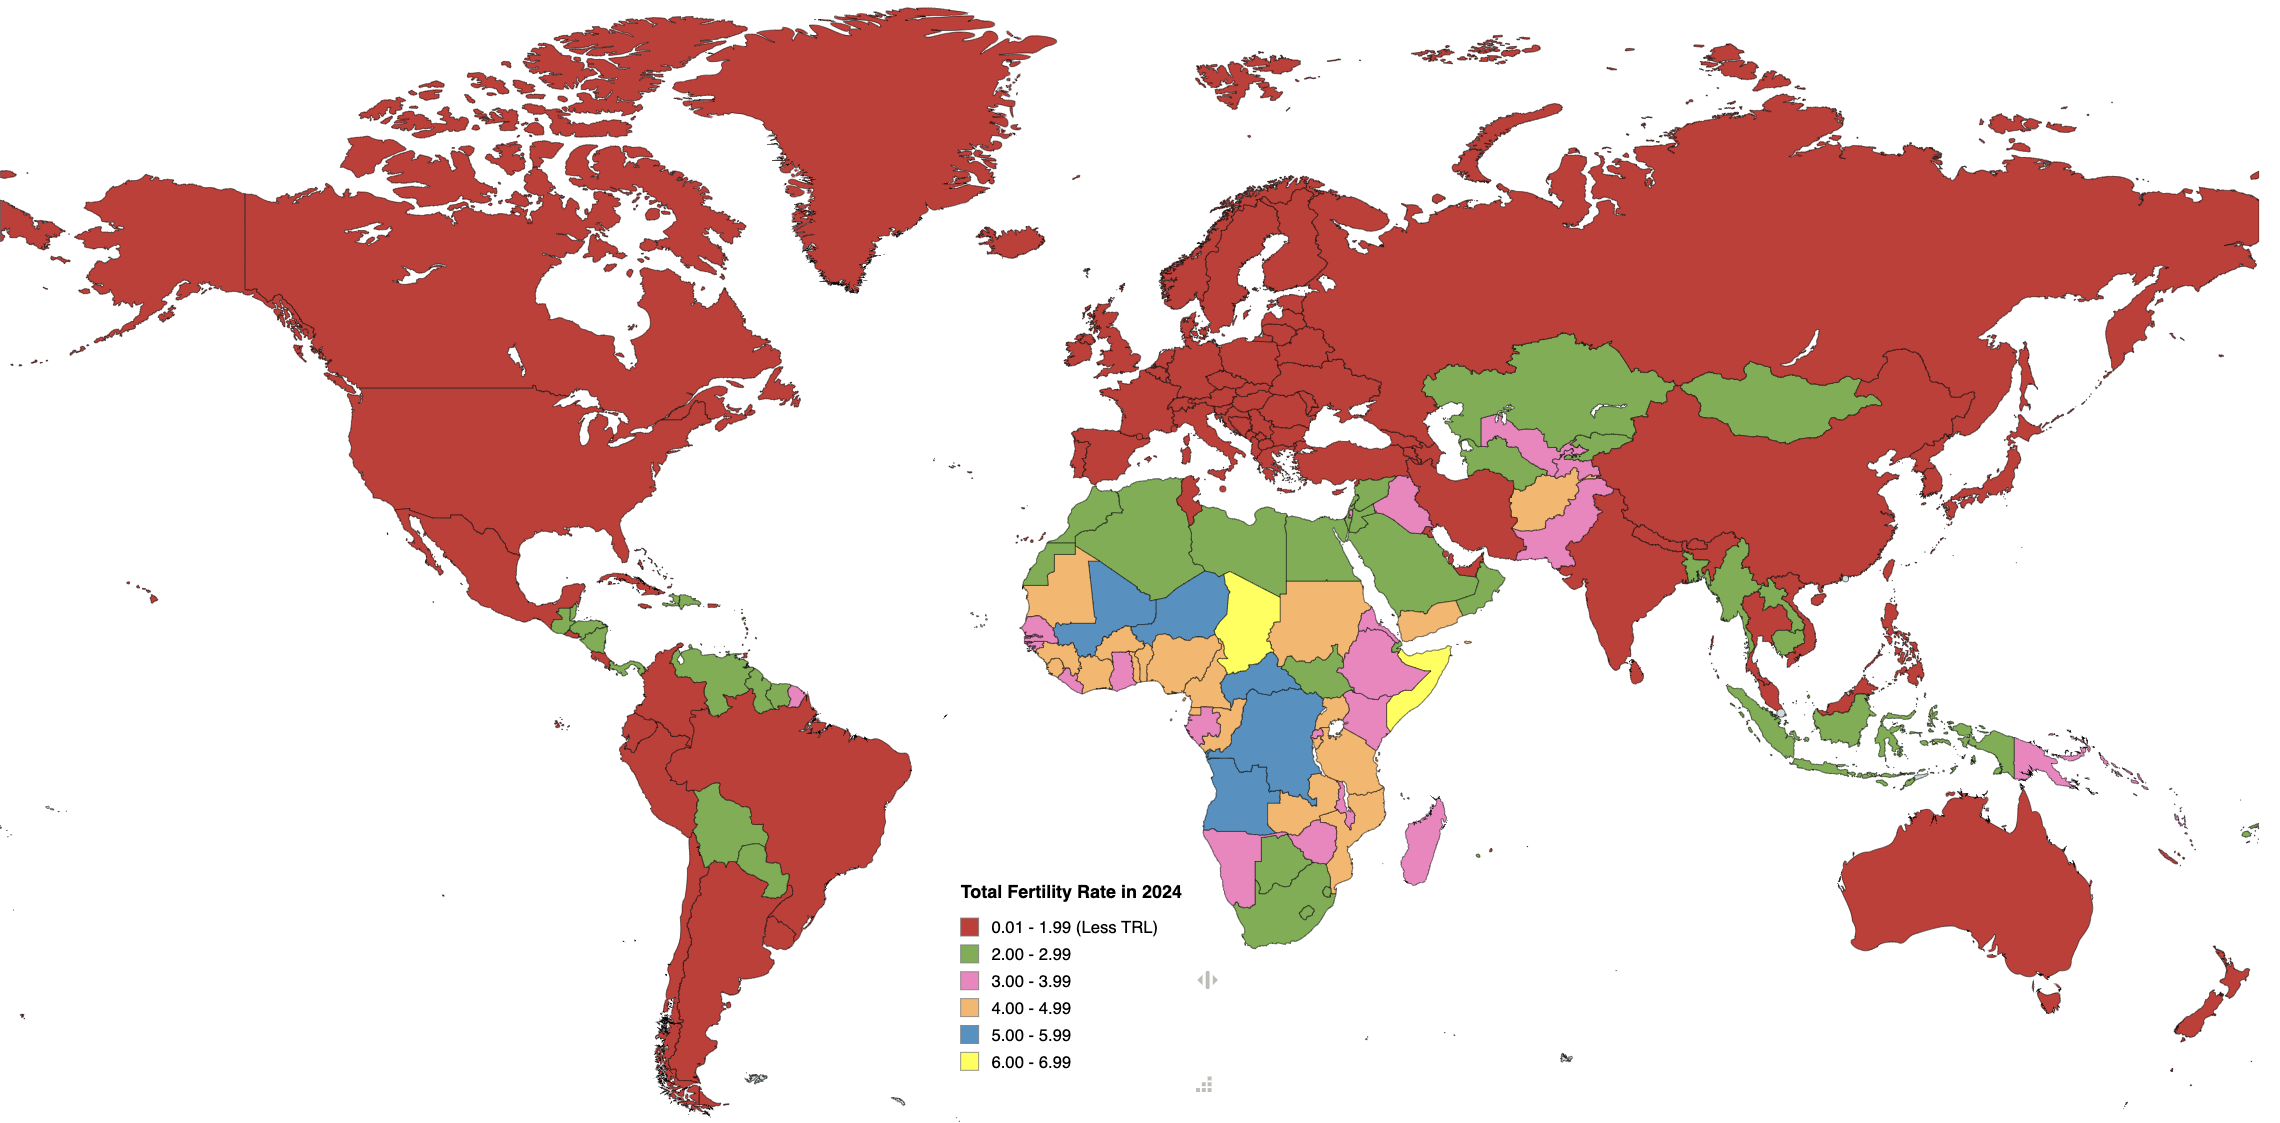
What This Map Shows
This map visually represents the fertility rates of countries around the globe, specifically highlighting those that are above or below the replacement level of 2.0 as of 2024. The replacement level is critical in demographic studies, as it indicates the number of children each woman must have to maintain a stable population size in the absence of migration. When a country's fertility rate falls below this threshold, it may face significant demographic challenges in the future, such as an aging population and workforce shortages. Conversely, countries with rates above 2.0 might experience rapid population growth, which can strain resources and infrastructure.
Deep Dive into Fertility Rates
Fertility rates are influenced by a myriad of factors, including cultural norms, economic conditions, access to healthcare, and family planning services. Countries with higher fertility rates often have traditional views on family size and lower access to education and contraceptives. For instance, many nations in Sub-Saharan Africa, such as Niger and Angola, report fertility rates above 5.0. This can be attributed to factors like limited education for women, high rates of early marriage, and less access to reproductive health care.
Interestingly, regions such as Europe and East Asia are experiencing declining fertility rates, often falling well below the replacement level. Countries like Italy, Spain, and Japan face rates close to 1.3, which raises concerns about long-term population sustainability. The implications of these low fertility rates can be profound. Nations may grapple with labor shortages, increased healthcare costs for an aging population, and the challenge of maintaining economic growth with fewer workers.
Moreover, the reasons for declining fertility in these regions are complex. Urbanization, increased participation of women in the workforce, and a shift in personal priorities toward career and education often contribute to lower birth rates. For example, in South Korea, the government has implemented various policies to encourage childbirth, such as financial incentives and improved parental leave, yet the fertility rate remains stubbornly low at around 0.8.
Regional Analysis
When analyzing fertility rates by region, distinct patterns emerge. In Africa, the fertility rates are generally high, with countries like Chad and Mali exceeding 5.0. This high rate can be linked to cultural factors, economic reliance on agriculture, and limited access to family planning resources. On the other hand, in regions like North America and Europe, the trend is toward lower fertility. Countries such as Germany and France have made strides to increase their fertility rates through family-friendly policies, yet they still hover around 1.5 and 1.8, respectively.
Interestingly, some countries have successfully balanced high immigration rates and low fertility rates to stabilize their populations. For instance, Canada sees a fertility rate of around 1.5 but offsets this with a robust immigration policy that welcomes young families from various countries. This strategic approach helps maintain a younger demographic profile, which is essential for economic vitality and social sustainability.
Significance and Impact
Understanding fertility rates is crucial for anticipating demographic changes and their implications on society. Countries with low fertility rates may face challenges such as a shrinking workforce, increased dependency on social services, and potential economic stagnation. In contrast, those with high fertility rates might struggle with providing education, healthcare, and employment opportunities for their growing populations.
Moreover, the global landscape is changing. The United Nations projects that by 2050, the global population could reach approximately 9.7 billion, with significant growth concentrated in certain regions. Countries that adapt their policies to these demographic realities will be better positioned to address the challenges of population dynamics. Have you noticed how urbanization trends are influencing family sizes in various regions? It’s a fascinating area of study that highlights the interconnectedness of social, economic, and environmental factors in shaping our world.
In conclusion, the fertility rates map for 2024 offers a snapshot of our world’s demographic landscape, revealing the challenges and opportunities that lie ahead. By understanding these patterns, we can better prepare for the future and create policies that support sustainable development and population health.
Visualization Details
- Published
- August 30, 2025
- Views
- 302
Comments
Loading comments...