Total Fertility Rate by Country Map 2025

David Chen
Data Visualization Specialist
David Chen is an expert in transforming complex geographic datasets into compelling visual narratives. He combines his background in computer science ...
Geographic Analysis
What This Map Shows
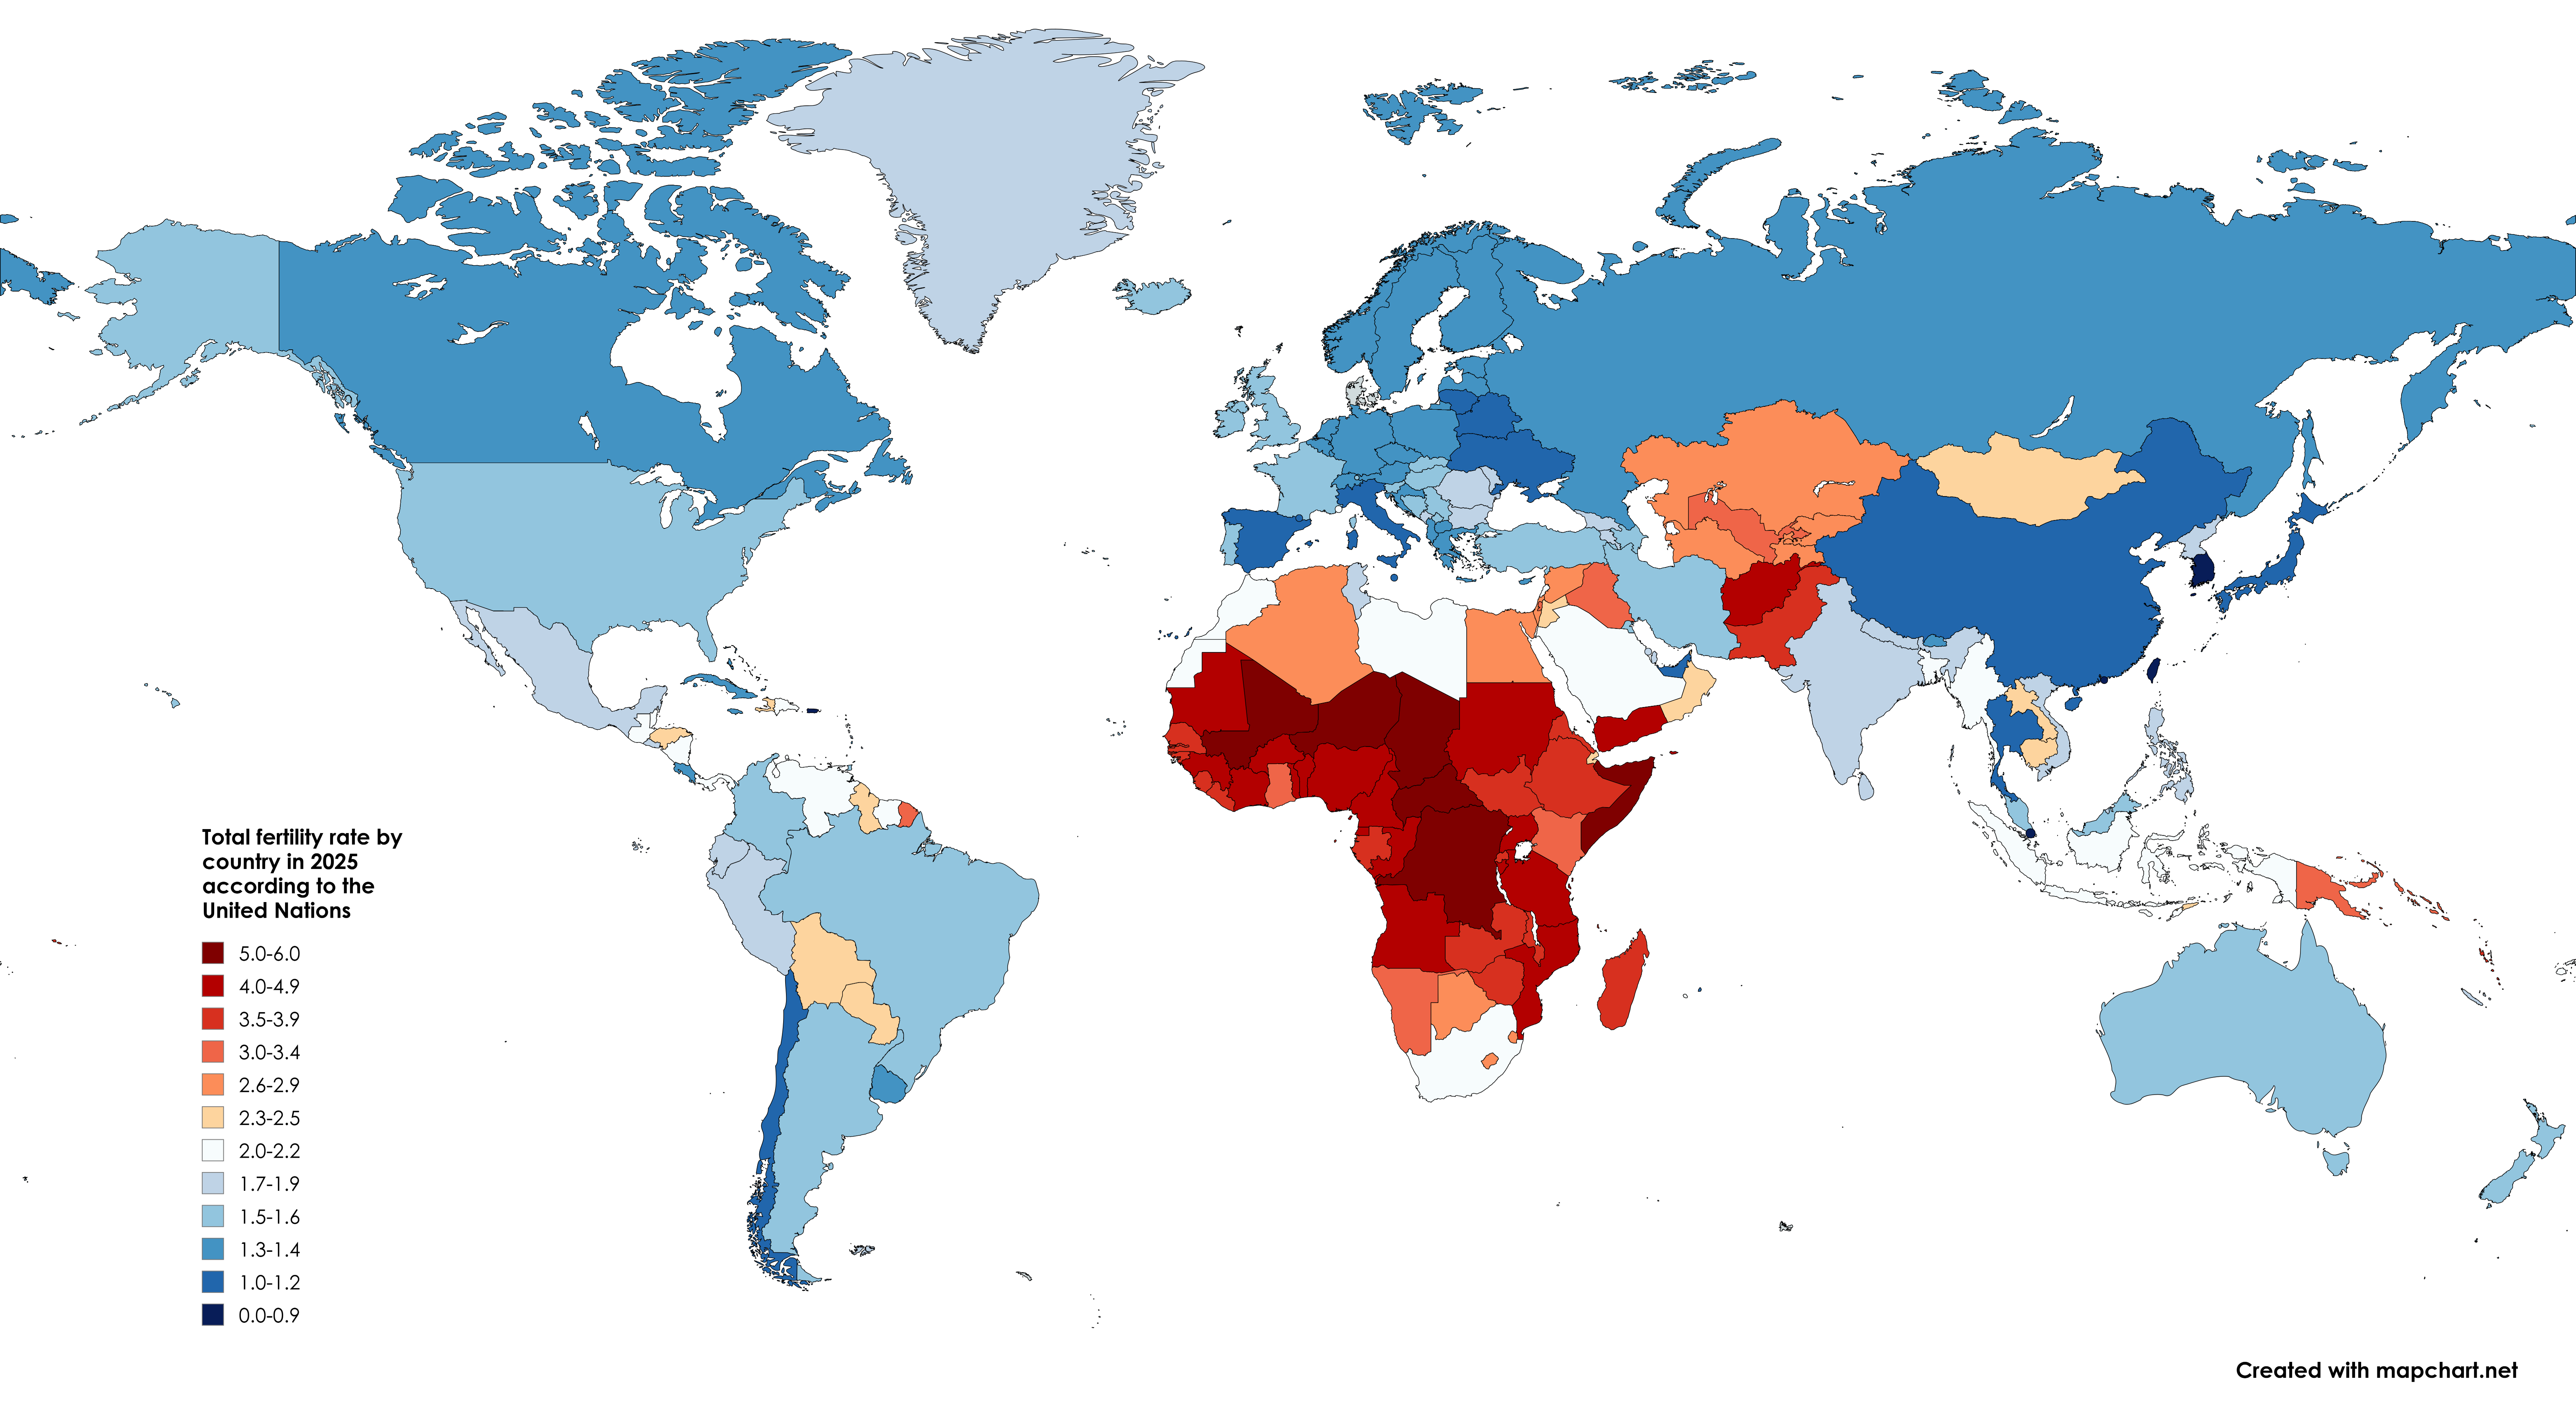
This map visualizes the total fertility rate (TFR) by country in 2025, based on projections from the United Nations. The total fertility rate is a key demographic indicator that reflects the average number of children a woman would have over her lifetime, assuming she experiences the exact current age-specific fertility rates throughout her lifetime. In this visualization, countries are color-coded to represent different levels of fertility, providing a clear snapshot of reproductive patterns across the globe.
Deep Dive into Total Fertility Rate
The total fertility rate serves as a crucial barometer for understanding population dynamics, societal trends, and economic conditions in various regions. Generally, a TFR of about 2.1 is considered the replacement level, meaning that it is the number of births required to maintain a population size. However, many factors influence fertility rates, including cultural, economic, and social influences.
Interestingly, countries with high fertility rates often face challenges related to economic development and resource allocation. For instance, many sub-Saharan African nations, such as Niger and the Democratic Republic of Congo, have TFRs exceeding 5.0. In these regions, high fertility is frequently associated with lower levels of education, limited access to family planning resources, and cultural norms that favor larger families. These factors can create a cycle of poverty and hinder economic development, as resources become strained under rapidly growing populations.
Conversely, many developed nations, particularly in Europe and parts of East Asia, are experiencing low fertility rates—often below the replacement level. Countries like Japan, Italy, and Germany are grappling with TFRs around 1.4 or lower. This trend raises concerns about aging populations and labor shortages, leading to potential economic stagnation. Interestingly, these nations are exploring various strategies to encourage higher birth rates, including family-friendly policies, increased parental leave, and financial incentives for families.
The map also highlights the significant regional variations in fertility rates. Countries in the Middle East, such as Iraq and Yemen, often exhibit higher fertility rates, influenced by cultural and religious factors. However, even within regions, there can be stark contrasts. For example, Turkey has a TFR of approximately 2.0, while neighboring Greece has a much lower rate of around 1.3, demonstrating the diverse demographic landscapes that exist within close geographical proximity.
Regional Analysis
When examining the map regionally, it's clear that Africa stands out with some of the highest fertility rates globally. Countries in this region, such as Niger and Angola, not only have TFRs above 5.0 but also face unique challenges such as high maternal mortality rates and limited access to healthcare. These high fertility rates often correlate with lower educational attainment among women, perpetuating cycles of poverty.
In contrast, regions like Europe and North America display much lower fertility rates. For instance, countries like France and Sweden, which have relatively higher TFRs compared to their European counterparts, have implemented supportive policies for families, such as subsidized childcare and paid parental leave. This has resulted in a more favorable environment for child-rearing, which is reflected in their fertility statistics.
In Asia, the landscape is mixed. Nations like India are experiencing a gradual decline in TFR, from 2.5 in recent years down to 2.2 by 2025, as urbanization and education rates among women improve. Meanwhile, countries like South Korea and Singapore continue to struggle with some of the lowest rates globally, under 1.2, prompting fears of demographic decline.
Significance and Impact
Understanding total fertility rates is pivotal not just for predicting population changes but also for shaping policies that address the needs of varying demographics. Countries with high fertility rates may require more resources directed toward education, healthcare, and infrastructure to support growing populations. On the other hand, nations with declining birth rates may need to consider immigration policies and workforce development to sustain economic growth.
As we look toward the future, the trends highlighted by the TFR map indicate a shifting global landscape. With many countries grappling with the implications of aging populations and declining birth rates, there is an urgent need for comprehensive strategies that address these demographic shifts. The interplay of culture, economy, and education will continue to shape fertility patterns, making it essential for policymakers to stay informed and adaptable in their approaches.
In conclusion, the total fertility rate is more than just a number; it is a reflection of societal values, economic realities, and future potential. By understanding these dynamics, we can better anticipate the challenges and opportunities that lie ahead in an ever-changing world.
Visualization Details
- Published
- August 22, 2025
- Views
- 142
Comments
Loading comments...