Global Fertility Rate Map

Alex Cartwright
Senior Cartographer & GIS Specialist
Alex Cartwright is a renowned cartographer and geographic information systems specialist with over 15 years of experience in spatial analysis and data...
Geographic Analysis
What This Map Shows
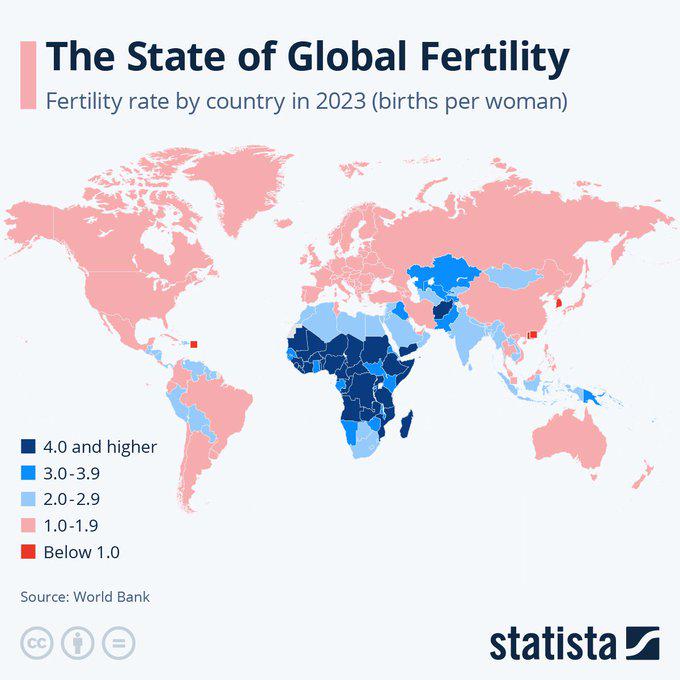
The "Global Fertility Rate Map" provides a visual representation of birth rates across various countries, illustrating the average number of children born to a woman over her lifetime. This map serves as a critical tool for understanding demographic trends and population growth patterns worldwide. As we delve deeper into the topic of fertility rates, it’s essential to recognize how these numbers reflect broader socio-economic conditions, cultural norms, and health policies within each region.
Deep Dive into Global Fertility Rates
Fertility rates are influenced by a myriad of factors, including education, access to healthcare, economic stability, and cultural attitudes toward family size. Interestingly, high fertility rates are often found in developing nations, where access to education and reproductive health services may be limited. For instance, countries in Sub-Saharan Africa typically report some of the highest fertility rates globally, with nations such as Niger and Angola showing averages of over six children per woman.
Conversely, many developed countries, particularly in Europe and parts of East Asia, exhibit much lower fertility rates, often below the replacement level of 2.1 children per woman. Countries like Japan and Italy face significant demographic challenges due to their aging populations and declining birth rates. This phenomenon raises questions about sustainability, labor markets, and social services in these nations.
The reasons behind these trends are complex. In developed countries, factors such as increased participation of women in the workforce, access to contraception, and shifting societal values regarding marriage and parenthood contribute to lower birth rates. Moreover, economic considerations often play a pivotal role; families may choose to delay having children or opt for smaller families due to high living costs and housing prices.
Moreover, the global landscape is changing rapidly. In some regions, governments are actively incentivizing higher birth rates through policies such as parental leave, childcare support, and financial subsidies for families. For example, countries like France and Sweden have implemented such measures with varying degrees of success, leading to slightly higher fertility rates compared to their neighbors.
Regional Analysis
When we analyze the map regionally, distinct patterns emerge. In Sub-Saharan Africa, countries such as Mali and Chad depict some of the highest fertility rates, often exceeding five children per woman. This can be attributed to cultural norms that favor larger families, where children are seen as a source of labor and support in old age.
In contrast, in North America and Western Europe, fertility rates are generally lower. For instance, the United States has a fertility rate hovering around 1.7 children per woman, with significant variations among different ethnic and socio-economic groups. Interestingly, Scandinavian countries consistently rank higher than their European counterparts, with rates around 1.9 to 2.0, largely due to progressive family policies and social support systems.
Looking towards Asia, countries like India showcase significant diversity. While the national average is about 2.2 children per woman, regional disparities are evident; states like Uttar Pradesh still exhibit much higher fertility rates compared to more developed states like Kerala, where the rate is closer to 1.8. This highlights how regional policies, education, and healthcare access can dramatically influence fertility trends.
Significance and Impact
Understanding global fertility rates is crucial for several reasons. Firstly, these rates directly impact population growth and aging, influencing everything from economic growth to healthcare demands. Countries with high fertility rates may face challenges in providing adequate education and health services, potentially leading to cycles of poverty.
Moreover, as some nations grapple with declining birth rates, they must confront the implications of an aging population. This shift can strain social security systems, healthcare, and workforce availability. Have you noticed how discussions around immigration often arise in the context of declining populations? Countries like Germany and Italy are increasingly looking to immigration as a solution to balance their demographics.
In conclusion, the Global Fertility Rate Map not only illustrates where people are having children but also serves as a lens through which we can examine broader socio-economic trends and challenges. As we move into the future, understanding these dynamics will be essential for policymakers and communities alike, ensuring that they are prepared for the demographic shifts that lie ahead.
Visualization Details
- Published
- August 28, 2025
- Views
- 84
Comments
Loading comments...