socio-economic factors Maps
20 geographic visualizations tagged with "socio-economic factors"
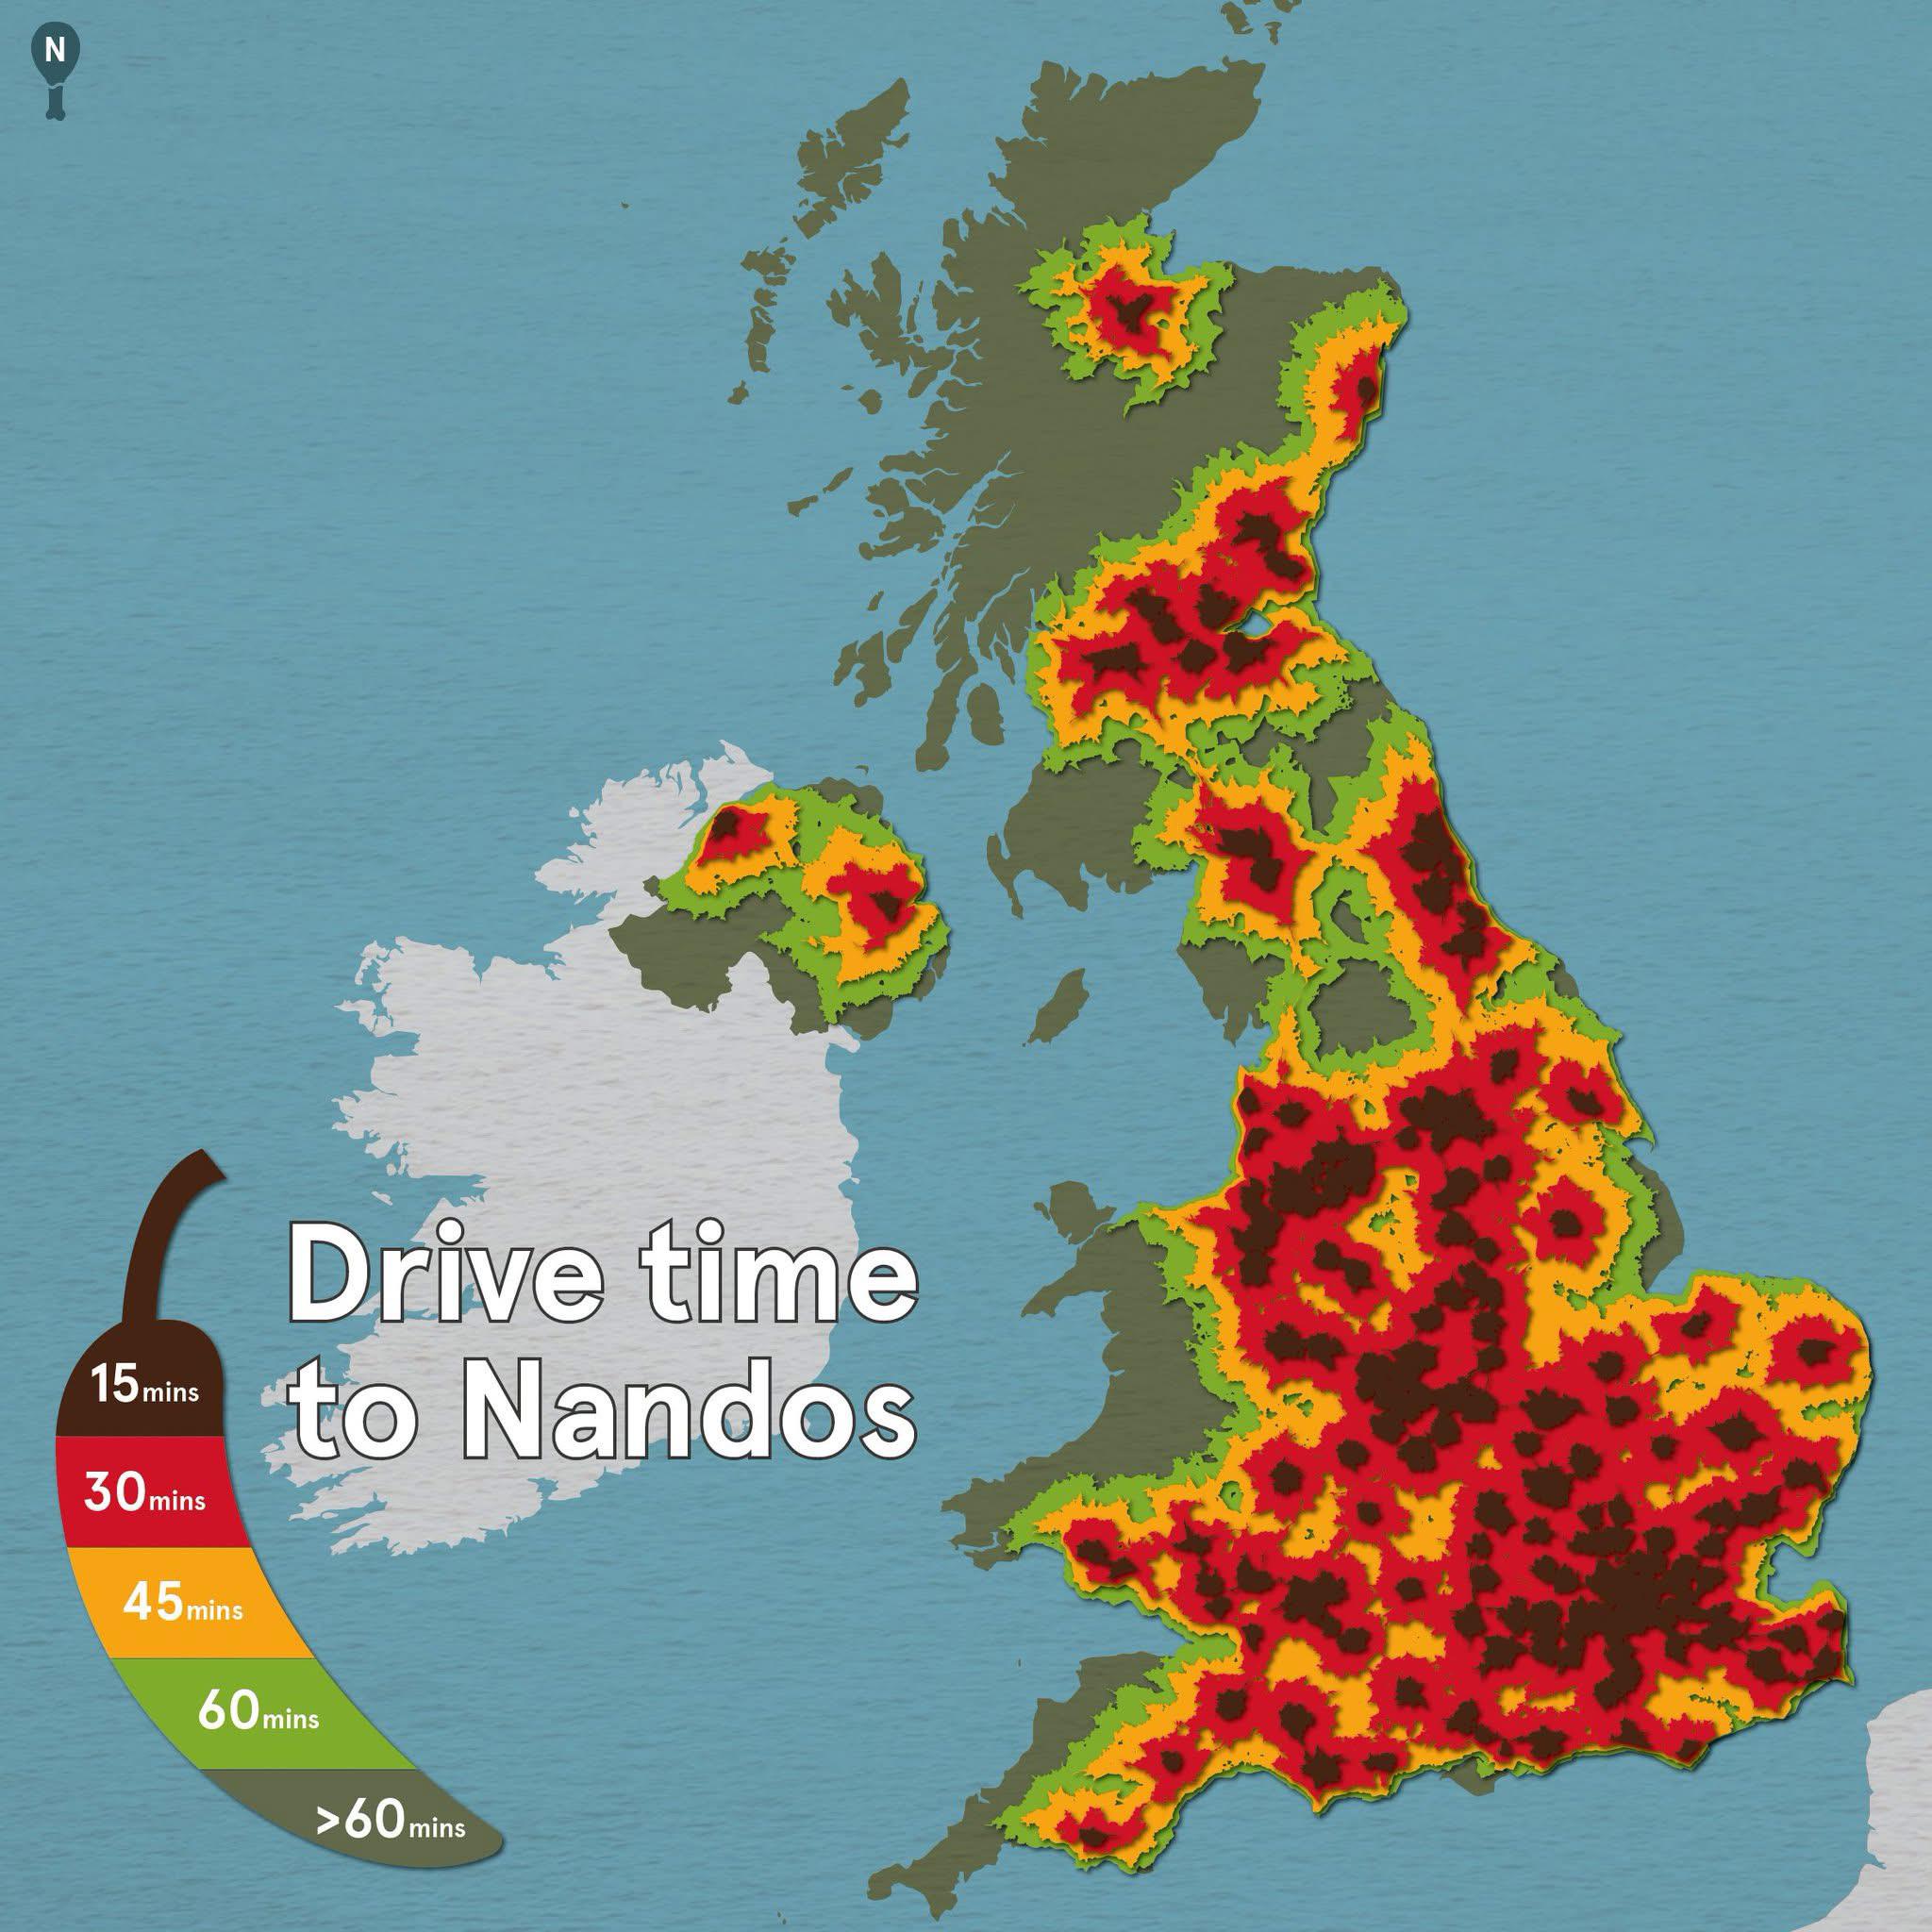
Drive Time to Nando’s in the UK Map
The "Drive Time to Nando’s in the UK" map provides a visual representation of how long it takes to reach various Nando’s...
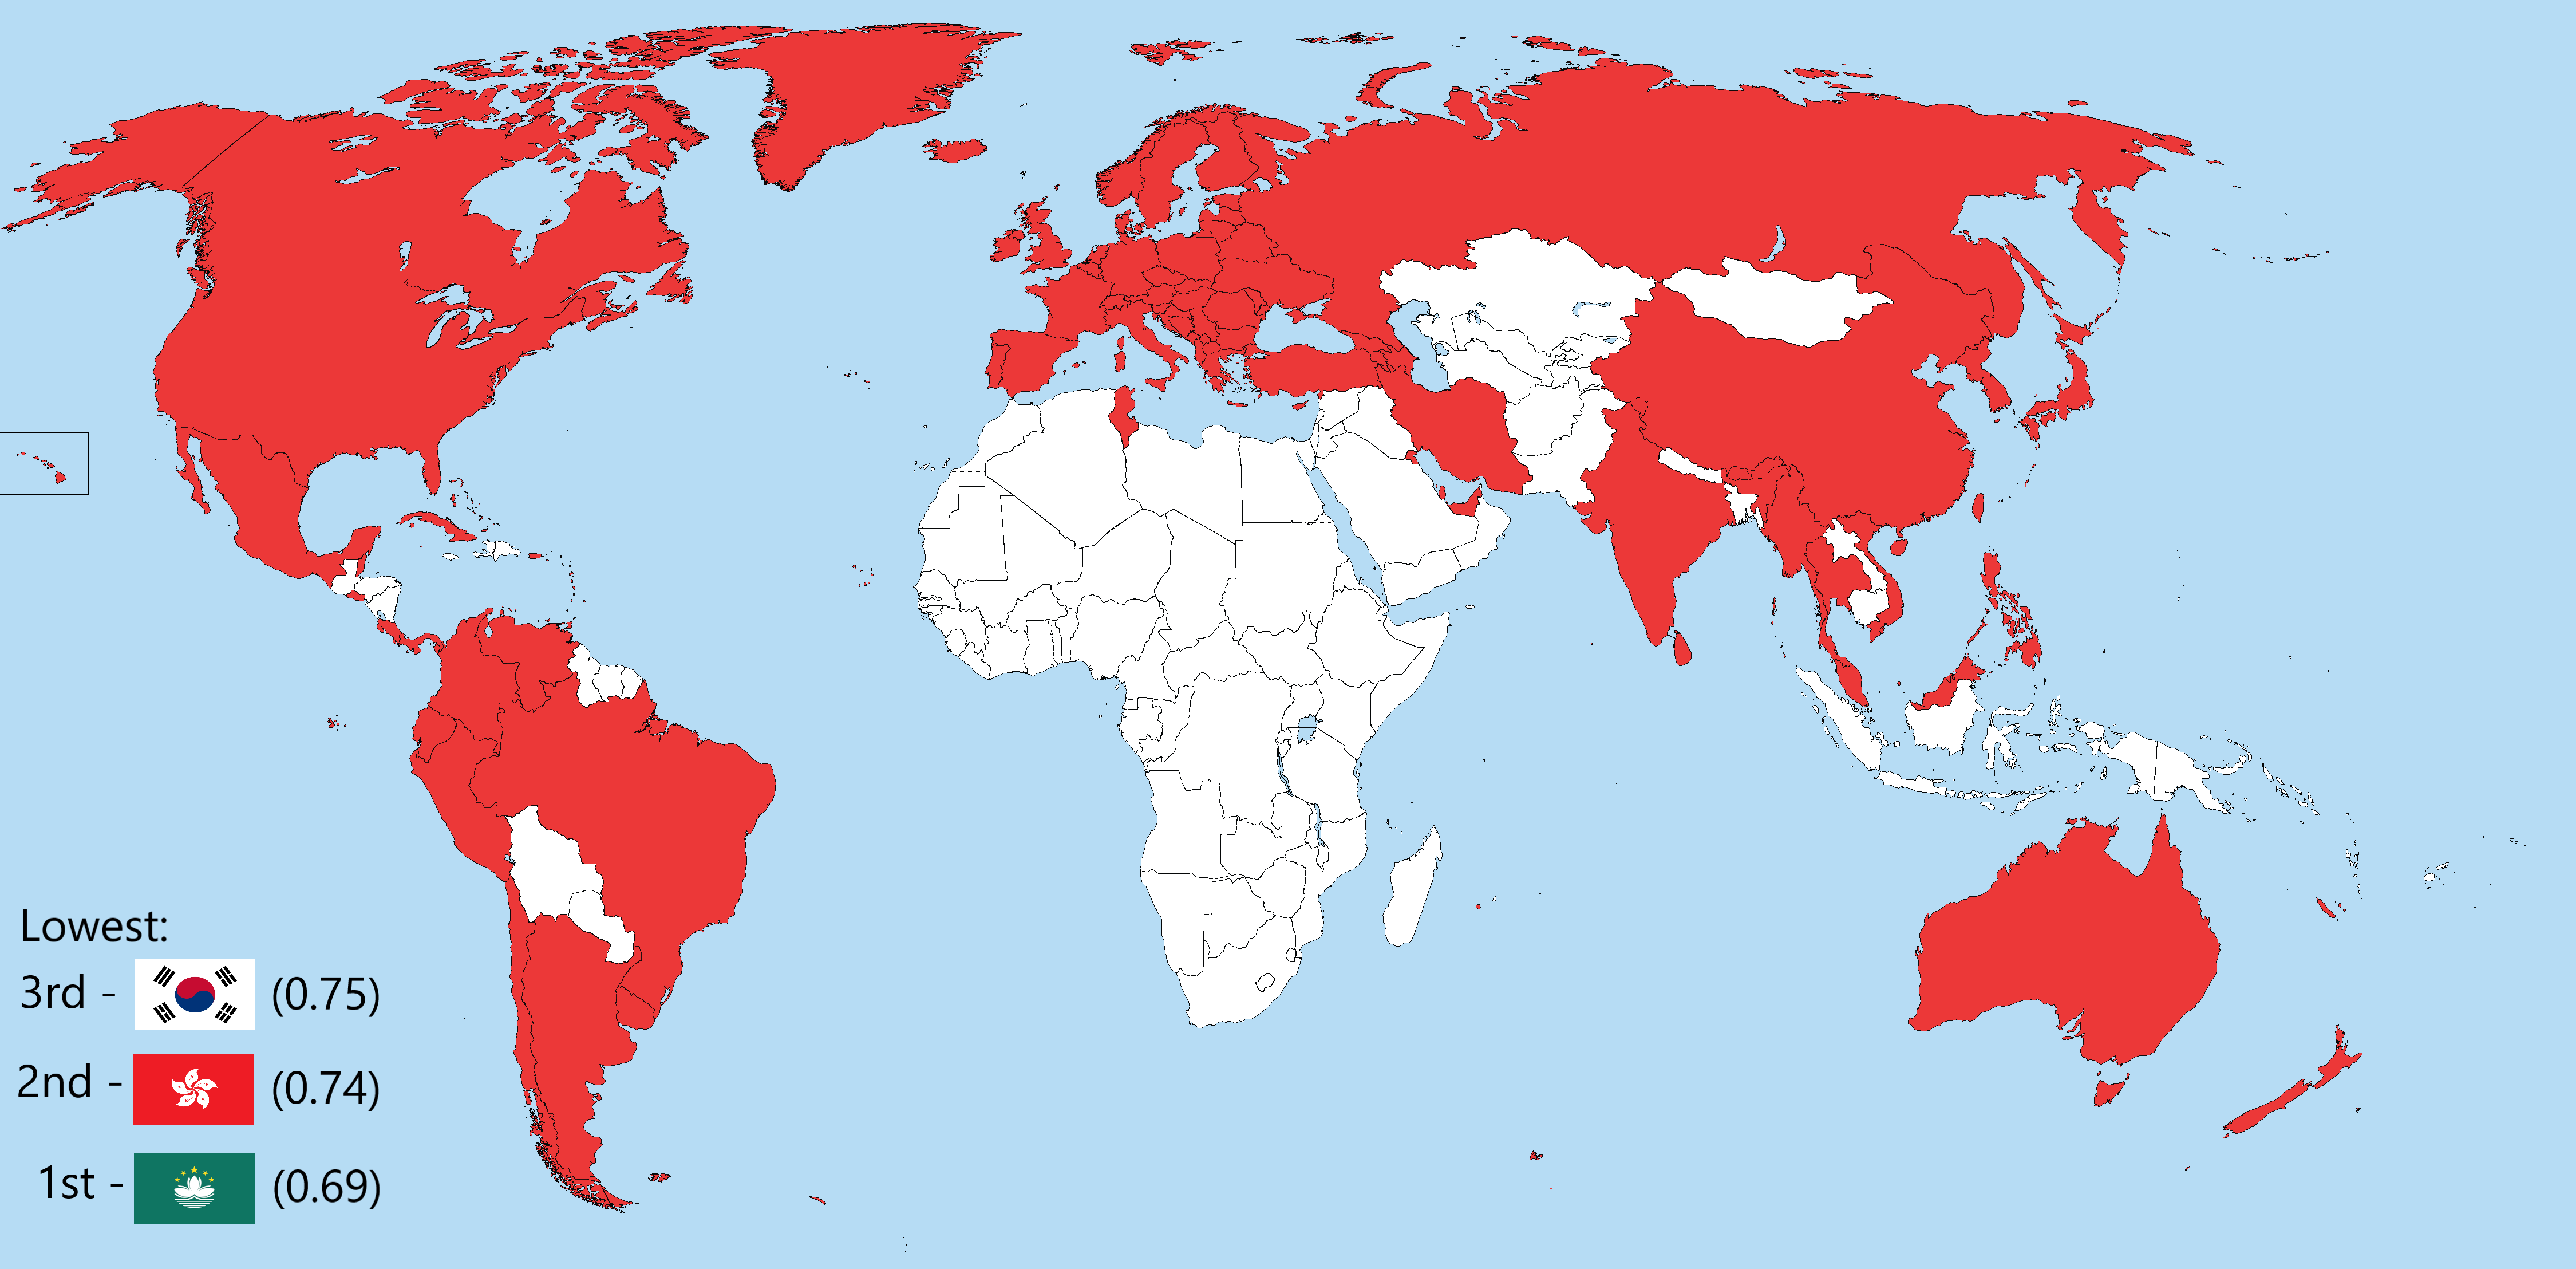
Map of Countries with Births Per Woman Below 2.1
This map provides a clear visualization of countries and territories where the total fertility rate (TFR) falls below th...
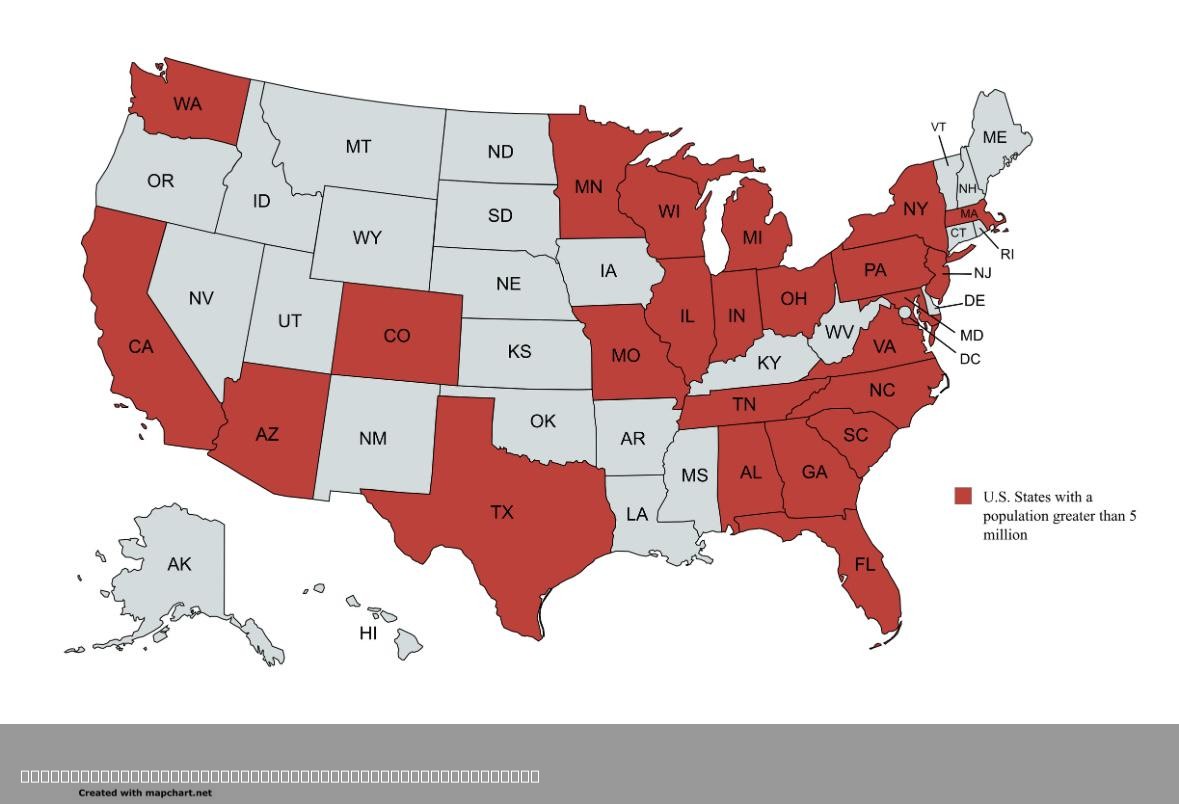
U.S. States with Population Greater than 5 Million Map
This map visualizes the U.S. states that have a population exceeding 5 million people. This population threshold highlig...
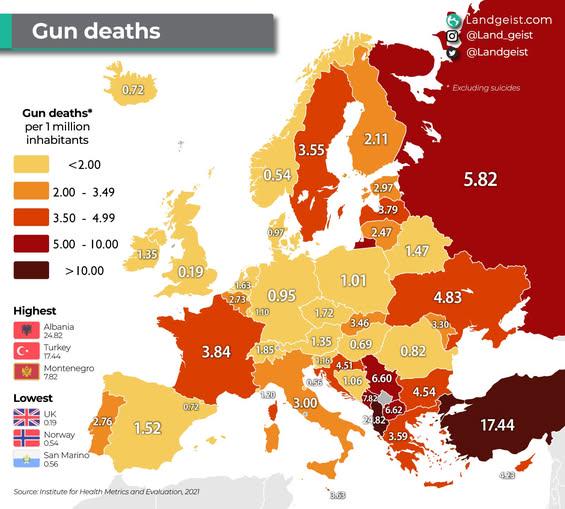
Gun Deaths by Country in Europe Map
The visualization titled "Gun Deaths by Country in Europe Map" presents a stark representation of firearm-related fatali...
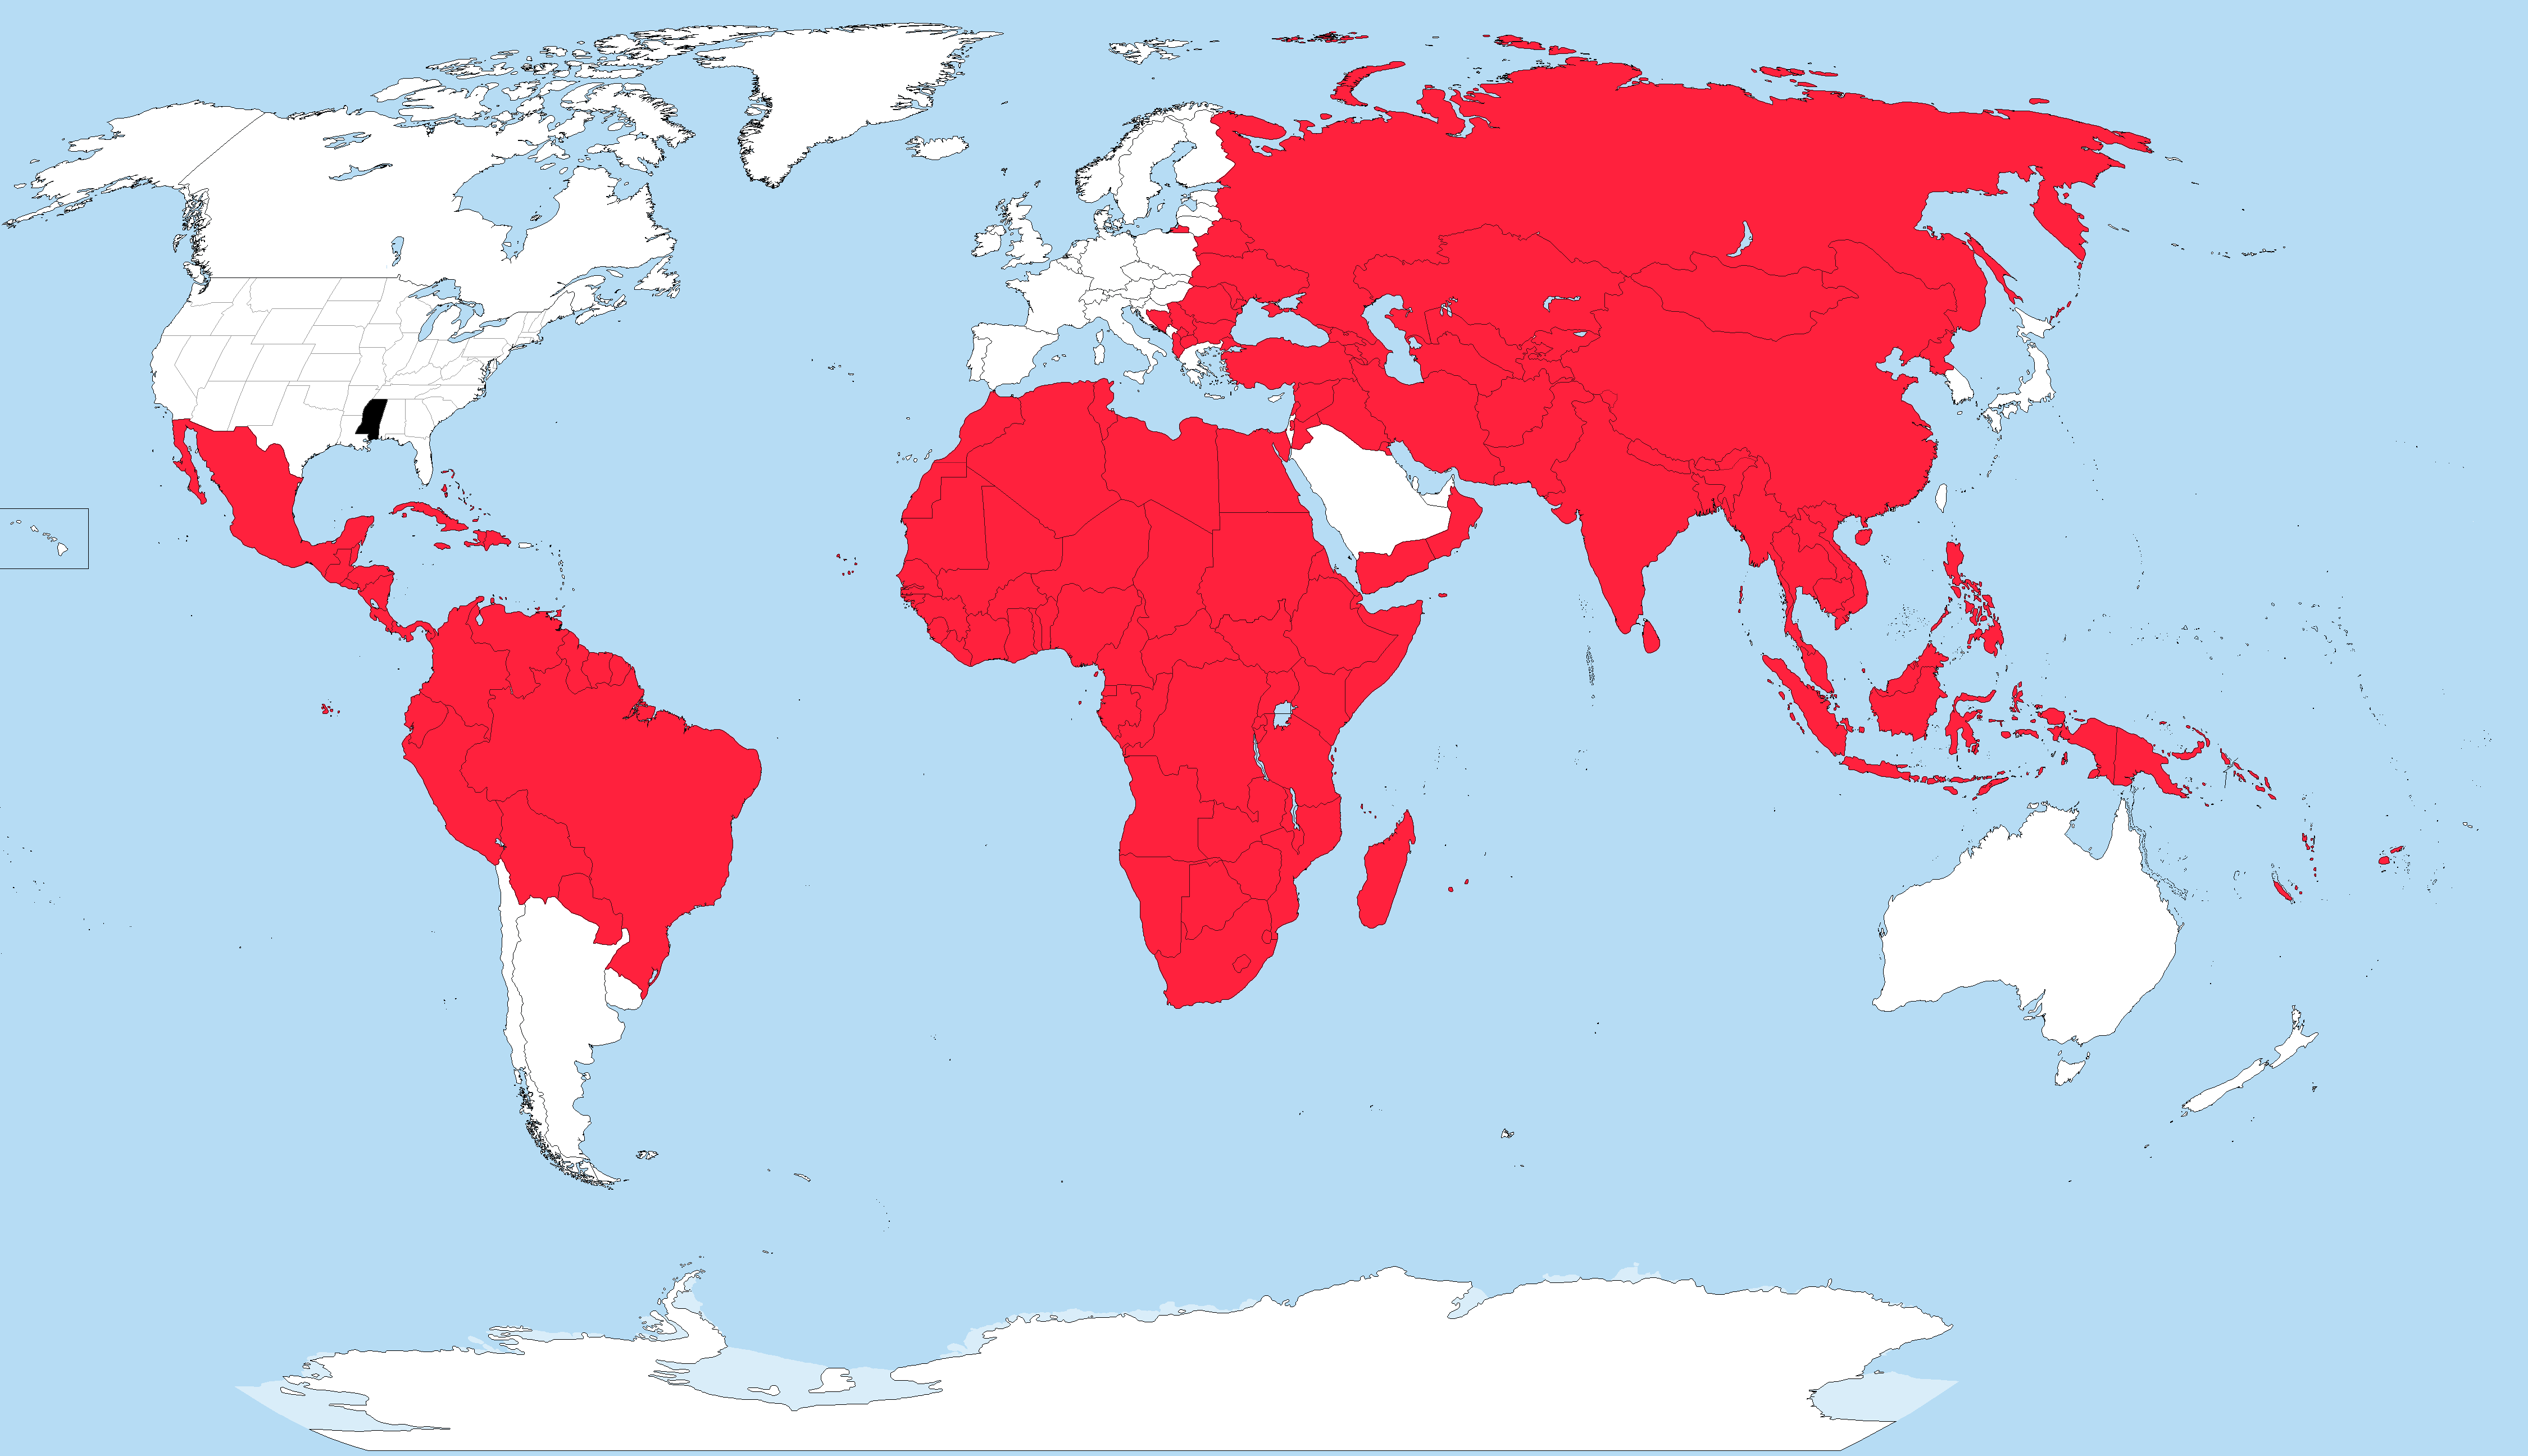
Countries with Lower HDI Than Mississippi Map
This map visualizes the countries that have a Human Development Index (HDI) score lower than Mississippi, which has an H...
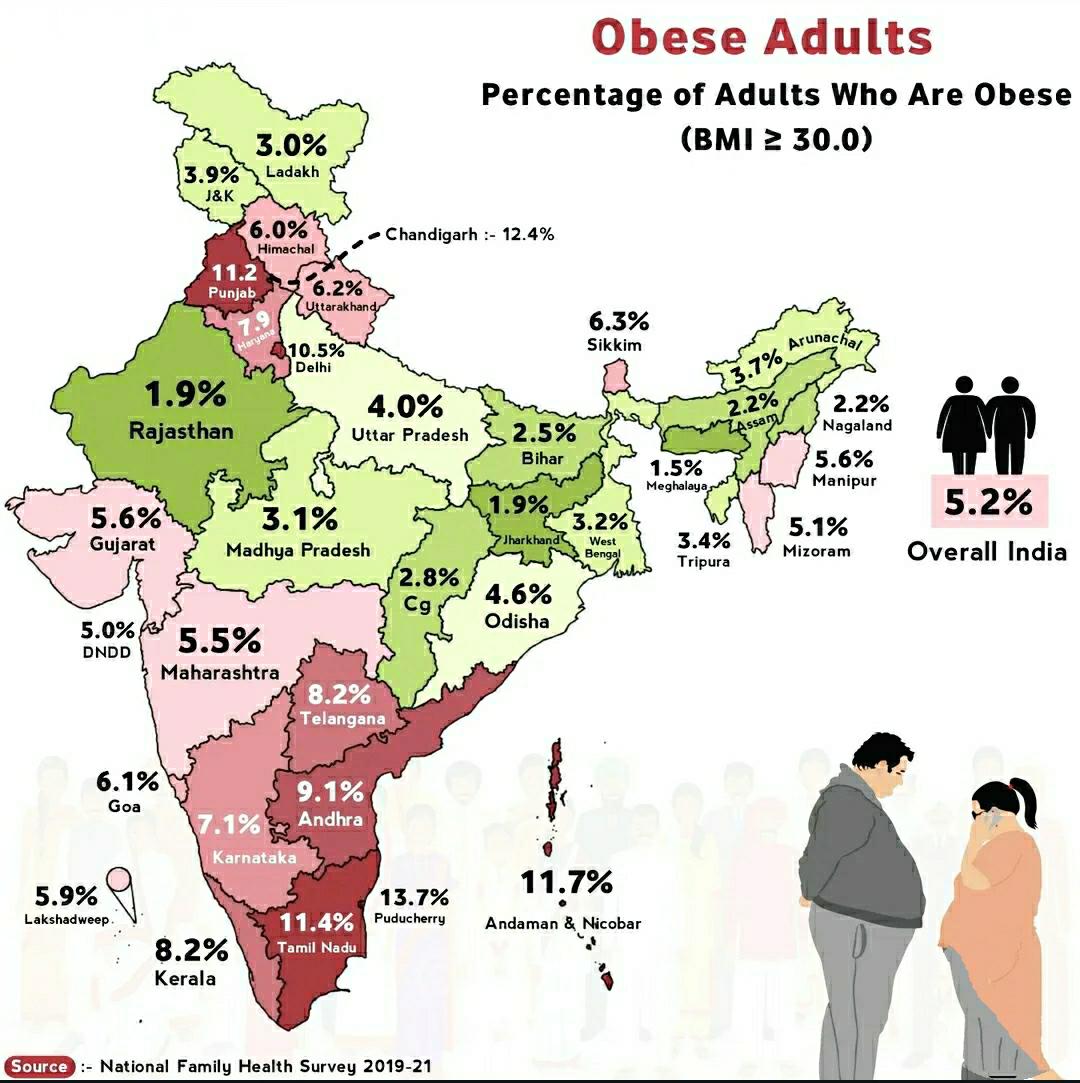
Obese Adults in India Map
The "Obese Adults in India Map" provides a visual representation of the prevalence of obesity among adults across variou...
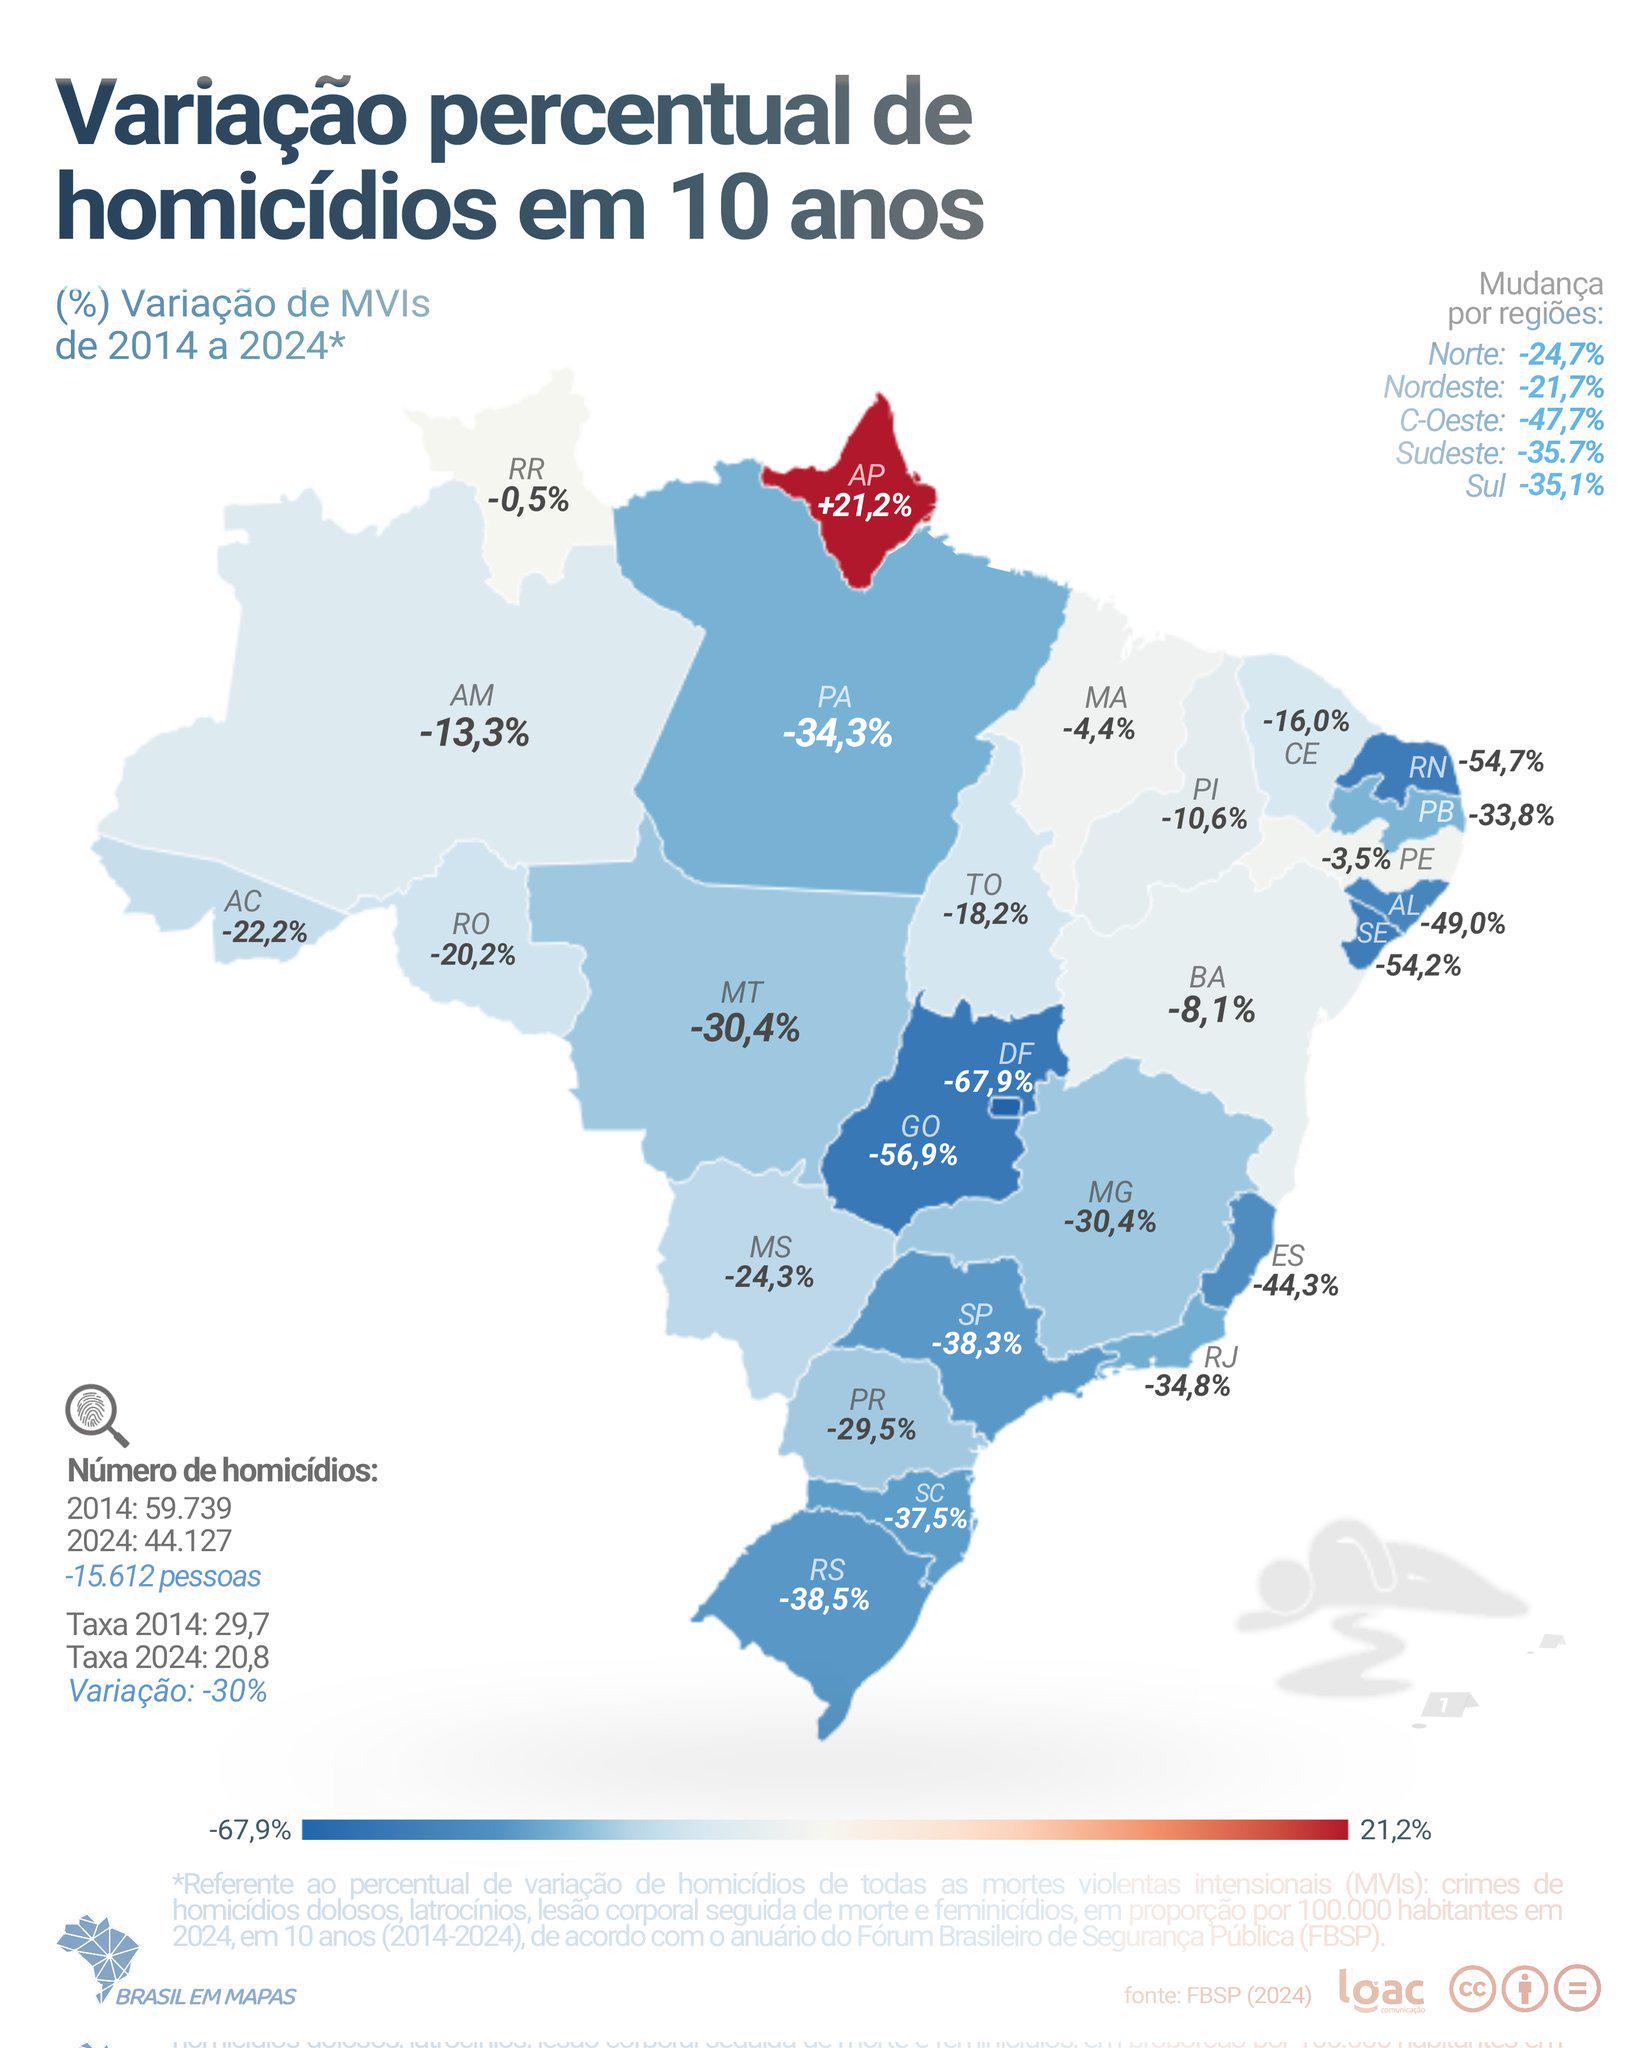
Homicide Rates in Brazil Map 2014 vs 2025
The visualization titled "Annual Homicide Rates in Brazil: 2014 vs 2025" offers a stark comparison of homicide rates acr...

Nile Delta Night Lights Map
...
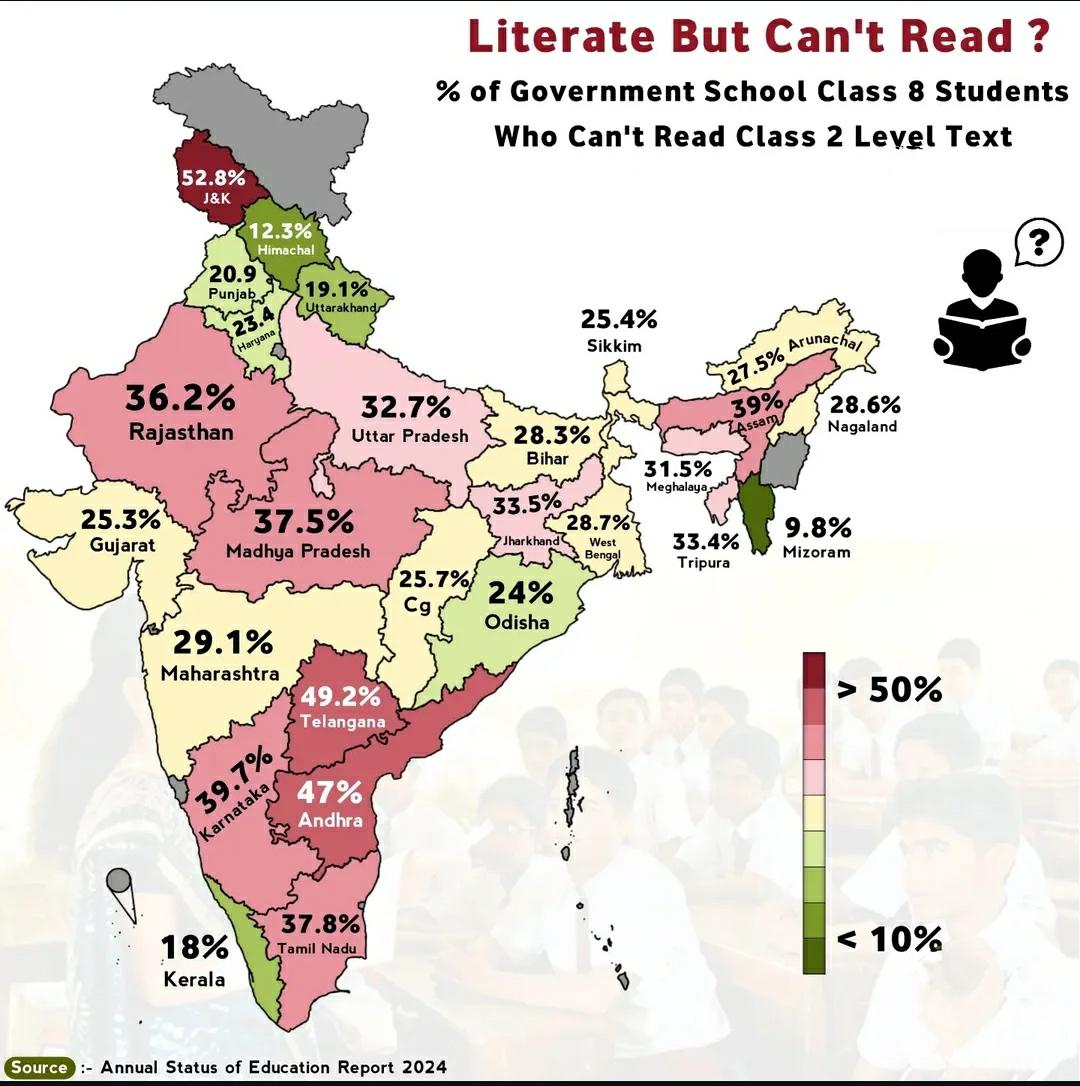
Map of Students Who Can't Read Grade 2 Text in India
This map highlights a critical issue in India's educational landscape: the percentage of students who are unable to read...
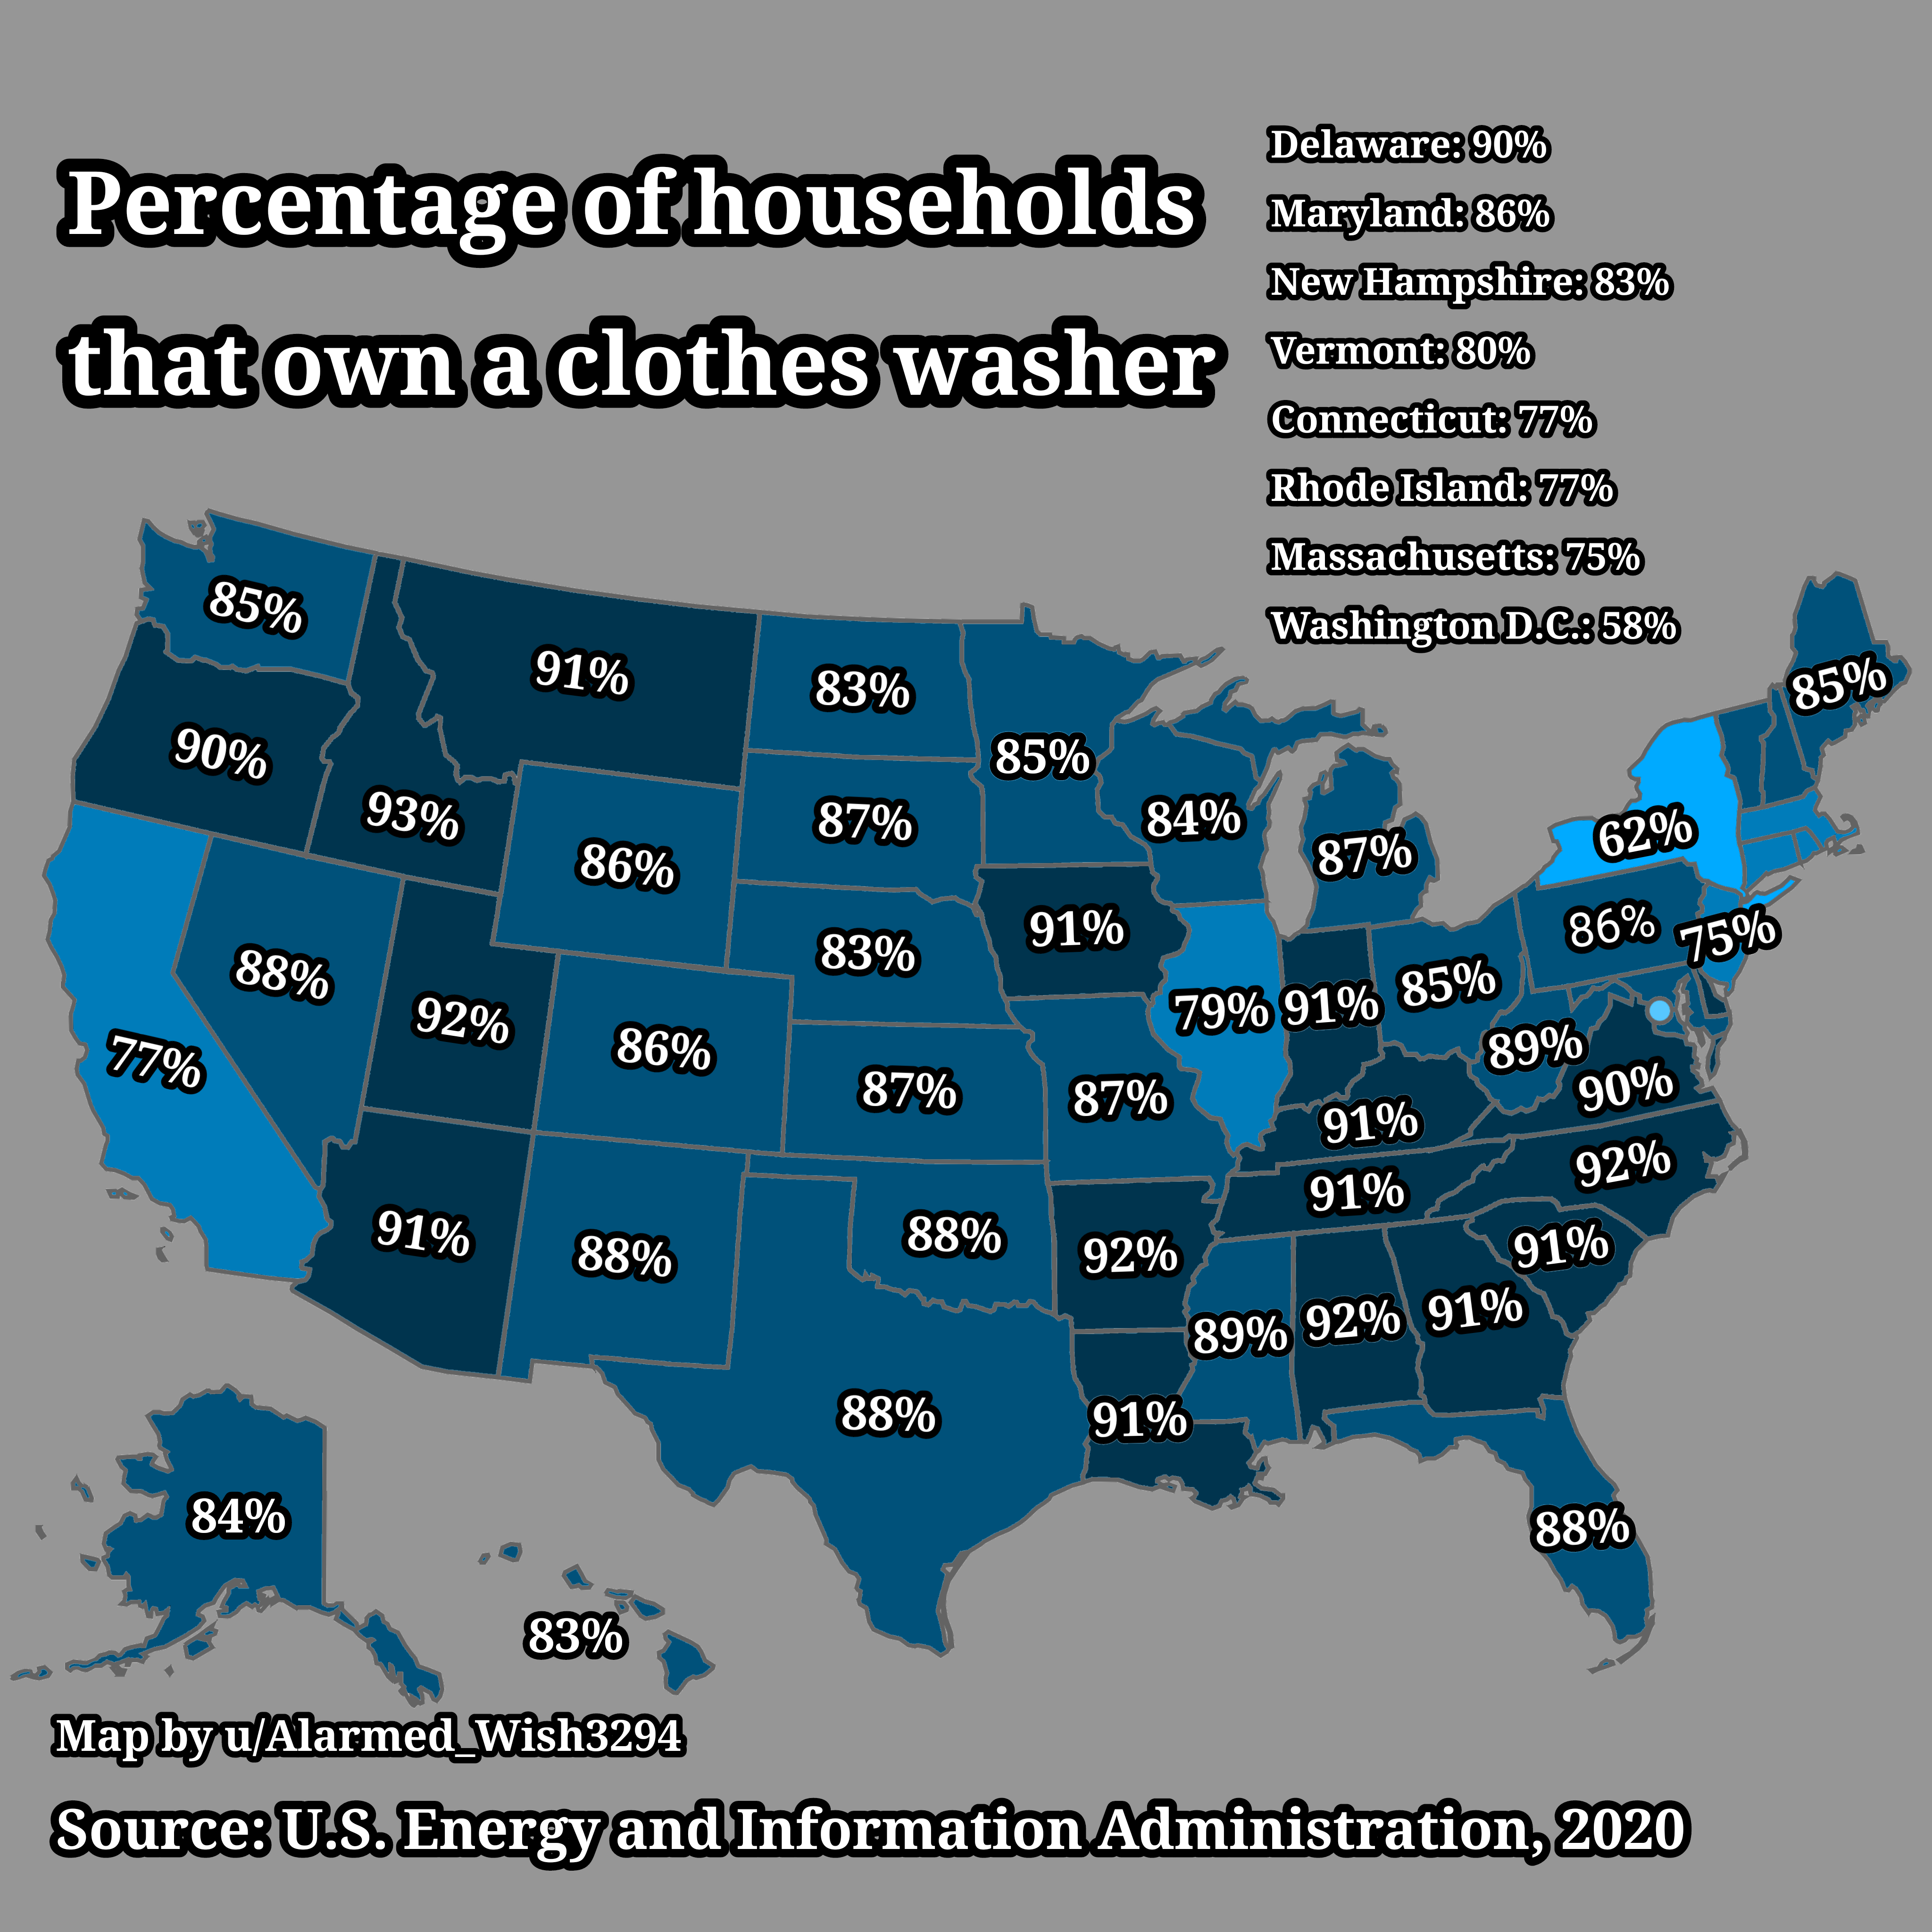
Clothes Washer Ownership Percentage Map in USA
Interestingly, the ownership of clothes washers can also be seen as a marker of technological adoption in households. Re...
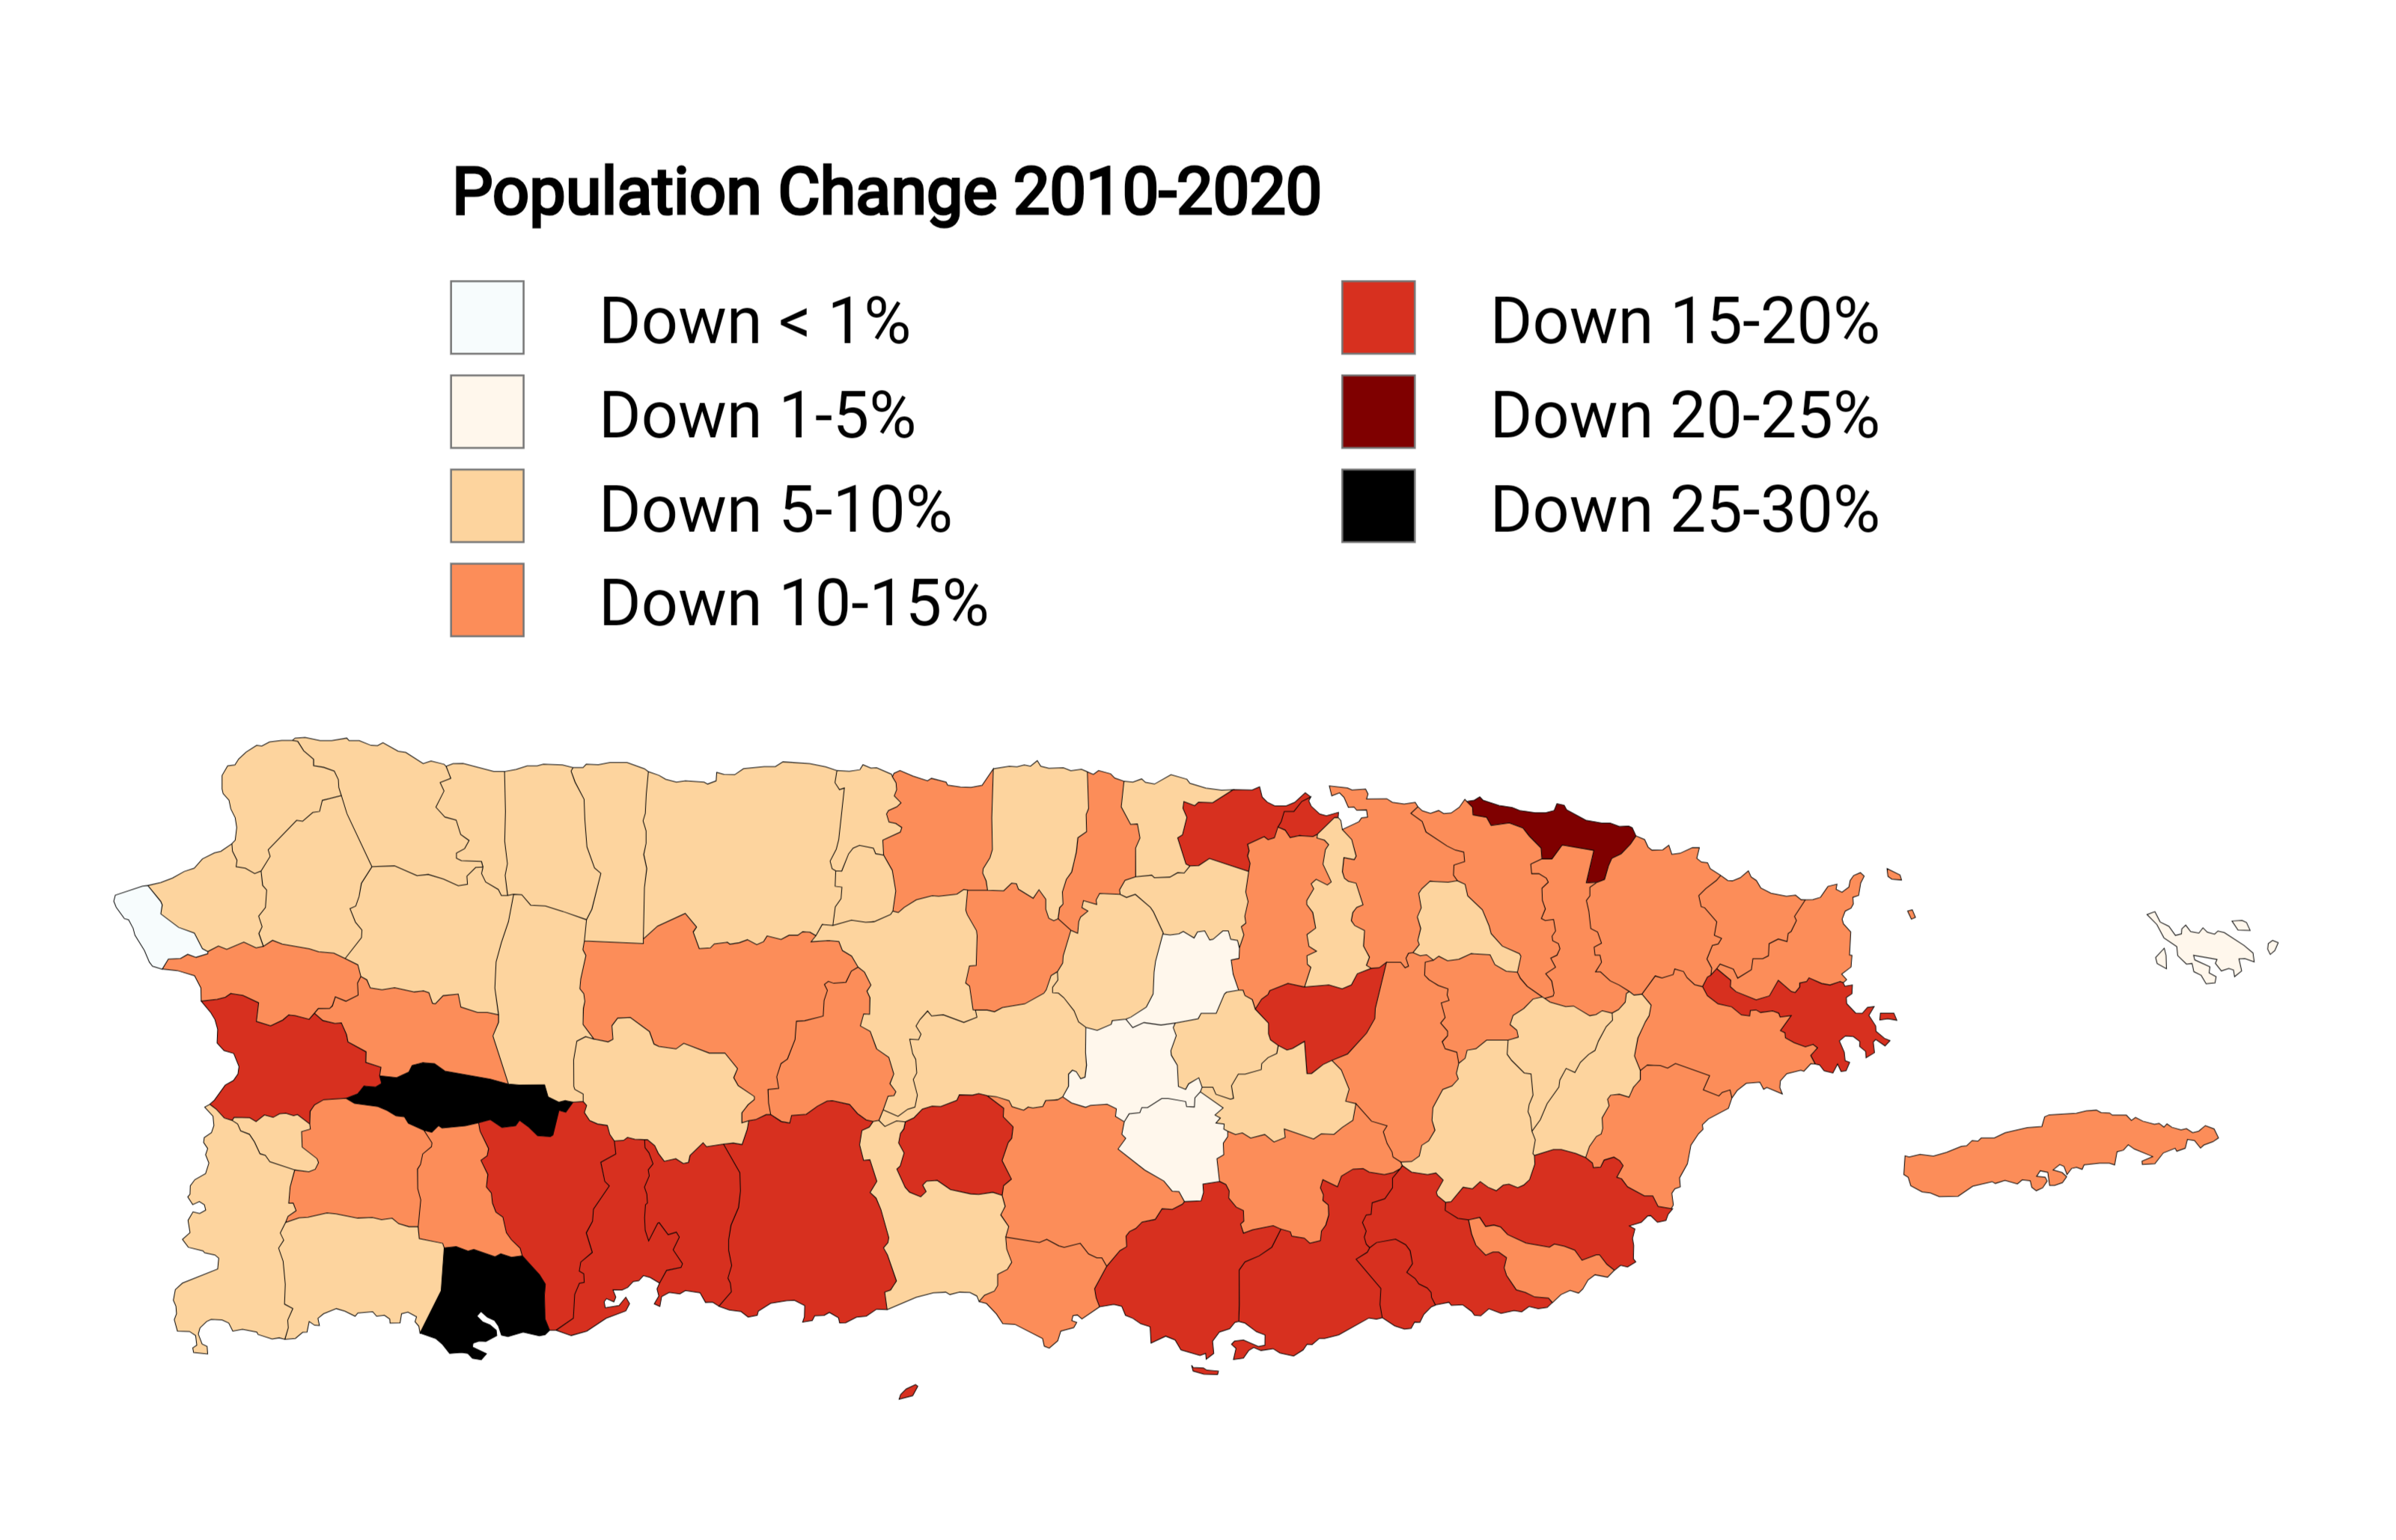
Puerto Rico Population Decline Map 2010-2020
The visualization titled "Puerto Rico's Population Decline (2010-2020)" offers a stark representation of demographic shi...
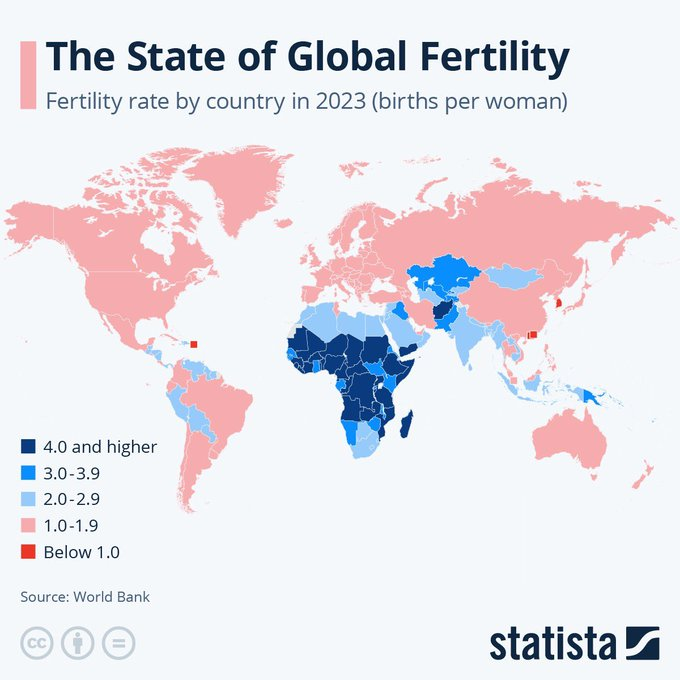
Global Fertility Rates Map
The "Global Fertility Rates Map" provides a comprehensive visualization of fertility rates across different countries an...
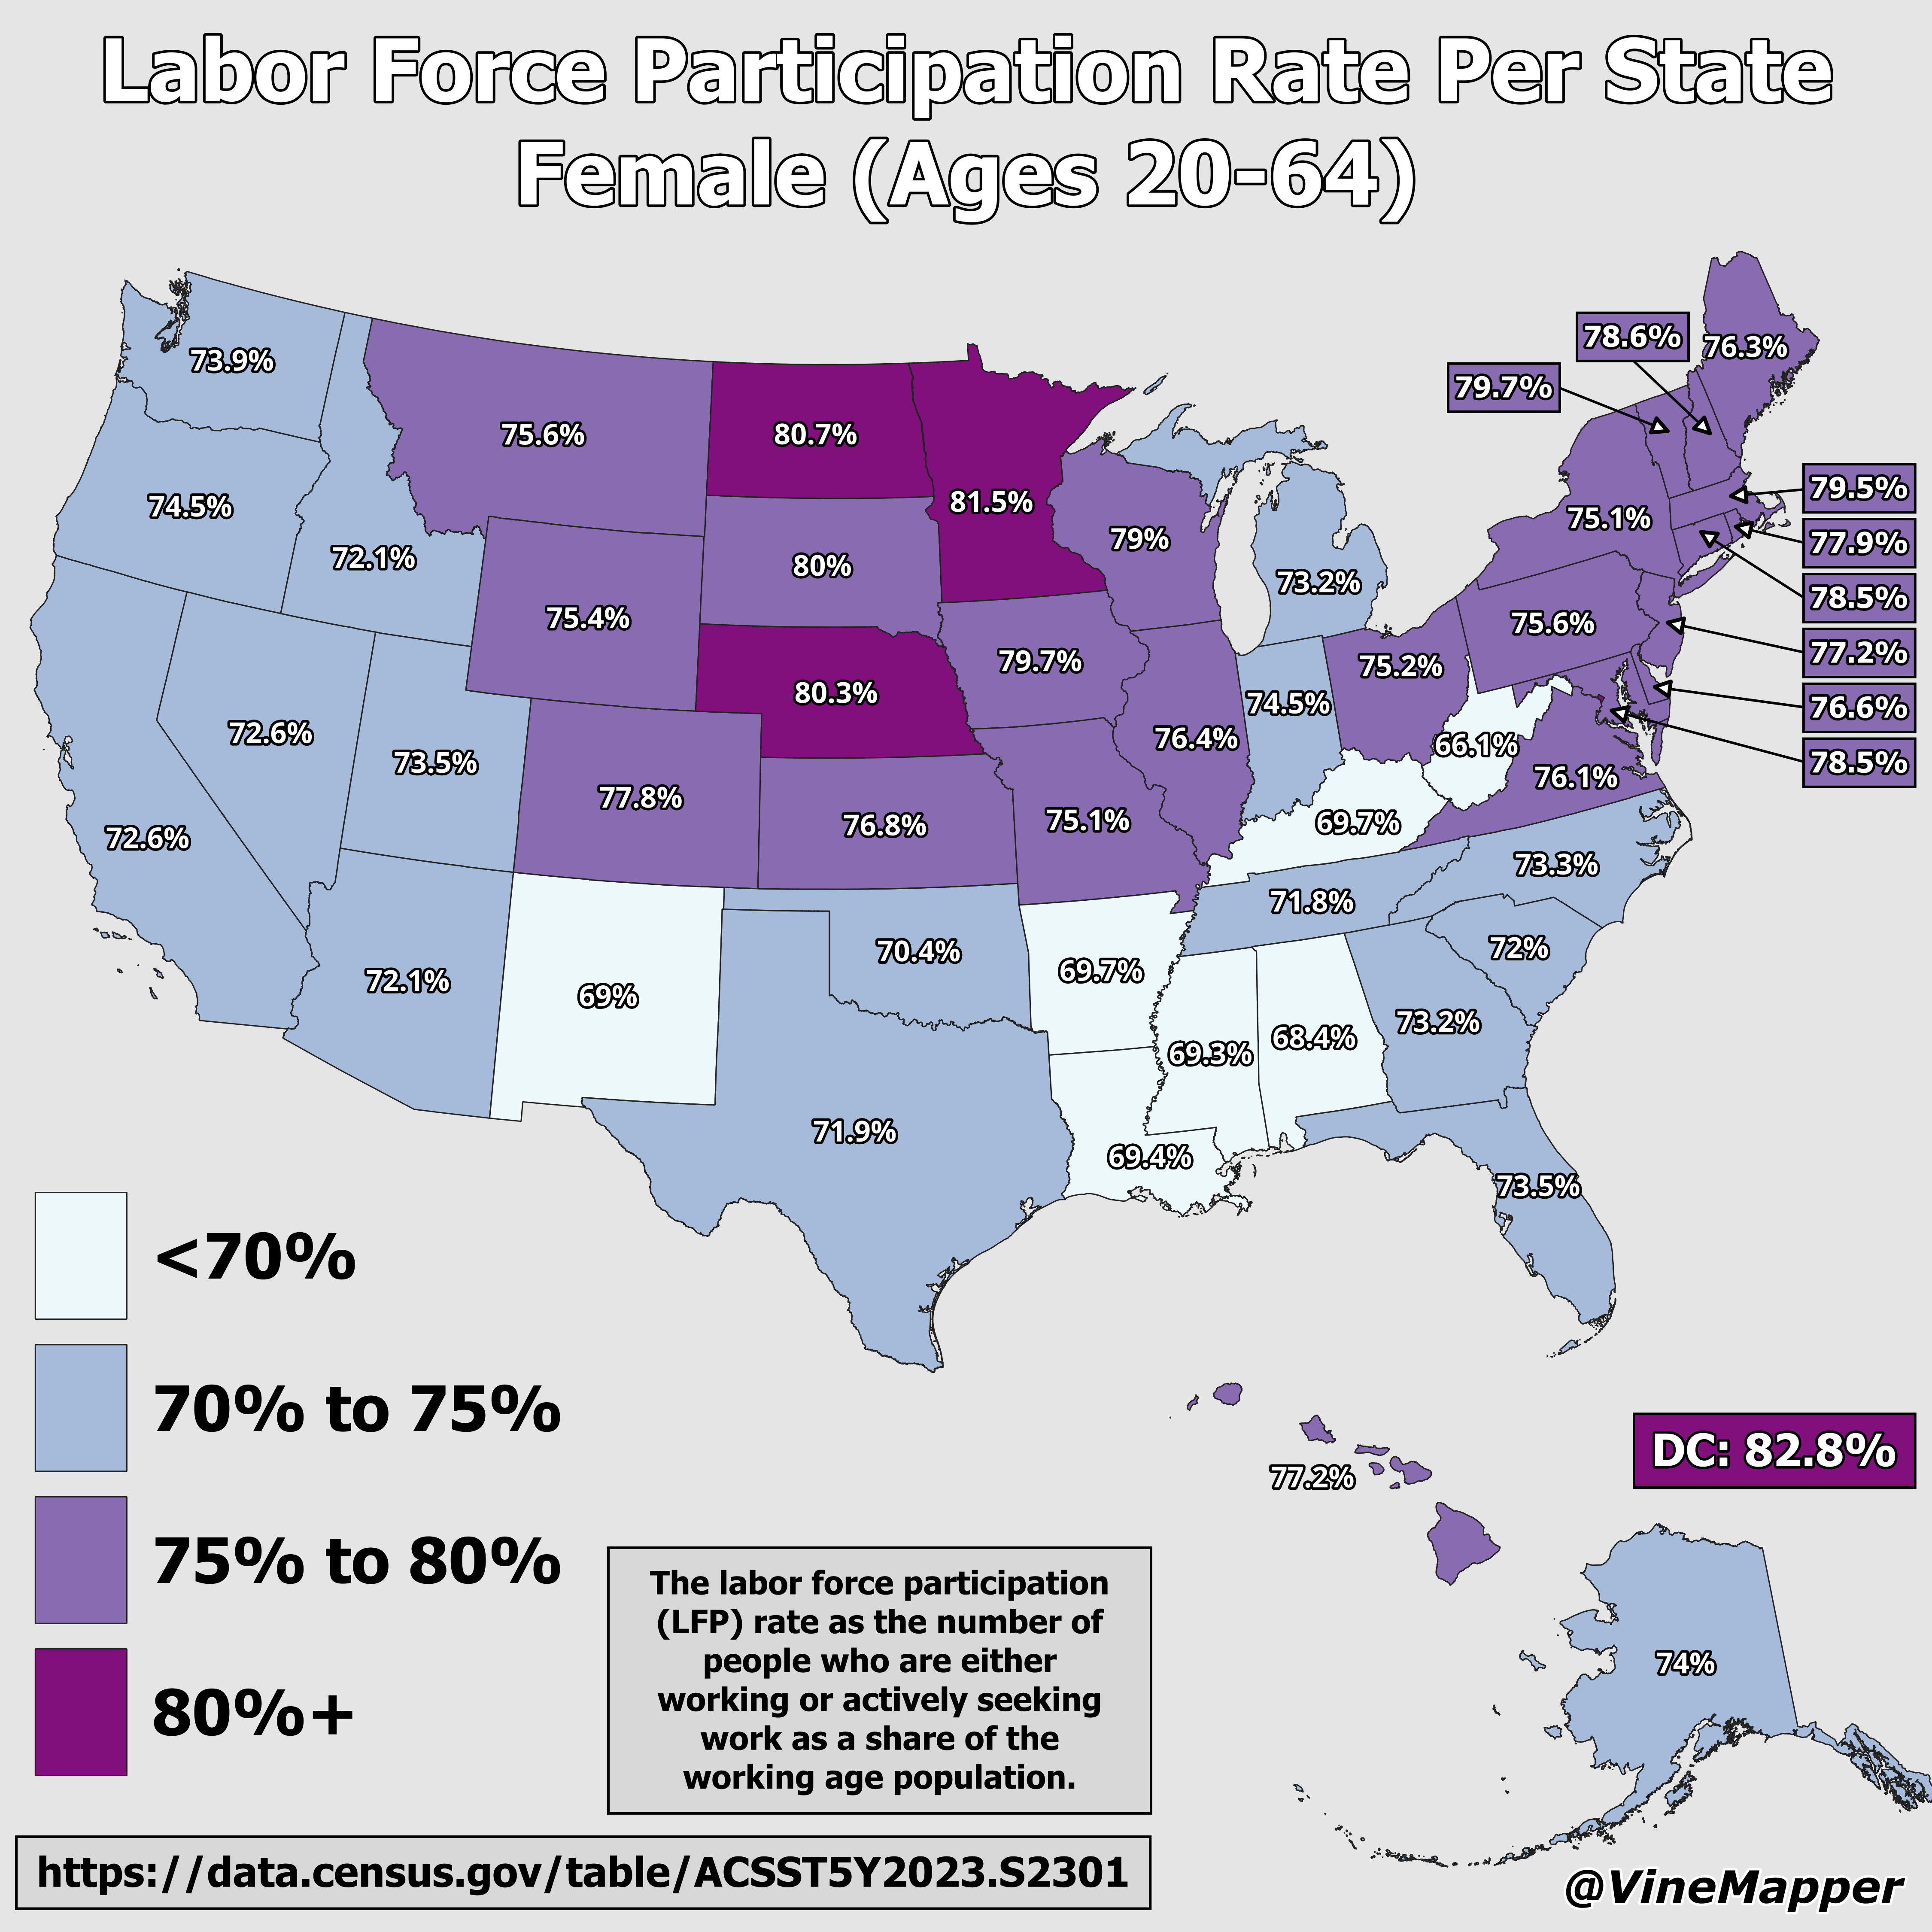
Labor Force Participation Rate Female Ages 20-64 Map
The "Labor Force Participation Rate Per State, Female (Ages 20-64) Map" presents a visual representation of the percenta...
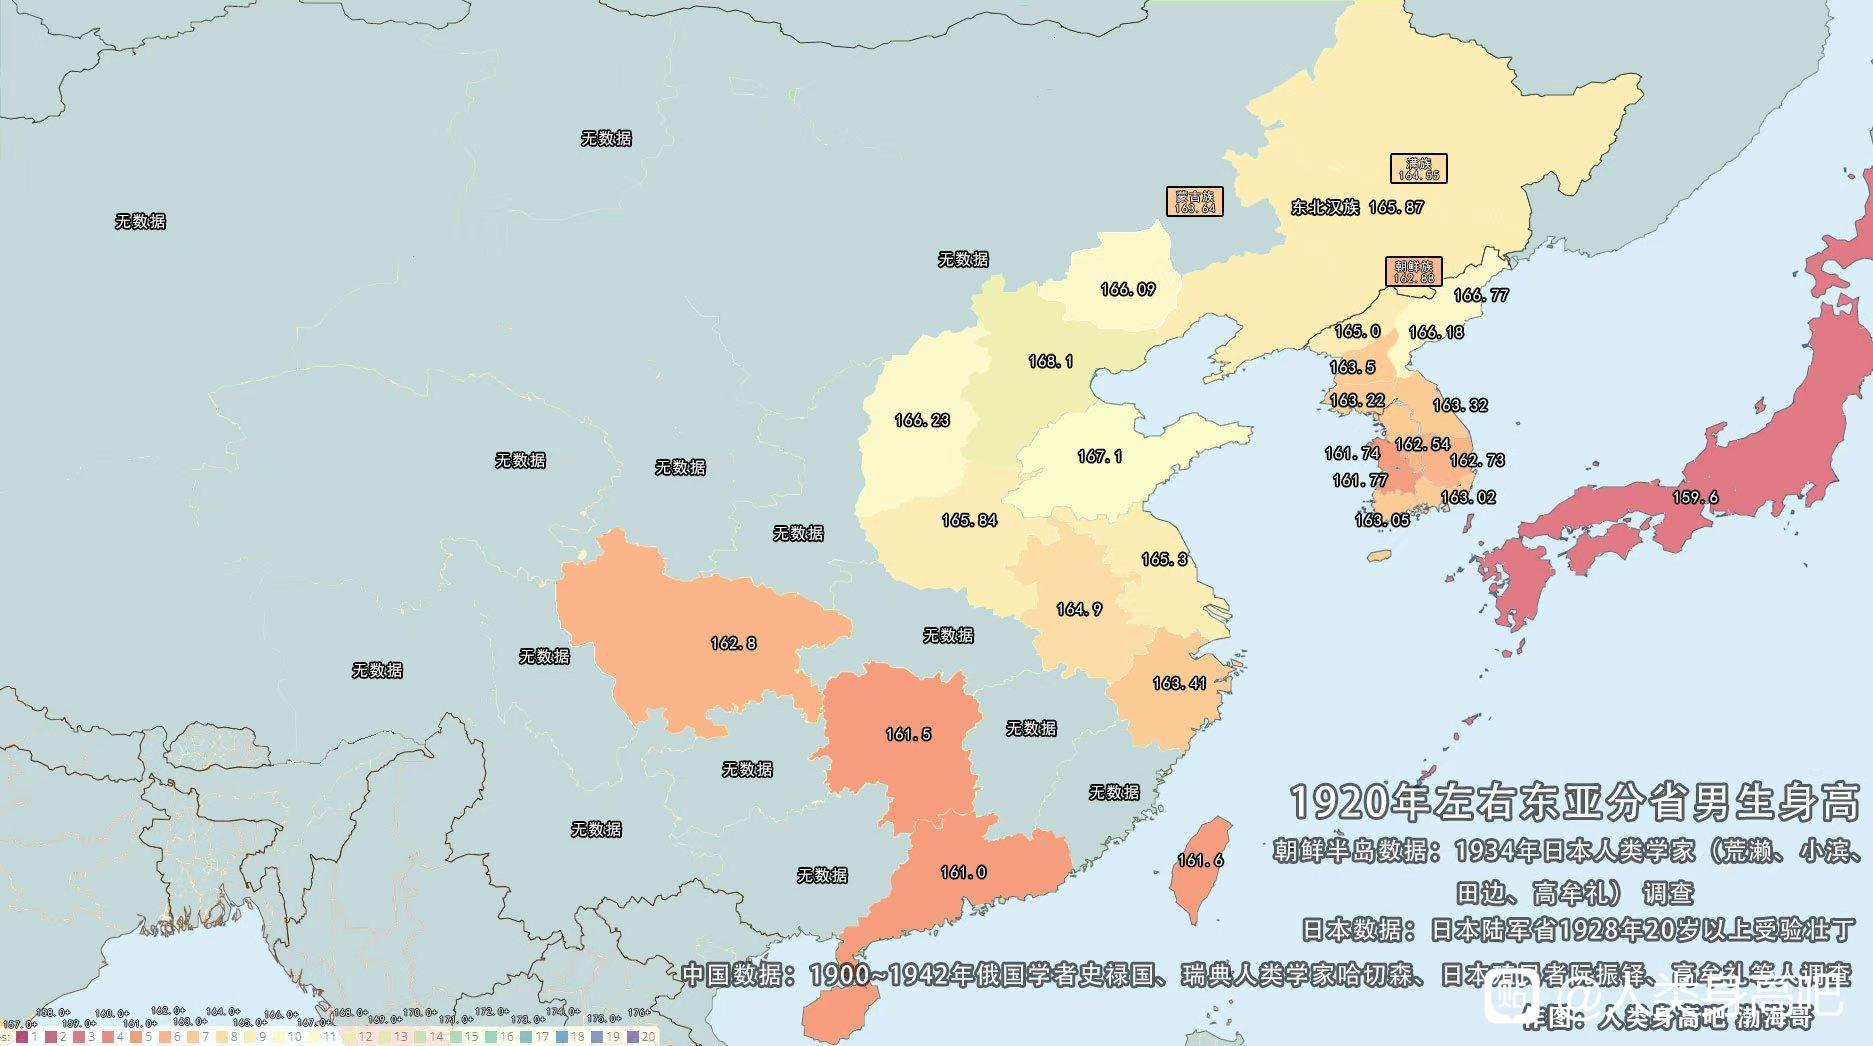
Average Height of East Asian Men in the 1920s Map
The visualization titled \...
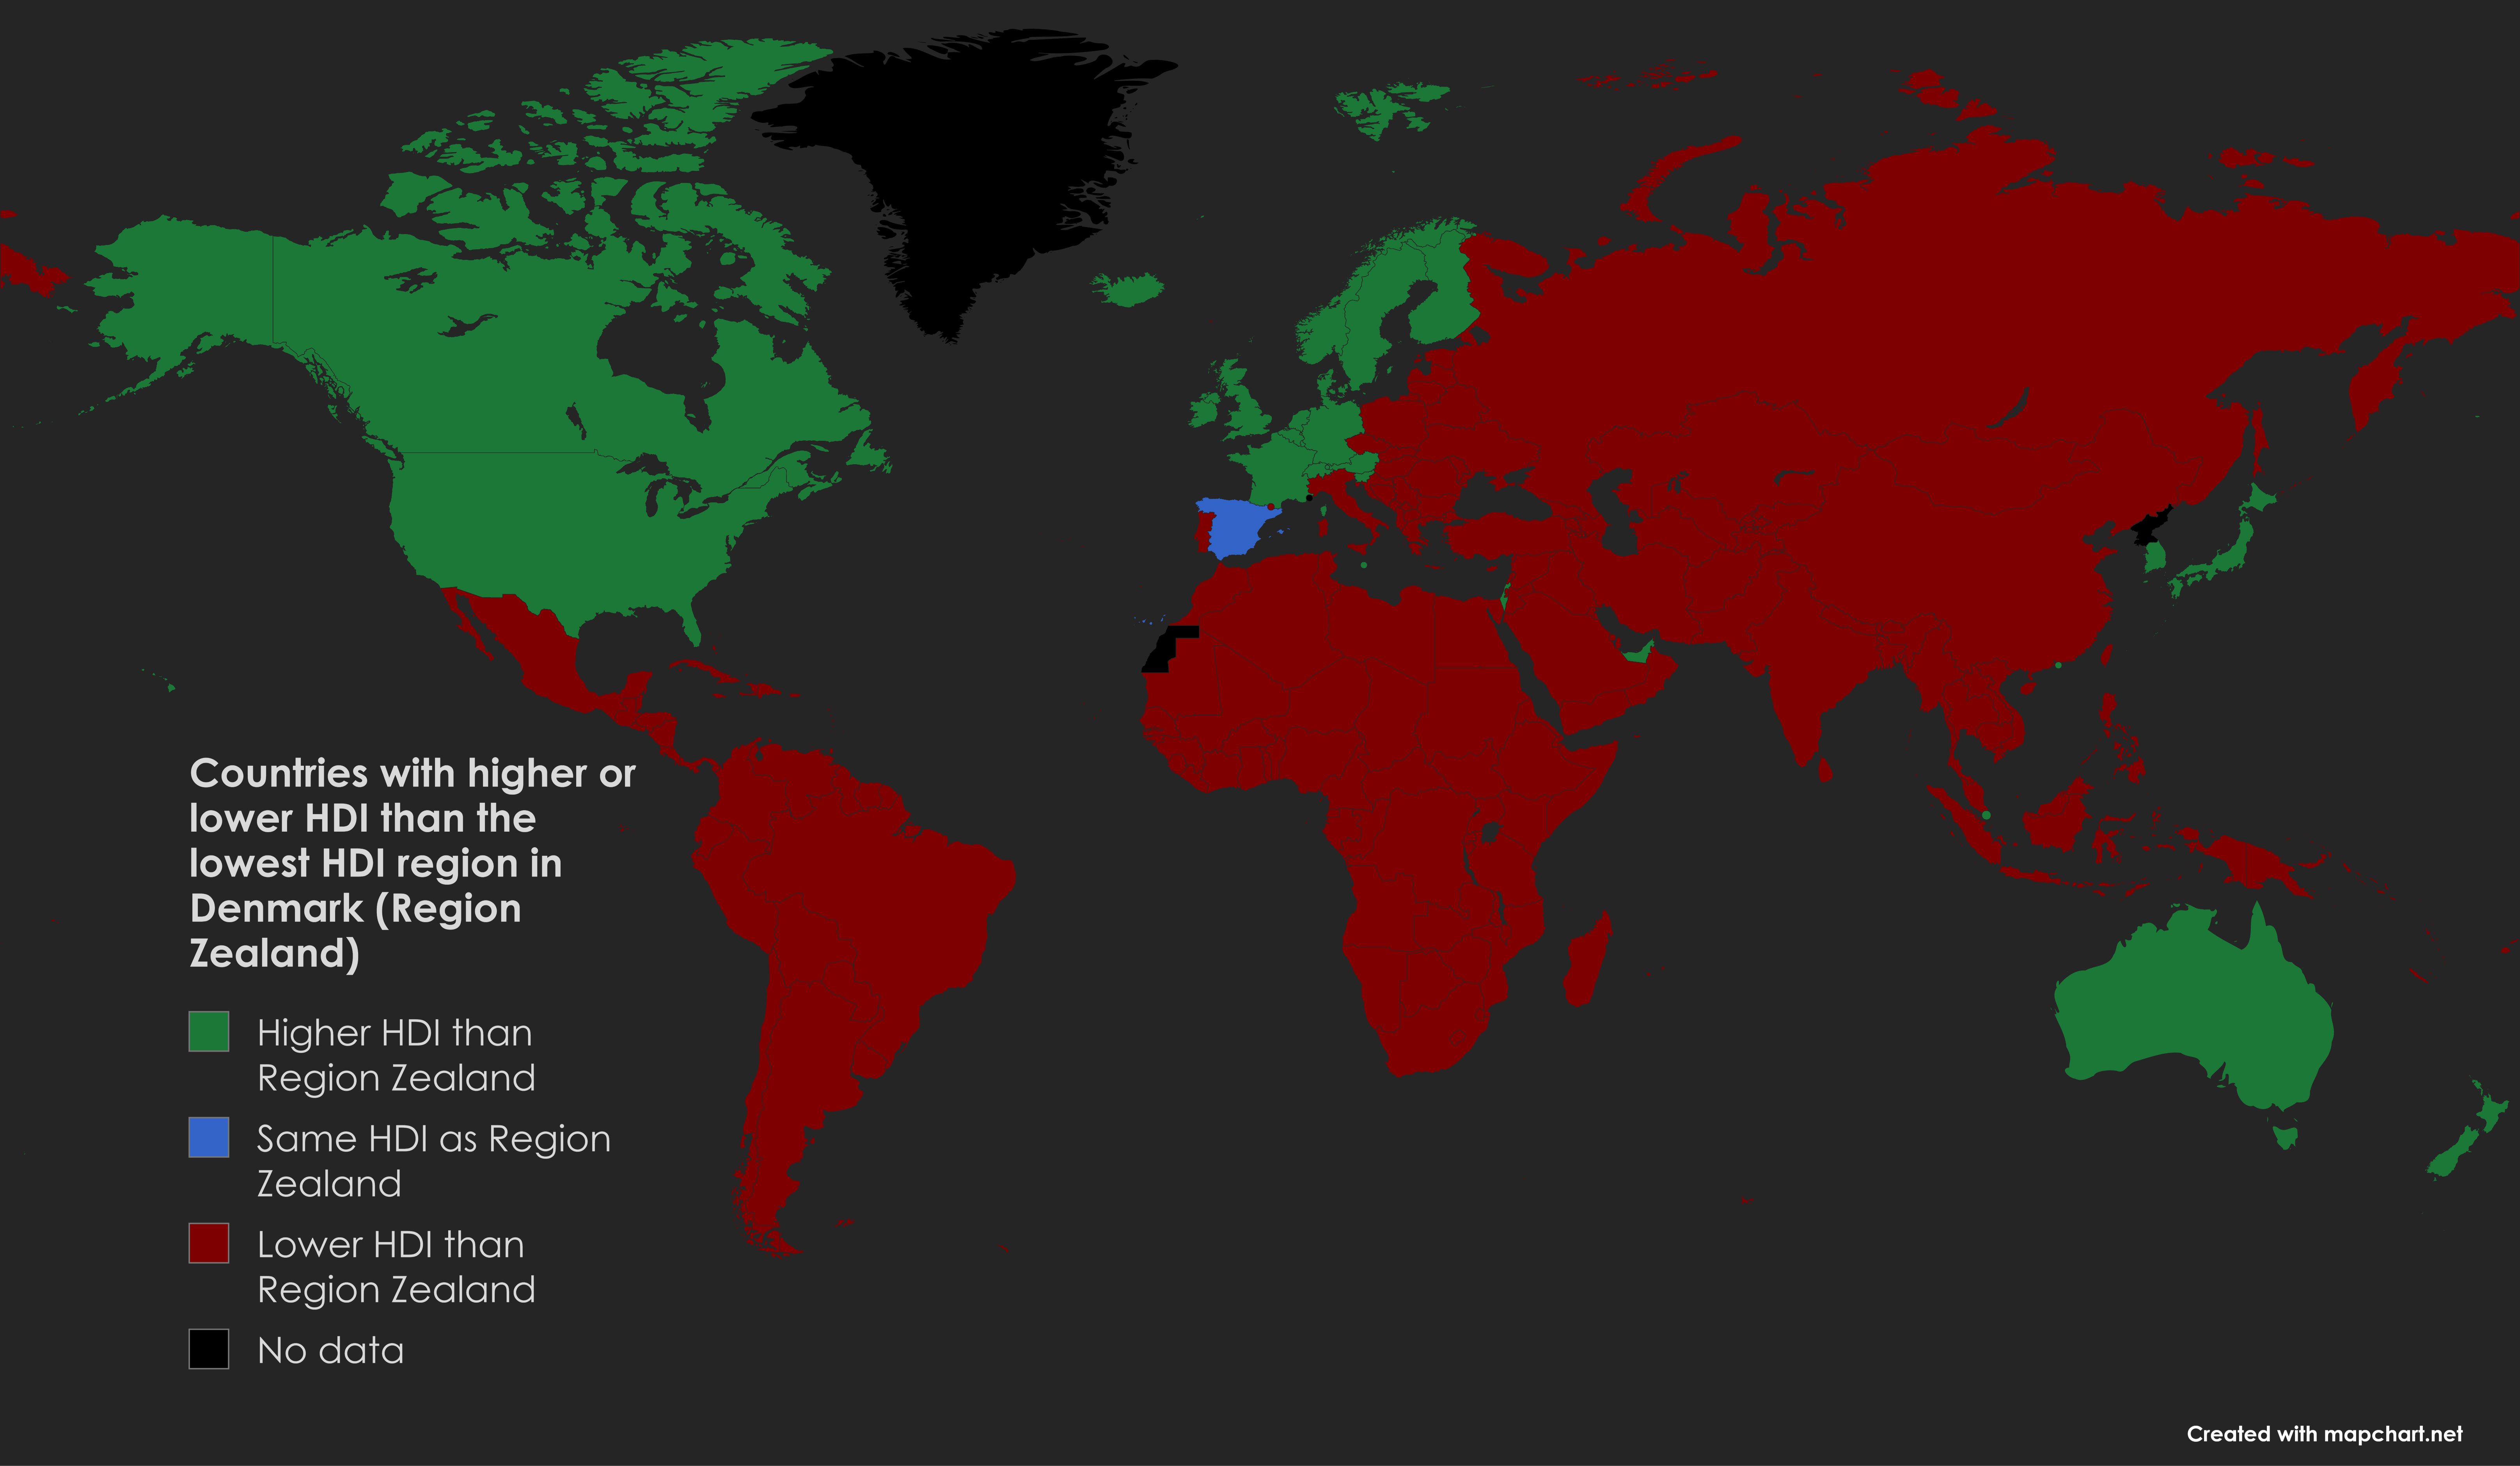
HDI Comparison Map of Zealand and Other Countries
The visualization titled "Countries with higher or lower HDI than Denmark's lowest HDI region (Region Zealand)" offers a...
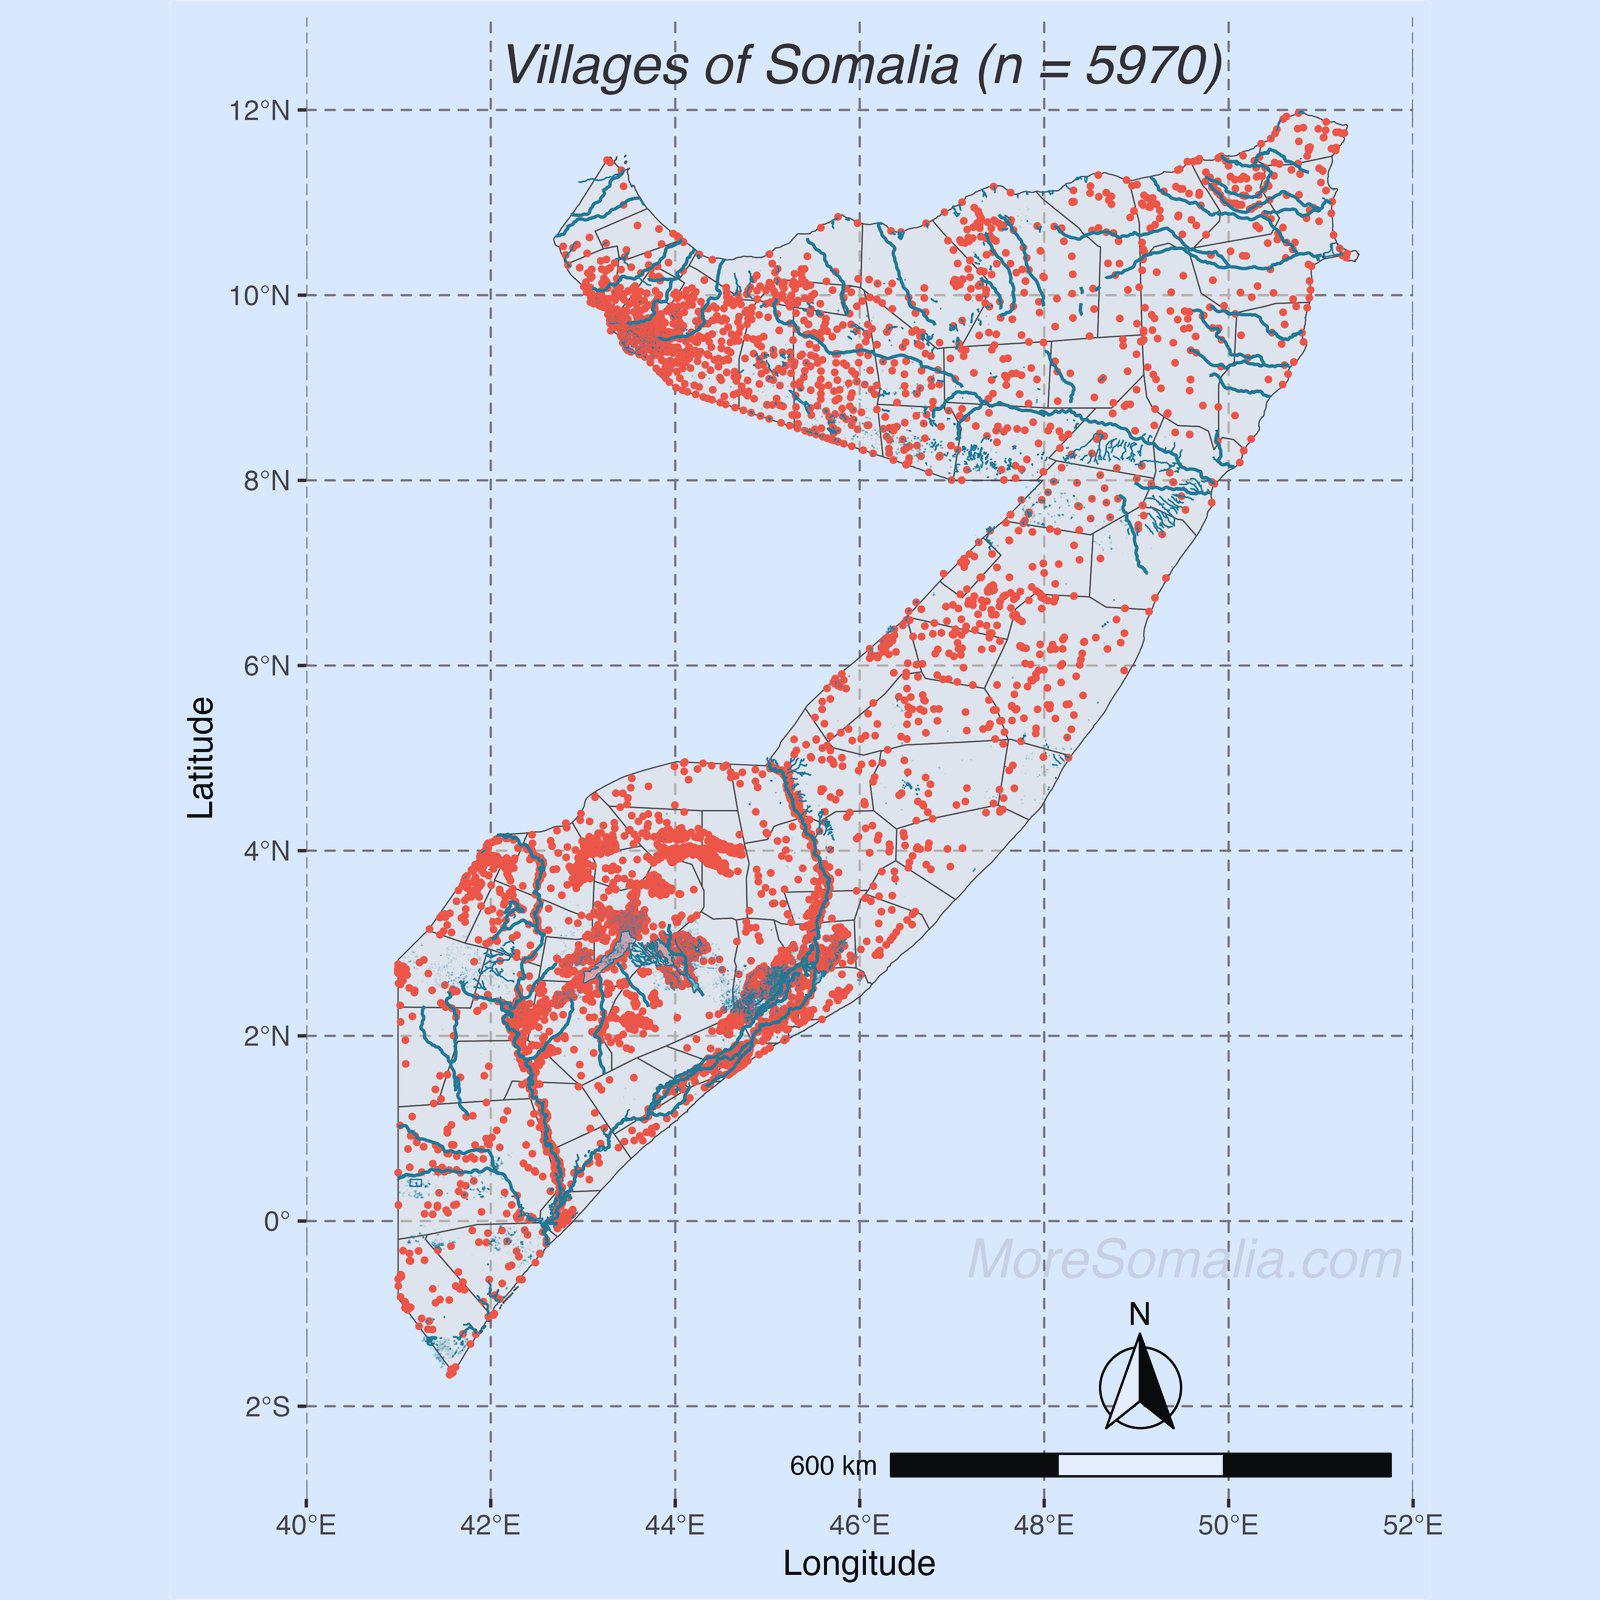
Map of Villages in Somalia
The map titled "Villages of Somalia" provides a comprehensive overview of the various villages scattered throughout this...
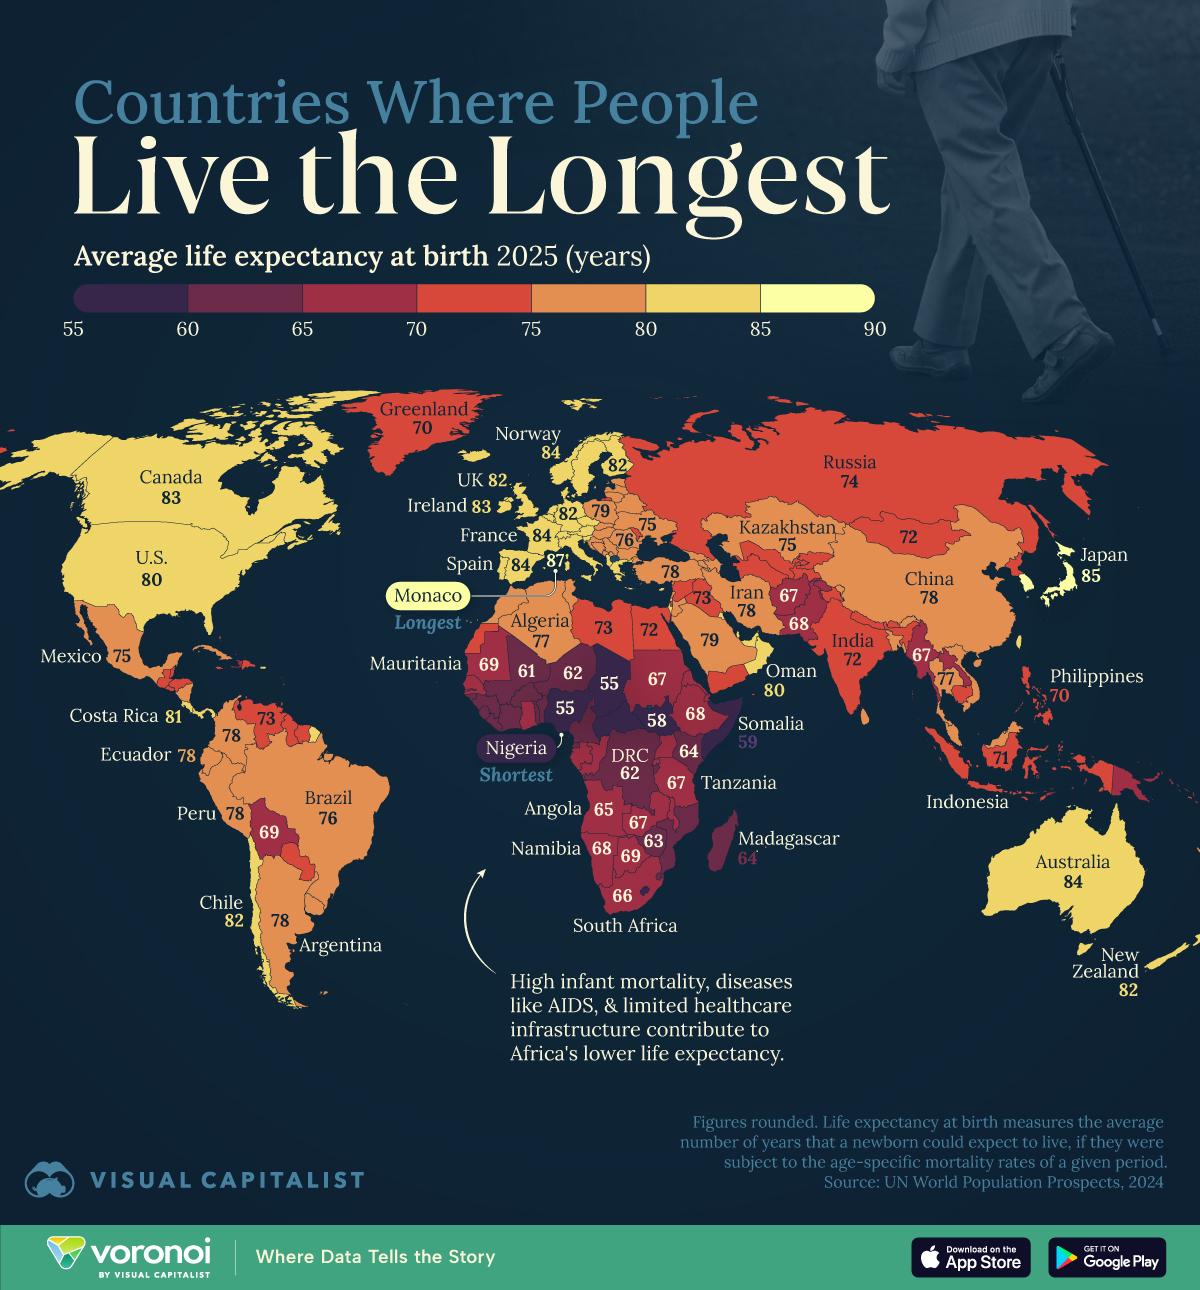
Life Expectancy by Country Map
The "Life Expectancy by Country Map" for 2025 provides a vivid snapshot of anticipated health outcomes across the globe....
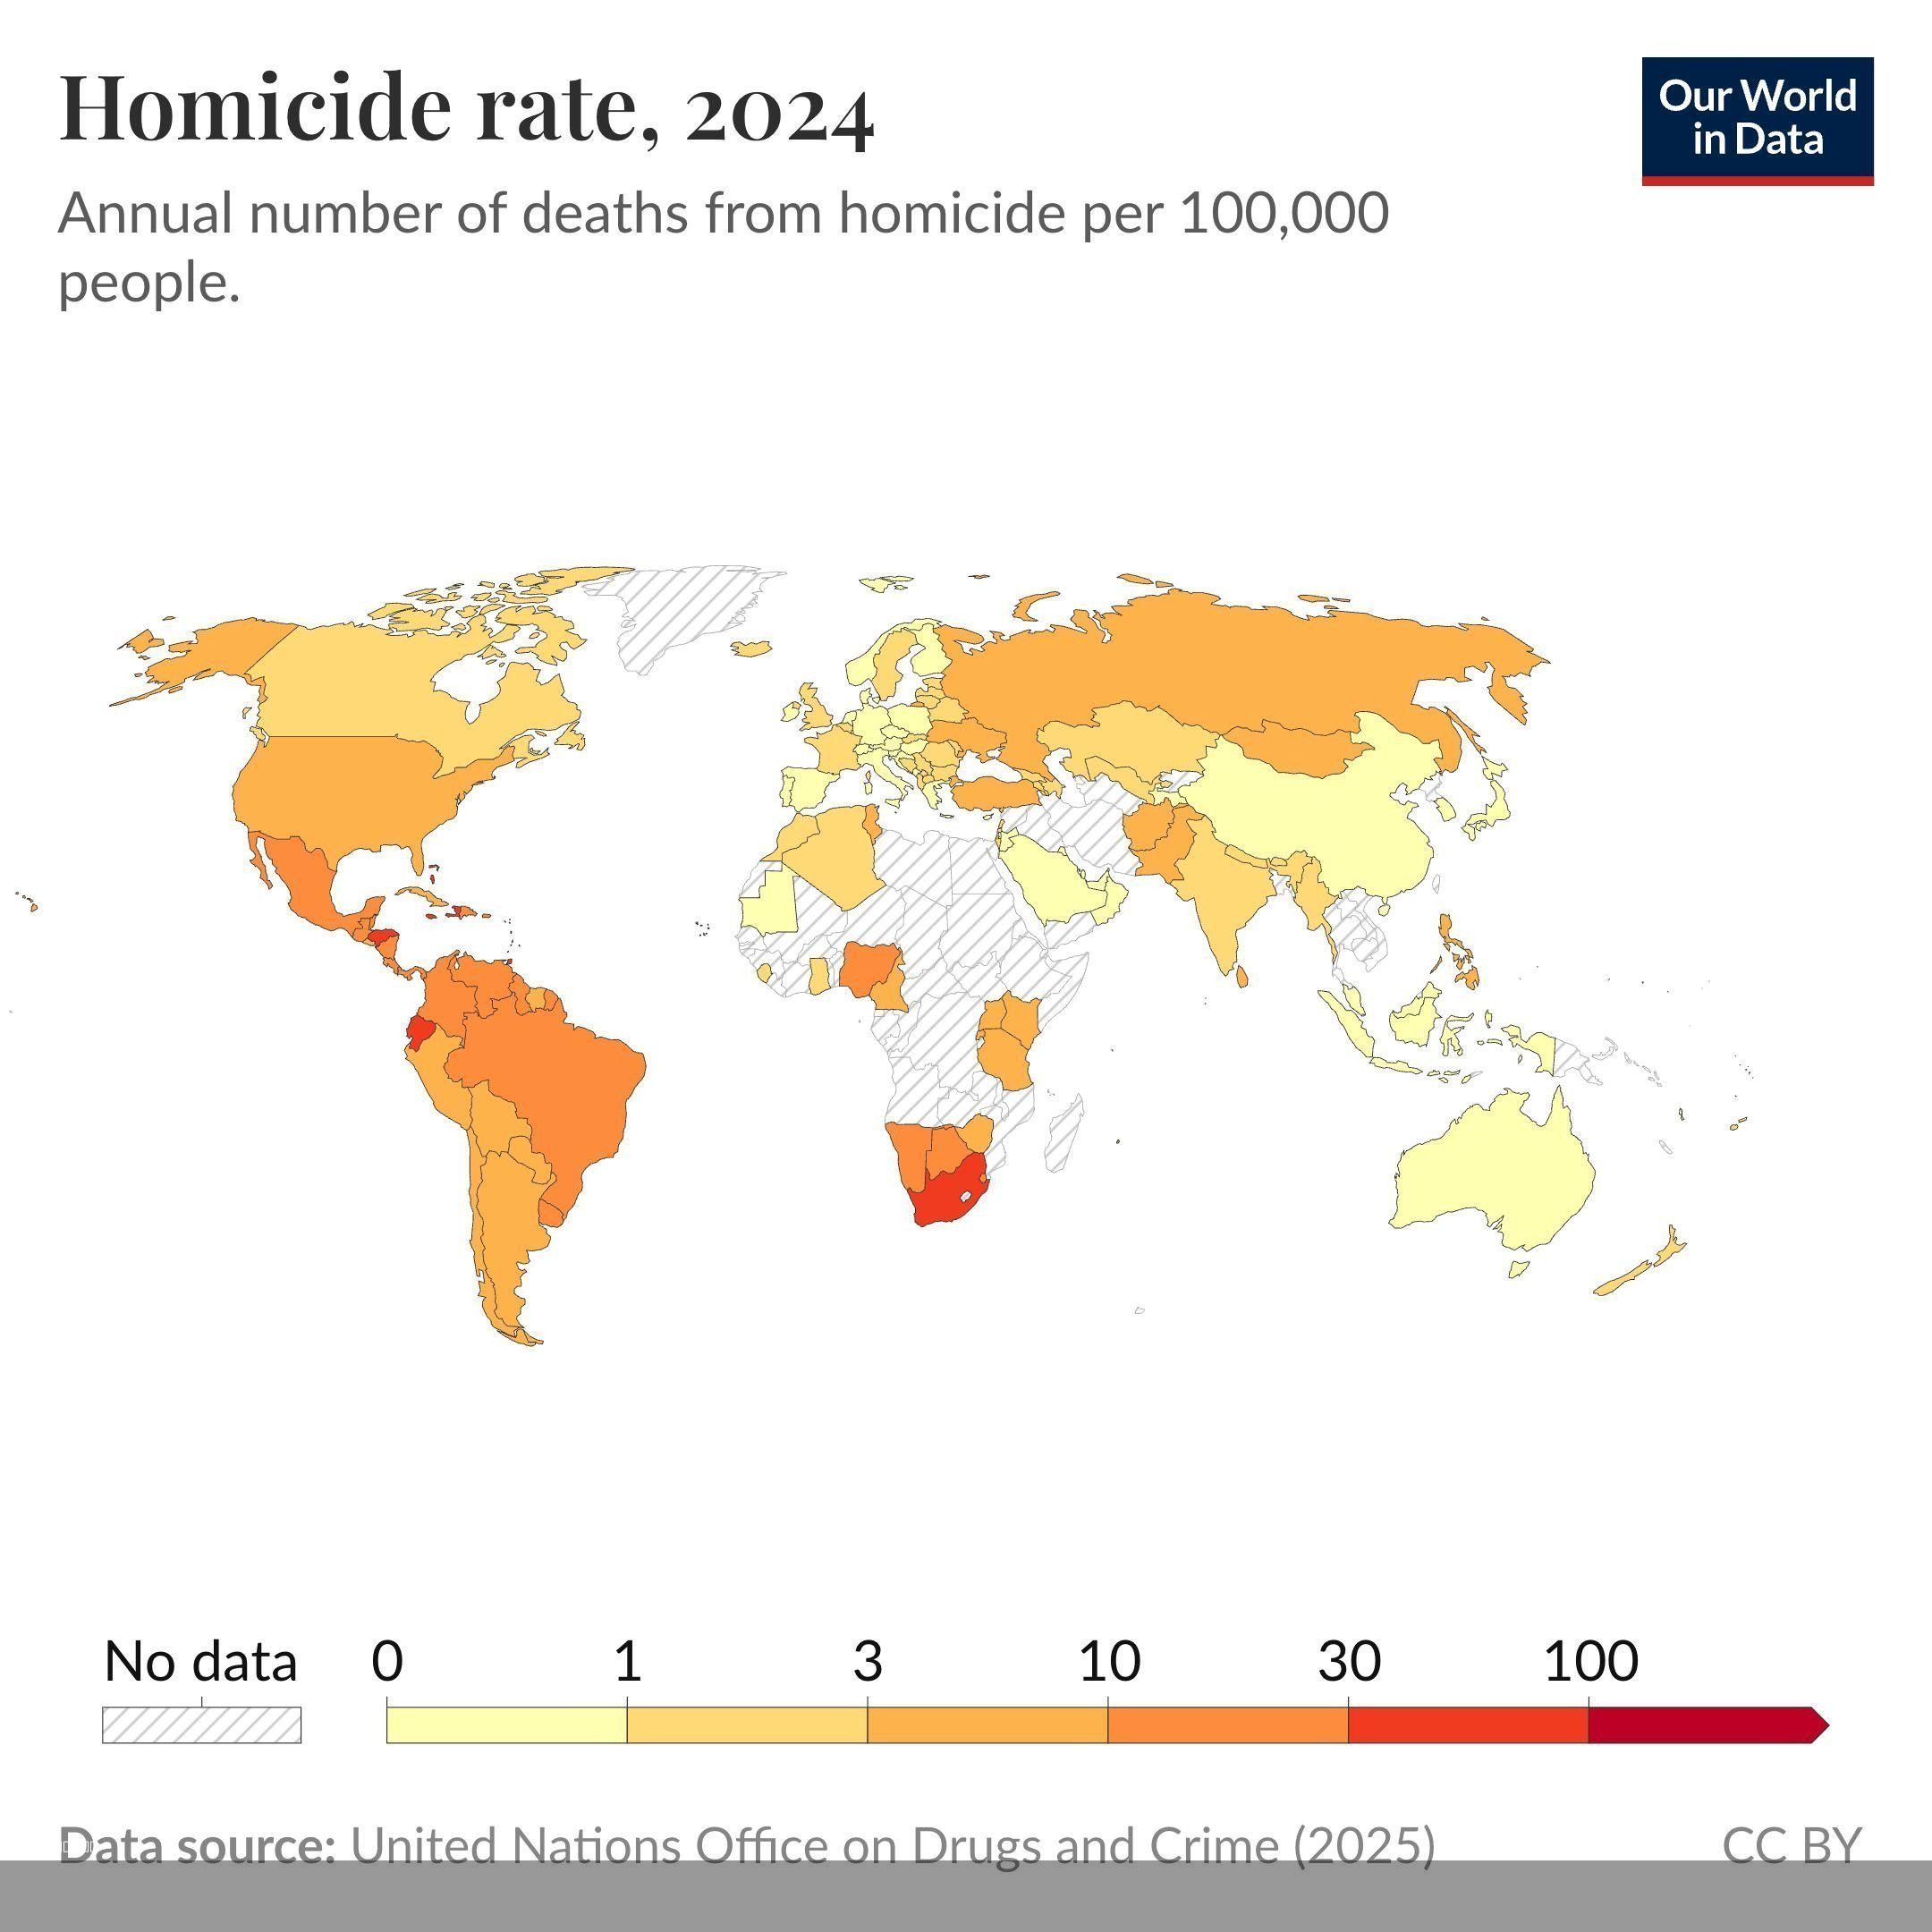
Homicide Rate Map by Country
The \...

Vietnam's Greatest Extent Map
...
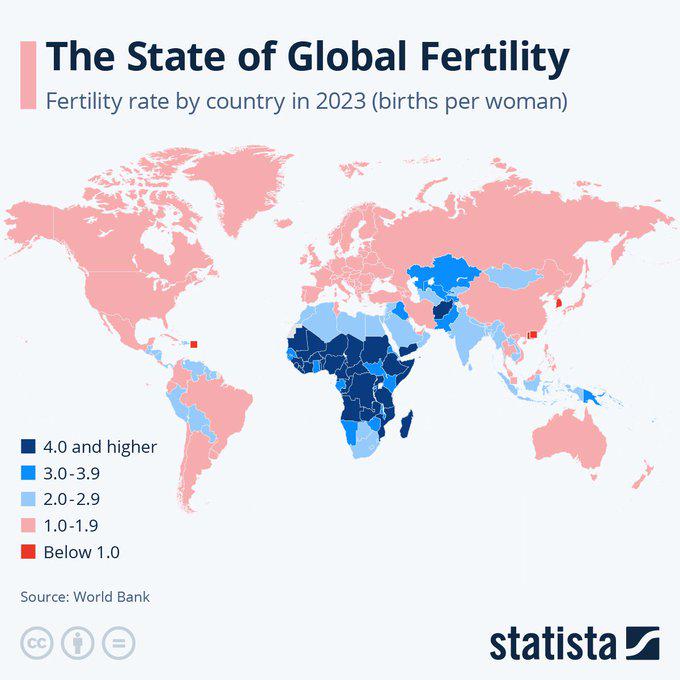
Global Fertility Rate Map
The "Global Fertility Rate Map" provides a visual representation of birth rates across various countries, illustrating t...