natural disasters Maps
12 geographic visualizations tagged with "natural disasters"
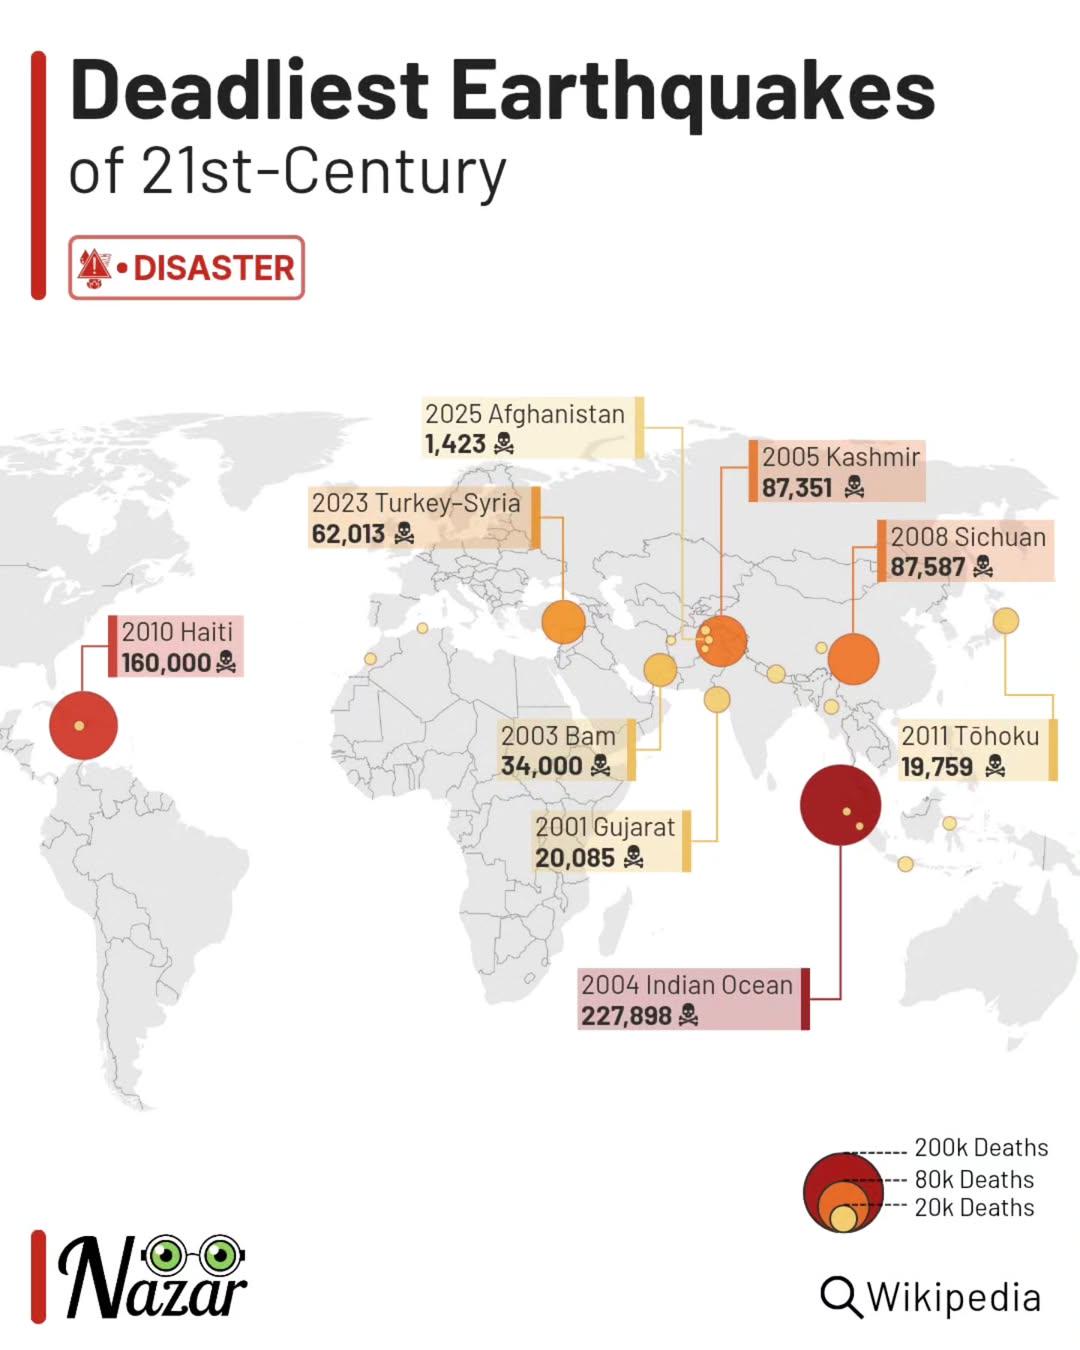
Deadliest Earthquakes of the 21st Century Map
The "Deadliest Earthquakes of the 21st Century" map offers a stark visual representation of the most catastrophic seismi...
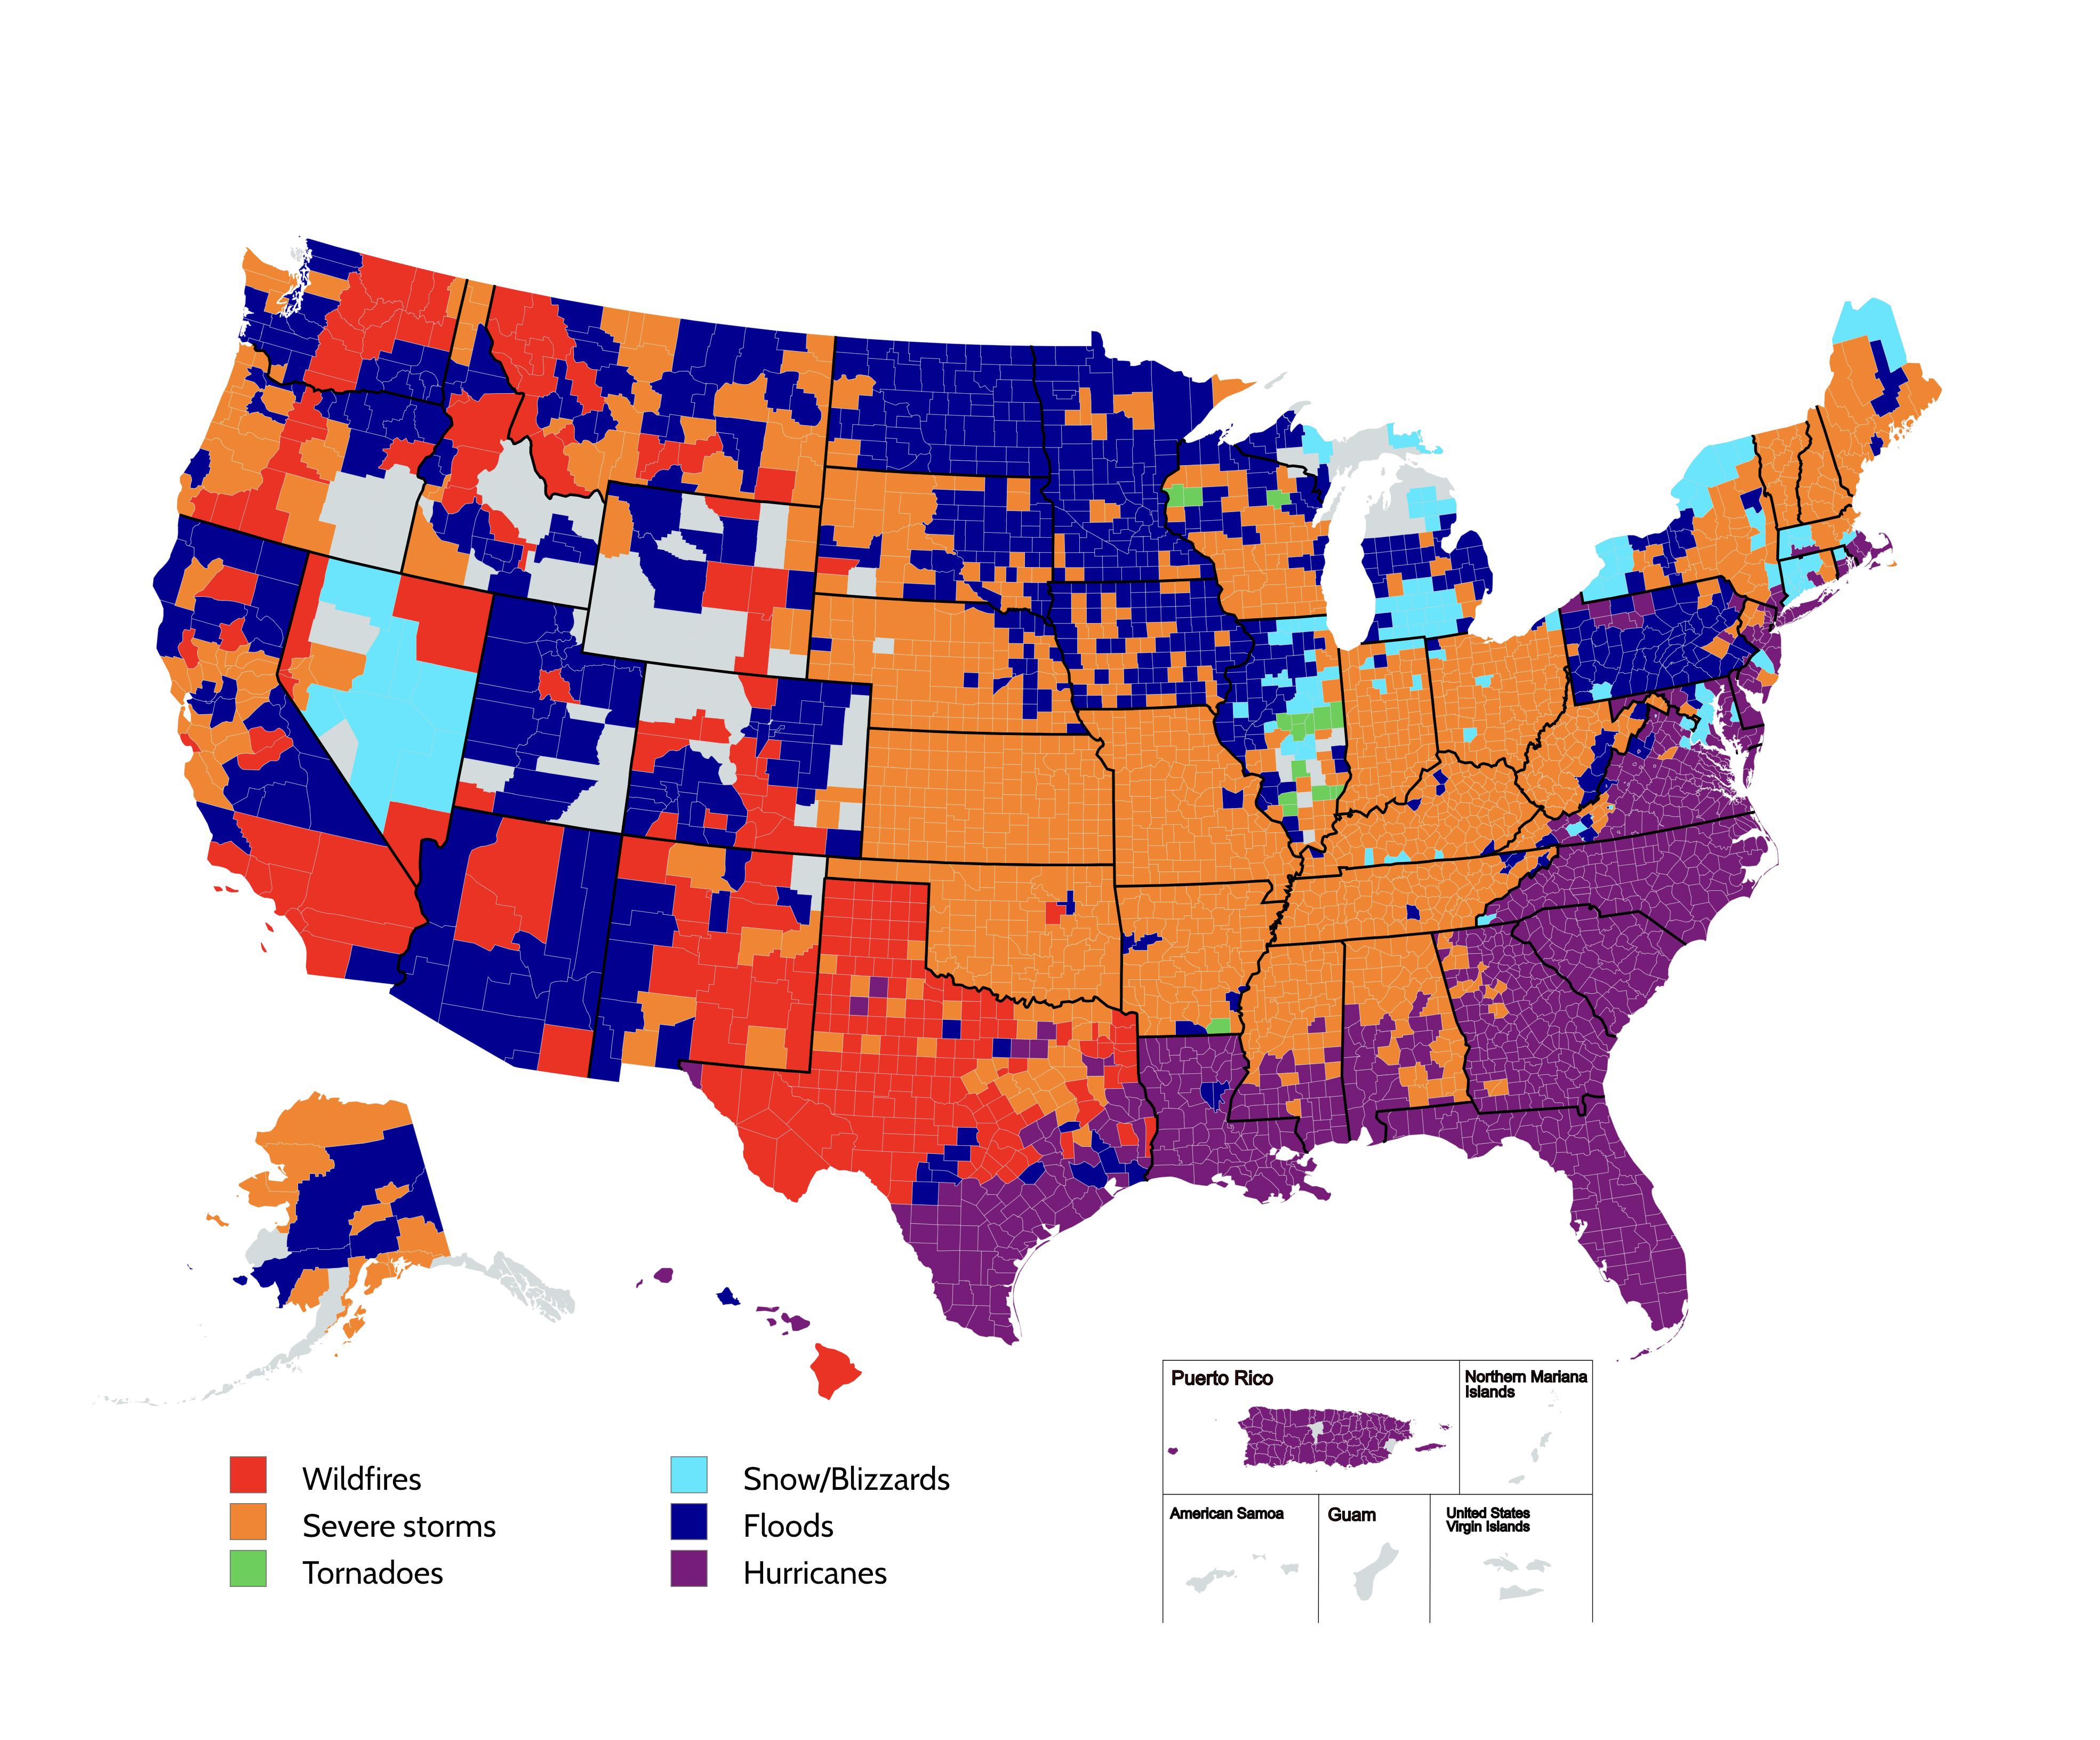
Map of Most Frequently Occurring Natural Disasters by US County
The visualization titled "Most Frequently Occurring Natural Disasters by US County" presents a striking overview of the ...
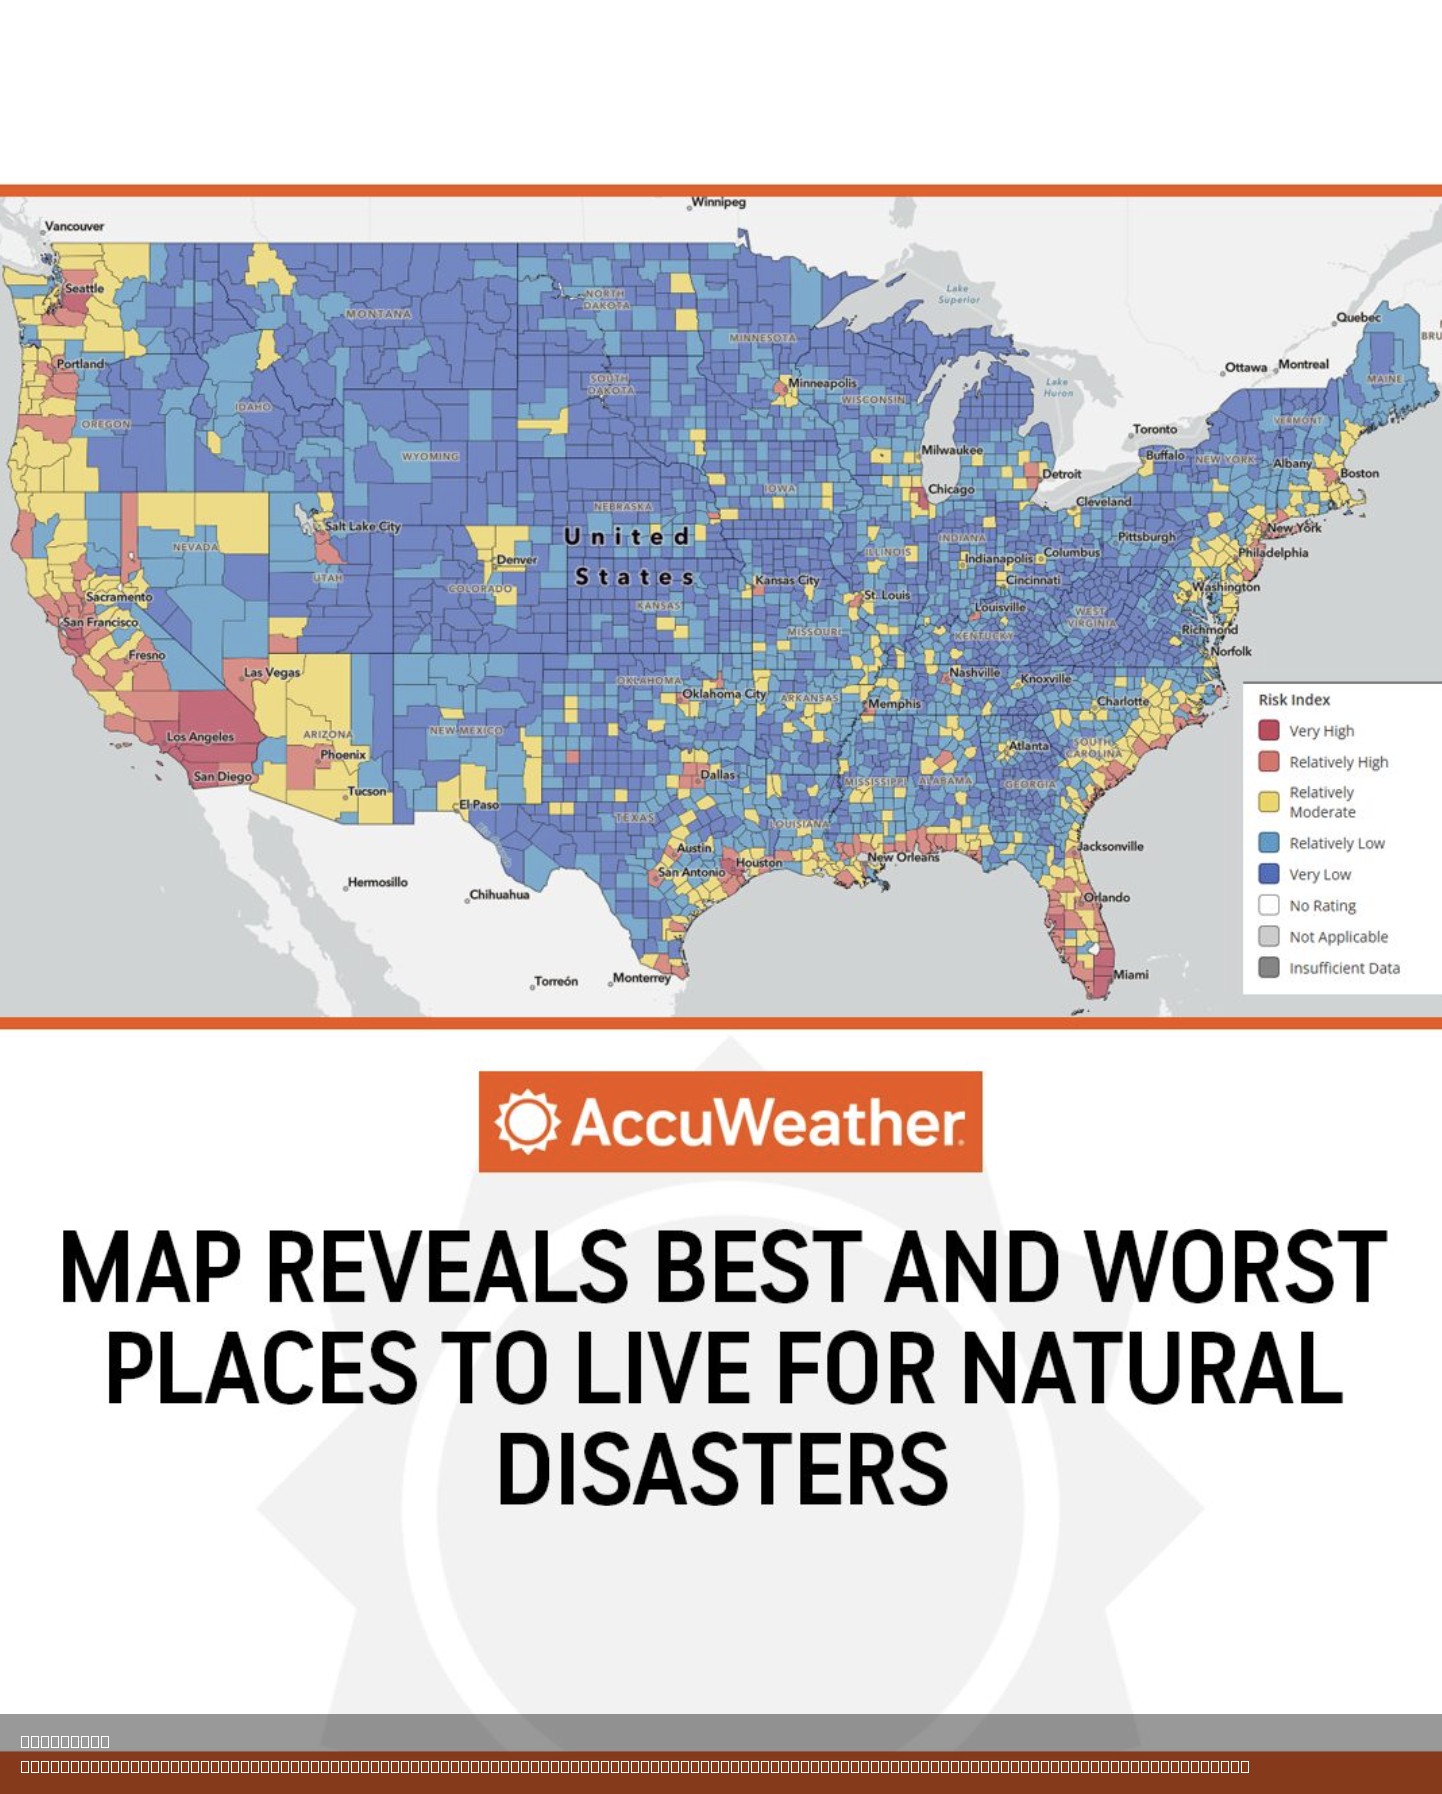
FEMA Risk Map of Natural Disaster Vulnerability
Understanding the interplay between natural hazards and community vulnerability is critical for both individuals and pol...
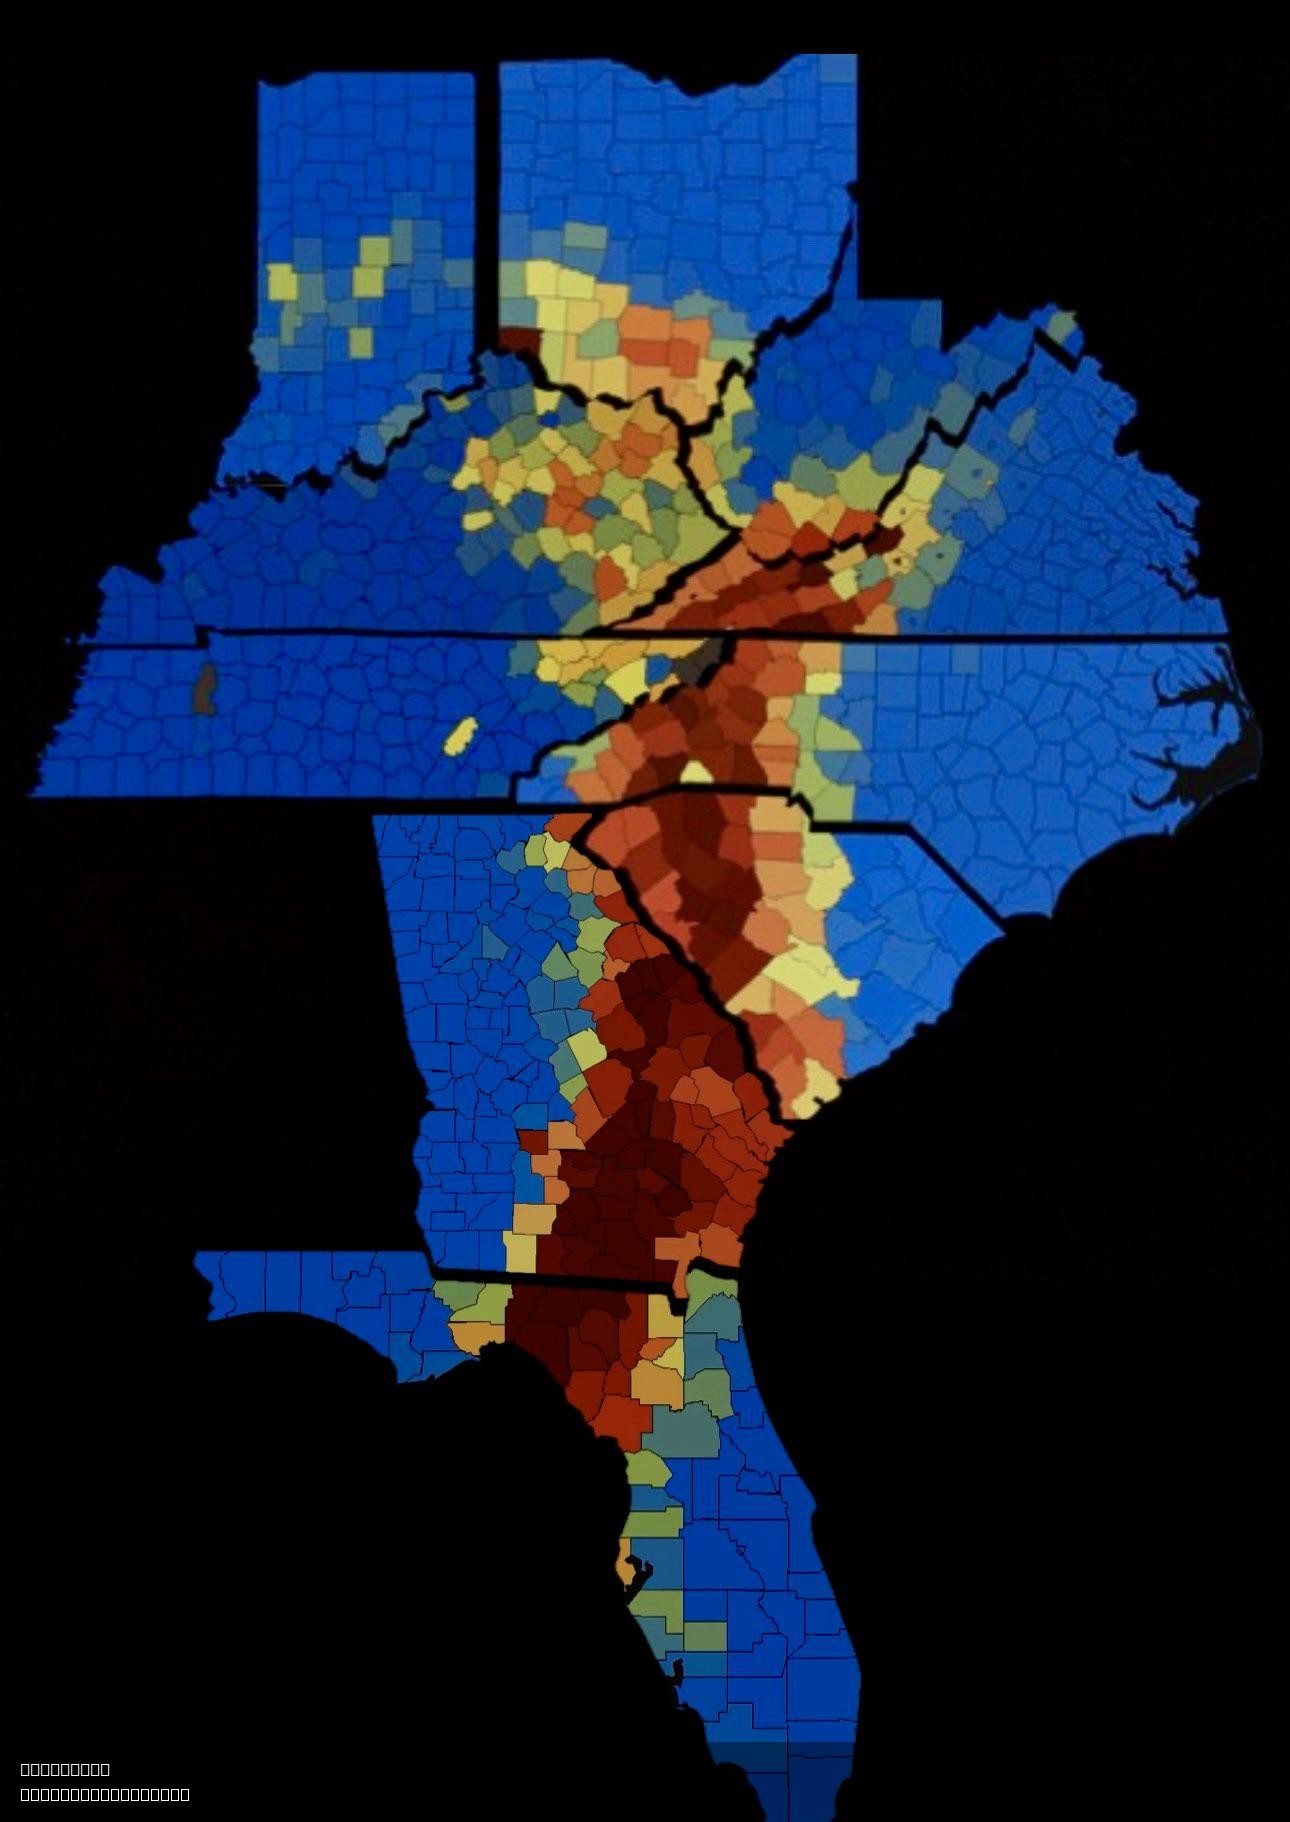
Hurricane Helene Power Outage Map
The "Hurricane Helene Power Outage Map" provides a visual representation of the widespread power outages experienced dur...
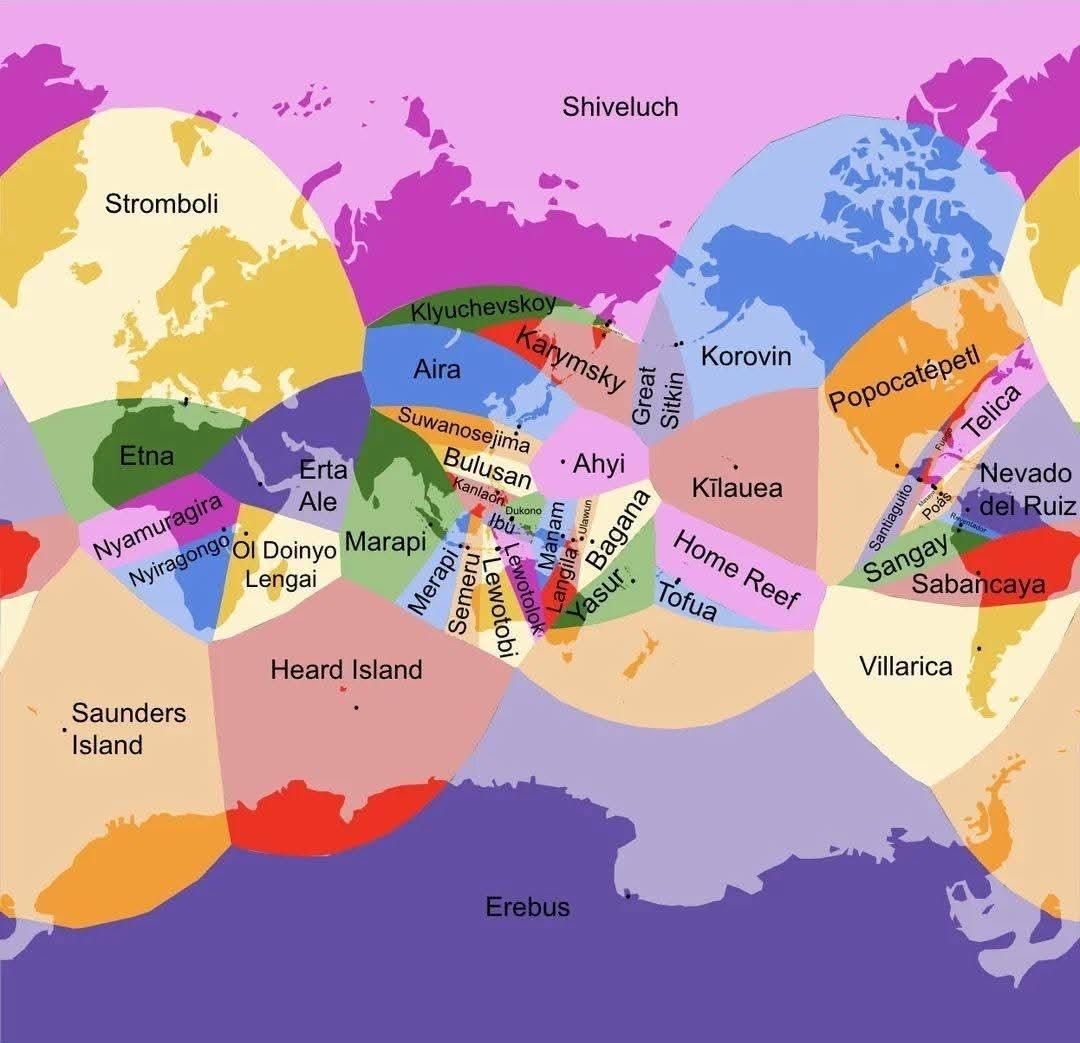
Currently Erupting Volcano Map Near You
What's particularly interesting is that volcanic eruptions vary significantly in size and impact. Some eruptions can be ...
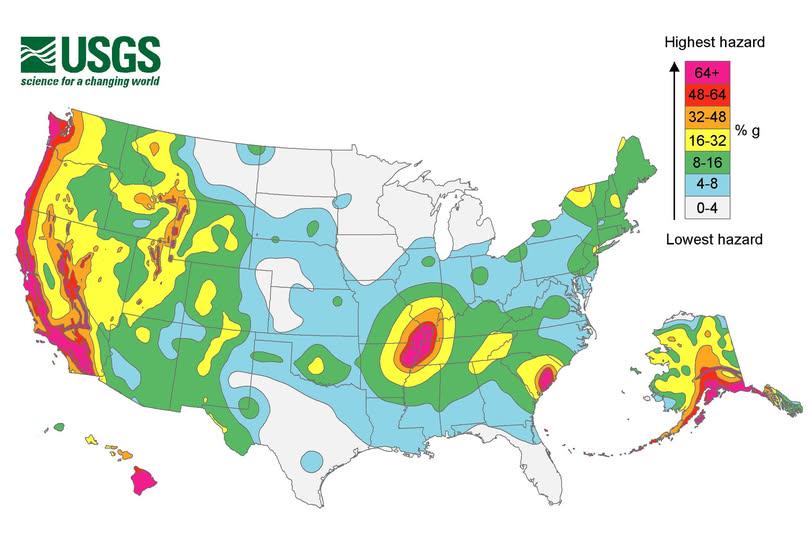
Earthquake Hazard Levels Map of the United States
The "Earthquake Hazard Levels Map of the United States" illustrates the varying levels of seismic risk across the countr...
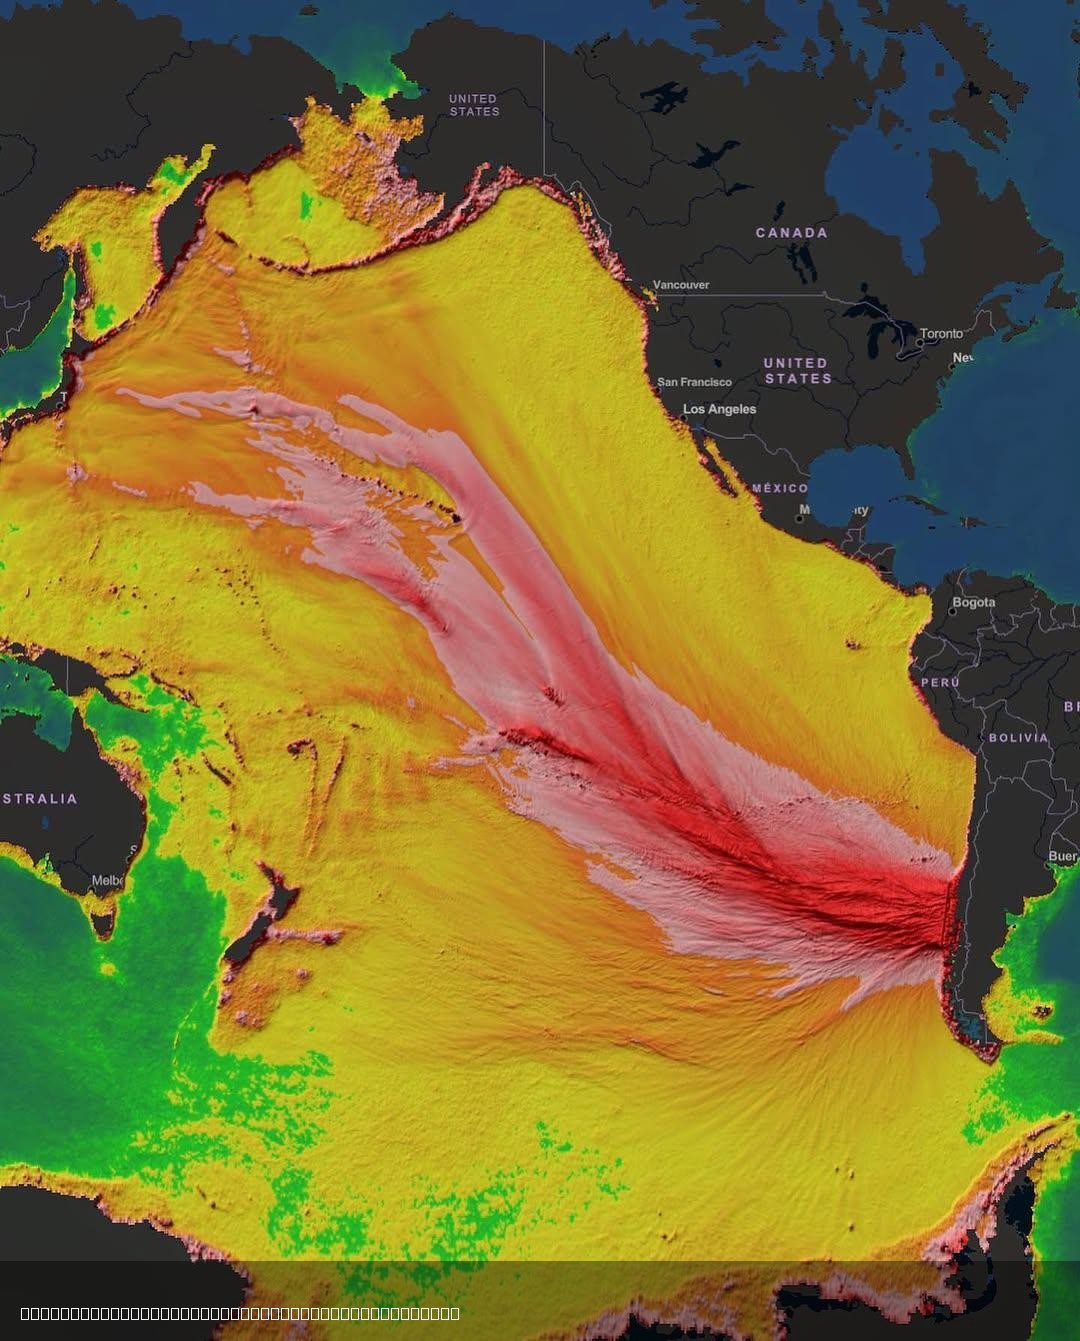
1960's M9.5 Tsunami Sea-Level Rise Map
The visualization titled 'Historic Energy Model of 1960's M9.5 Tsunami' from NOAA's Pacific Tsunami Warning Center illus...
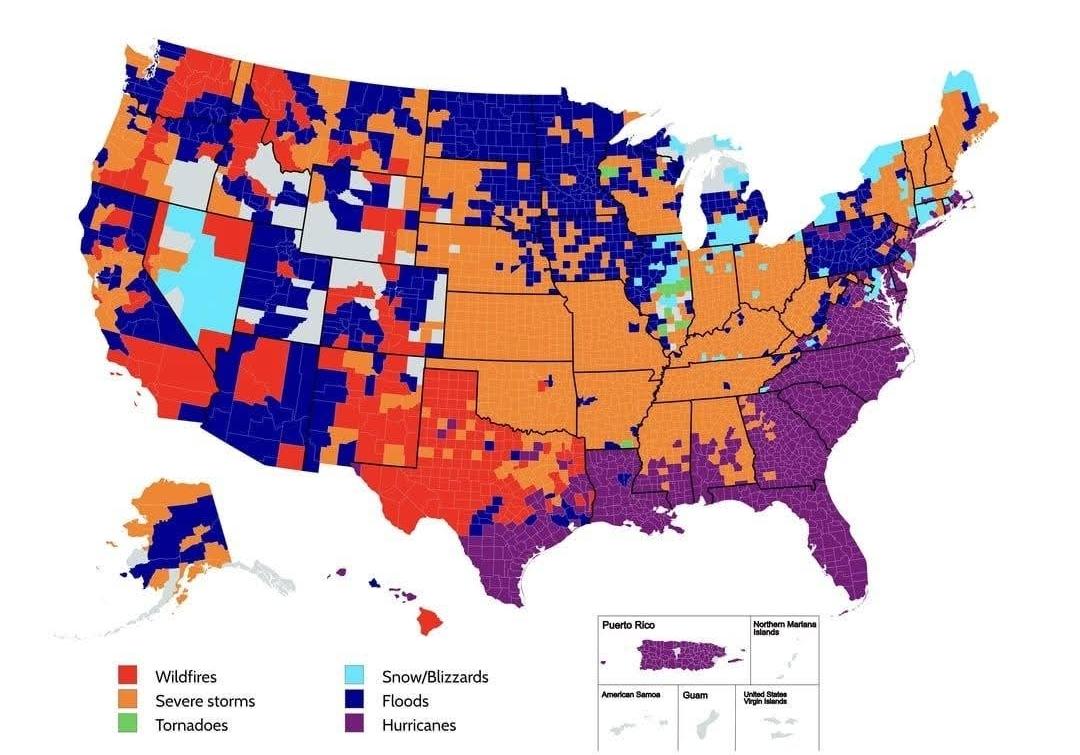
Most Frequent Natural Disasters by County Map
The "Most Frequent Natural Disasters by County Map" presents a detailed breakdown of the types of natural disasters that...
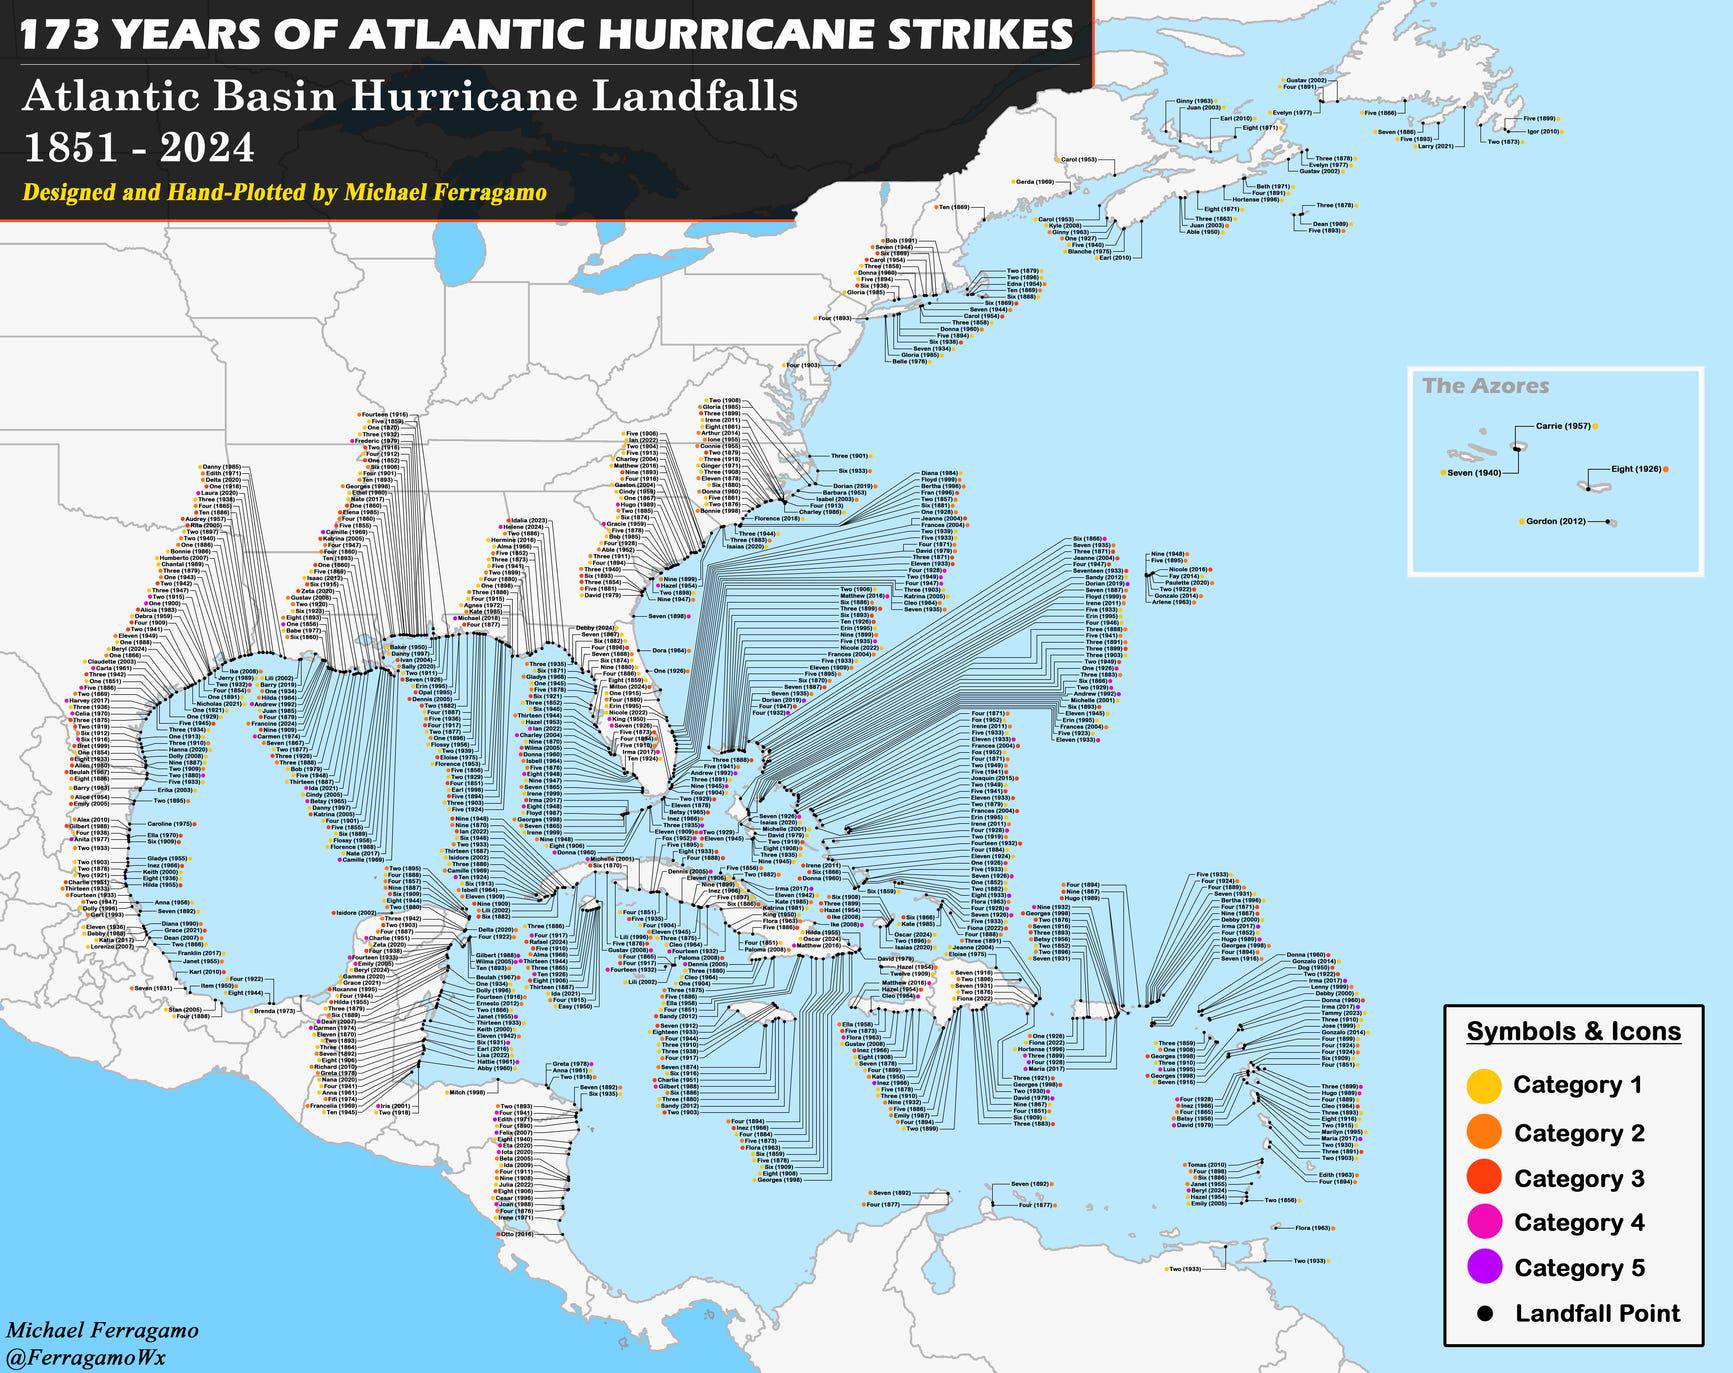
Landfall Locations of Category 1+ Atlantic Tropical Cyclones Map
This map illustrates the landfall locations of all known Category 1 and higher Atlantic tropical cyclones since 1851. By...
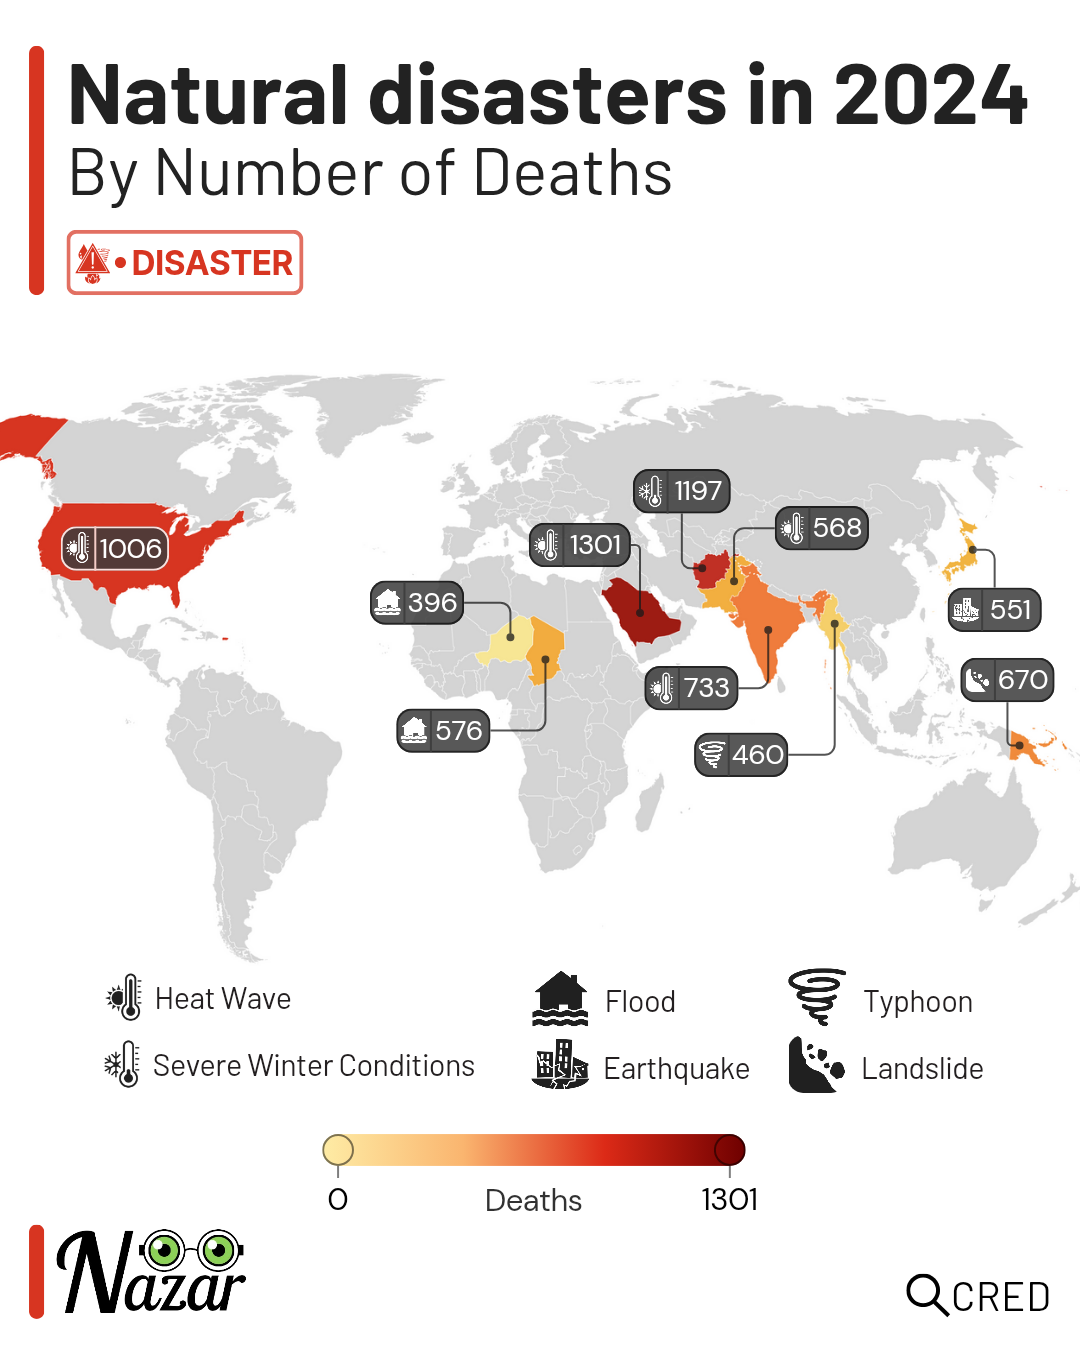
Natural Disasters in 2024 Map
The "Natural Disasters in 2024 Map" provides a stark visualization of the human toll inflicted by various natural disast...
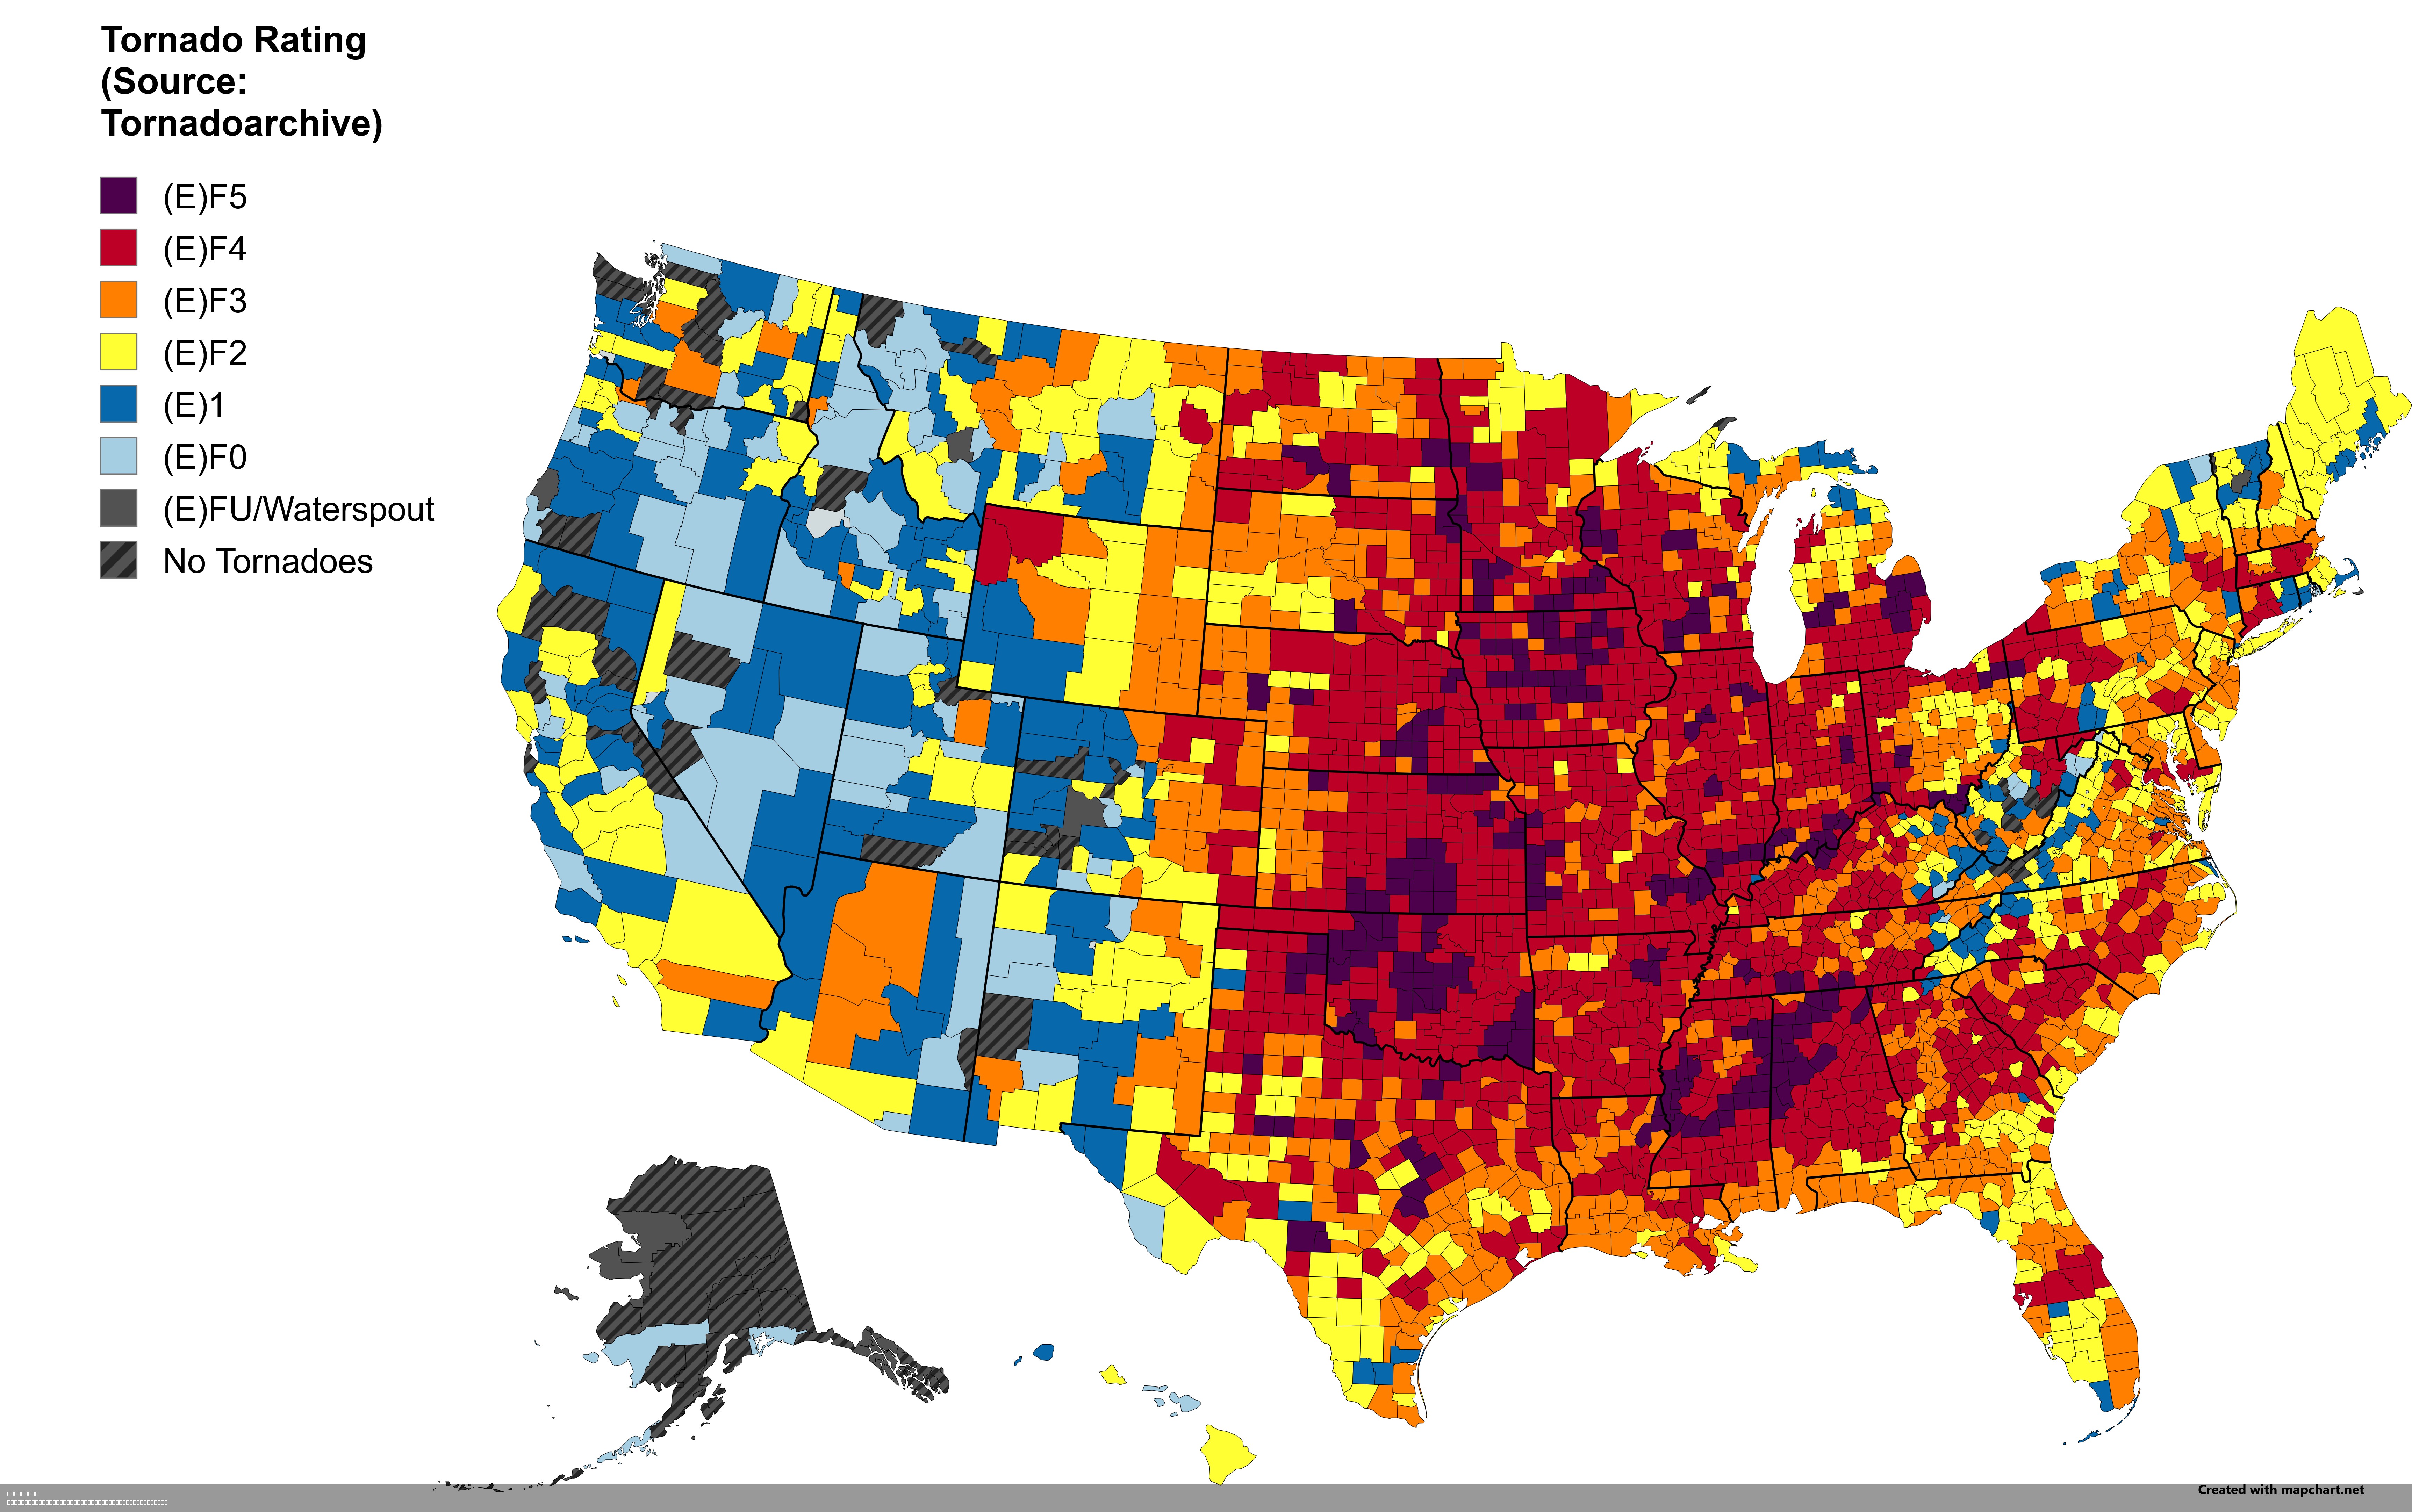
Strongest Tornado by US County Map
This intriguing visualization displays the strongest tornado recorded in each U.S. county. Tornadoes, nature's most viol...