1960's M9.5 Tsunami Sea-Level Rise Map

Alex Cartwright
Senior Cartographer & GIS Specialist
Alex Cartwright is a renowned cartographer and geographic information systems specialist with over 15 years of experience in spatial analysis and data...
Geographic Analysis
What This Map Shows
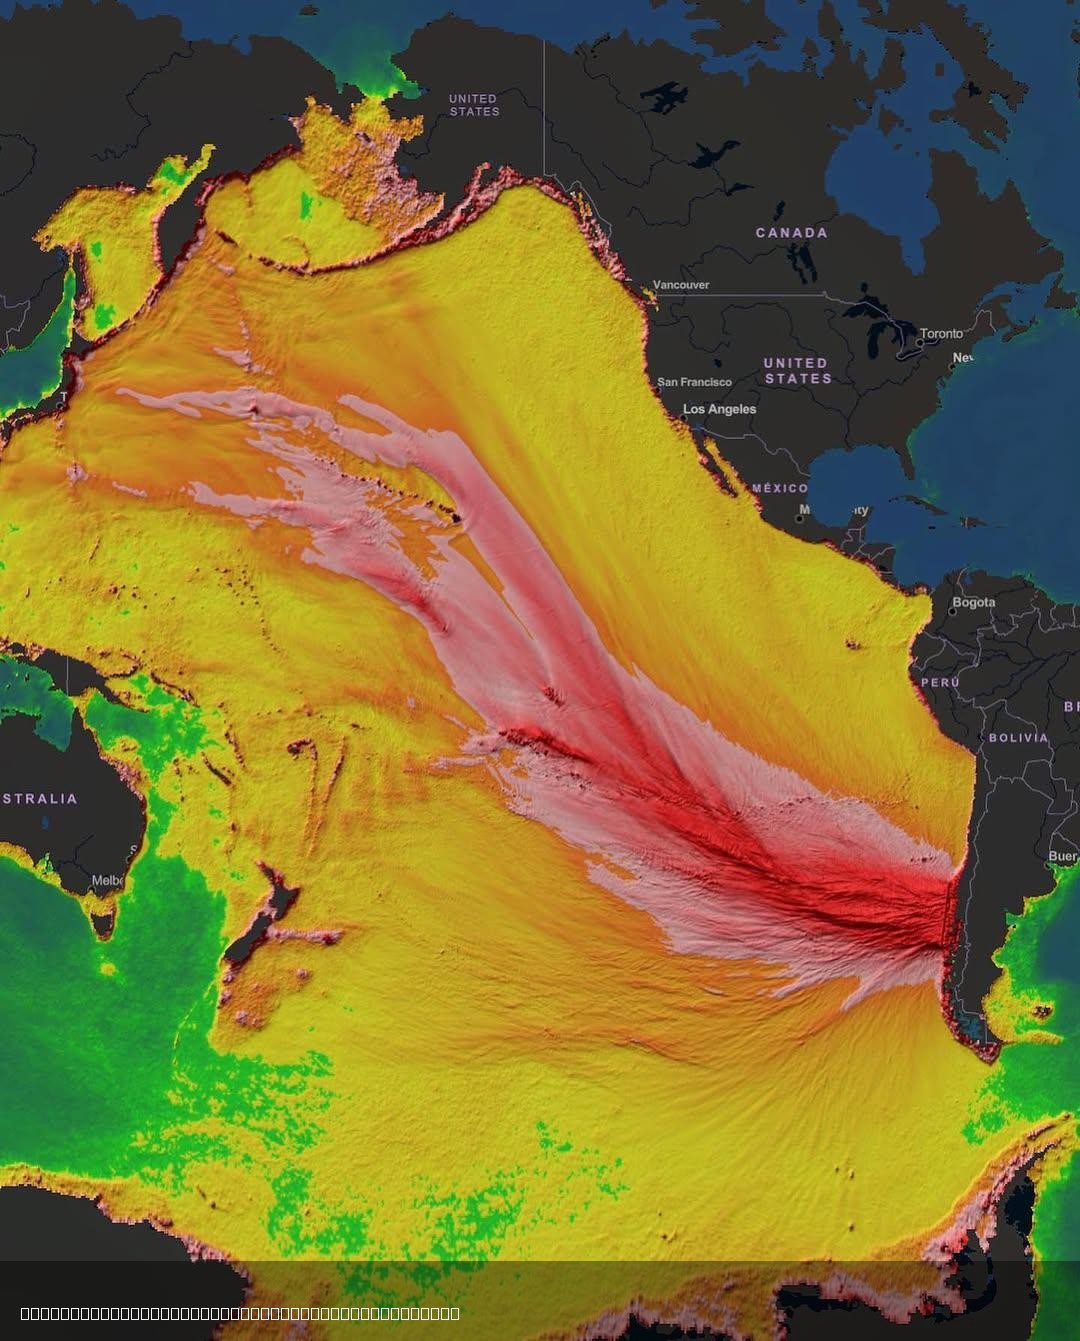
The visualization titled 'Historic Energy Model of 1960's M9.5 Tsunami' from NOAA's Pacific Tsunami Warning Center illustrates the maximum rise in sea level caused by a catastrophic tsunami event. This map is an essential tool for understanding the immense power of tsunamis and how they affect coastal regions. Notably, this specific tsunami, which occurred off the coast of Chile in 1960, is recorded as one of the most powerful earthquakes in history, measuring a staggering magnitude of 9.5. The map showcases the propagation of tsunami waves across the open ocean and the varying heights of those waves as they approach coastal areas, highlighting the destructive potential that such natural disasters can unleash.
Deep Dive into Tsunamis
Tsunamis are not just waves; they are massive oceanic phenomena typically triggered by underwater earthquakes, volcanic eruptions, or landslides. The 1960 M9.5 earthquake generated a tsunami that traveled across the Pacific Ocean, affecting numerous countries including Japan, the Philippines, and even the U.S. West Coast. What’s fascinating is that the speed of a tsunami can be comparable to that of a jet plane, often exceeding 500 miles per hour in deep water. However, as these waves approach shallower coastal regions, they slow down but increase in height, leading to devastating impacts.
The mechanics behind a tsunami's formation are intricate. When an earthquake occurs, the seafloor suddenly shifts, displacing vast amounts of water. This displacement creates waves that can extend across entire ocean basins. Interestingly, the energy of these waves is not just surface-level; it penetrates deep into the ocean, meaning that the entire water column is involved in the tsunami's movement. This is why the energy model displayed on the map is so crucial; it helps predict how high the sea level can rise and where the tsunami will have its most significant impact.
The 1960 tsunami exemplified this phenomenon, with waves that reached heights of over 25 meters in some areas. When these waves hit coastal communities, the effects were catastrophic, leading to loss of life, destruction of infrastructure, and long-term economic impacts. In total, the tsunami claimed around 5,700 lives and caused approximately $400 million in damages—a staggering figure for that time.
Regional Analysis
The map provides a detailed analysis of the tsunami's impact on various regions. For instance, in Chile, the tsunami waves reached their maximum height just minutes after the earthquake occurred, devastating coastal towns such as Valdivia and Puerto Montt. The immediate rise in sea level was not only a shock but also a severe warning sign that many were unprepared for. Comparatively, in Hawaii, the waves arrived hours later, allowing for some evacuation, but still caused extensive damage in areas like Hilo.
In Japan, the tsunami's arrival was anticipated to some extent due to the country's robust tsunami warning systems; however, the sheer force and height of the waves still resulted in significant destruction. Coastal cities like Sendai faced the brunt of this disaster, emphasizing the need for continuous improvement in disaster preparedness.
Interestingly, the map also reveals that the further a region is from the earthquake’s epicenter, the lesser the wave height, though this does not always correlate with safety. Areas like the West Coast of the United States experienced wave heights that, while smaller than those closer to Chile, still posed substantial risks to coastal communities.
Significance and Impact
Understanding the dynamics of tsunamis and their historic precedents is crucial for contemporary coastal management and disaster preparedness. The impact of the 1960 tsunami led to significant advancements in tsunami research and warning systems worldwide. Countries along the Pacific Rim, particularly those in the “Ring of Fire,” have since invested heavily in monitoring systems that can detect seismic activity and predict potential tsunamis.
Moreover, this historical event has prompted a reevaluation of building codes in coastal areas, emphasizing the importance of constructing resilient infrastructure that can withstand such natural disasters. As climate change continues to affect sea levels and weather patterns, the importance of this knowledge is more significant than ever. Future projections suggest that with rising sea levels, the threat from tsunamis could intensify, making it essential for communities to remain vigilant and prepared.
In conclusion, the 'Historic Energy Model of 1960's M9.5 Tsunami' map is not just a representation of past events; it is a vital tool for understanding the potential risks and impacts of future tsunamis. By studying these historical occurrences, we can better equip ourselves to face the challenges posed by nature’s most formidable forces.
Visualization Details
- Published
- August 3, 2025
- Views
- 162
Comments
Loading comments...