disaster preparedness Maps
6 geographic visualizations tagged with "disaster preparedness"
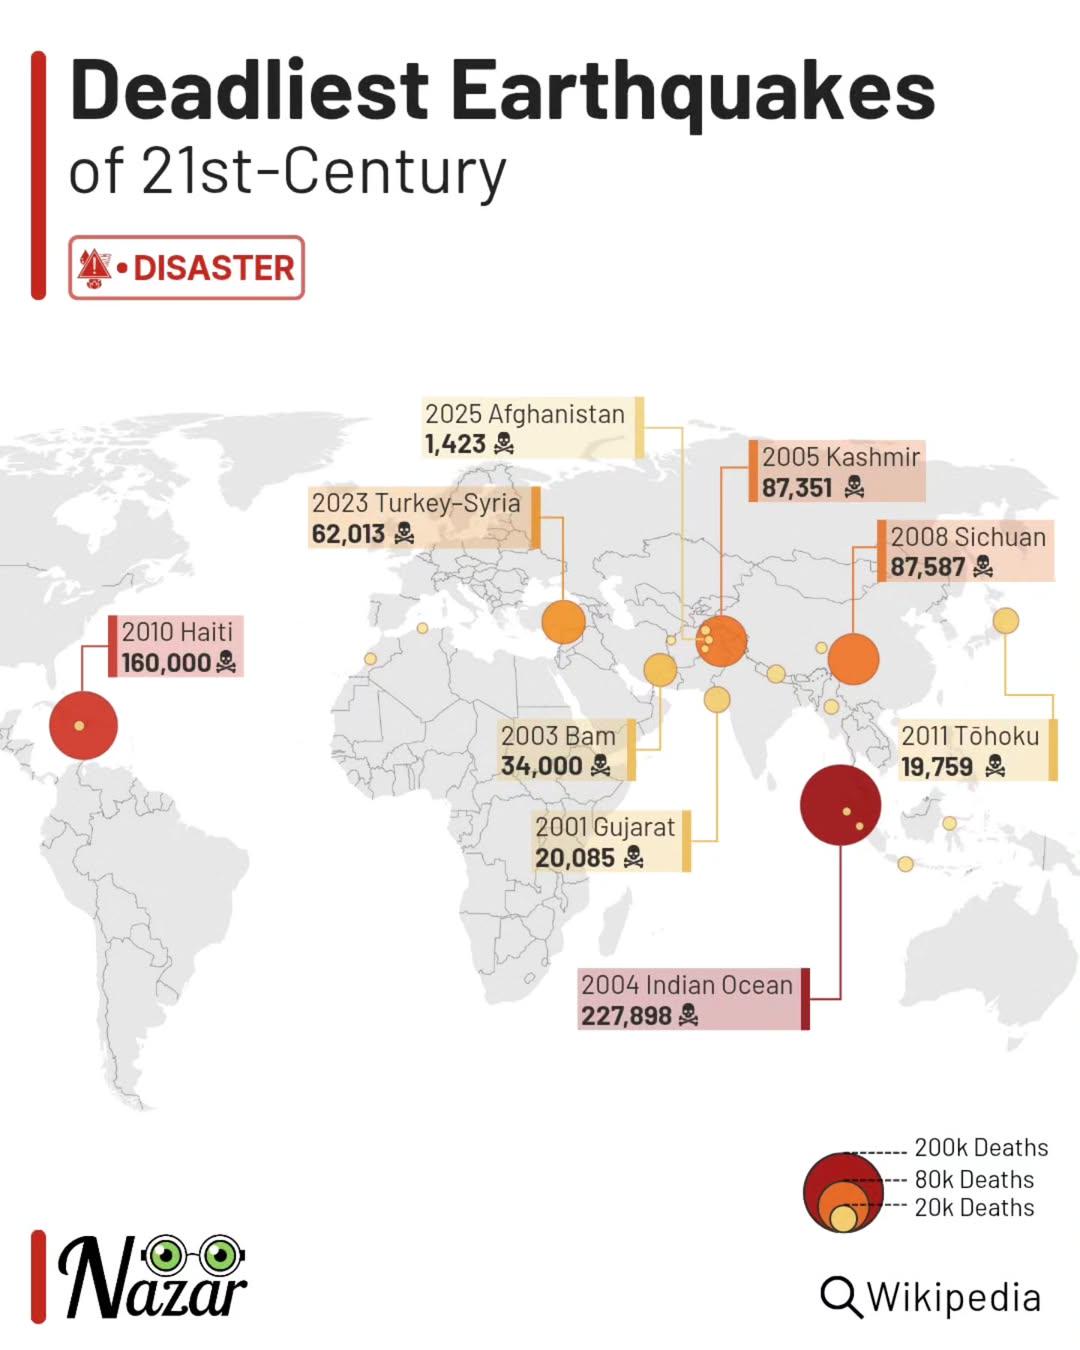
Deadliest Earthquakes of the 21st Century Map
The "Deadliest Earthquakes of the 21st Century" map offers a stark visual representation of the most catastrophic seismi...
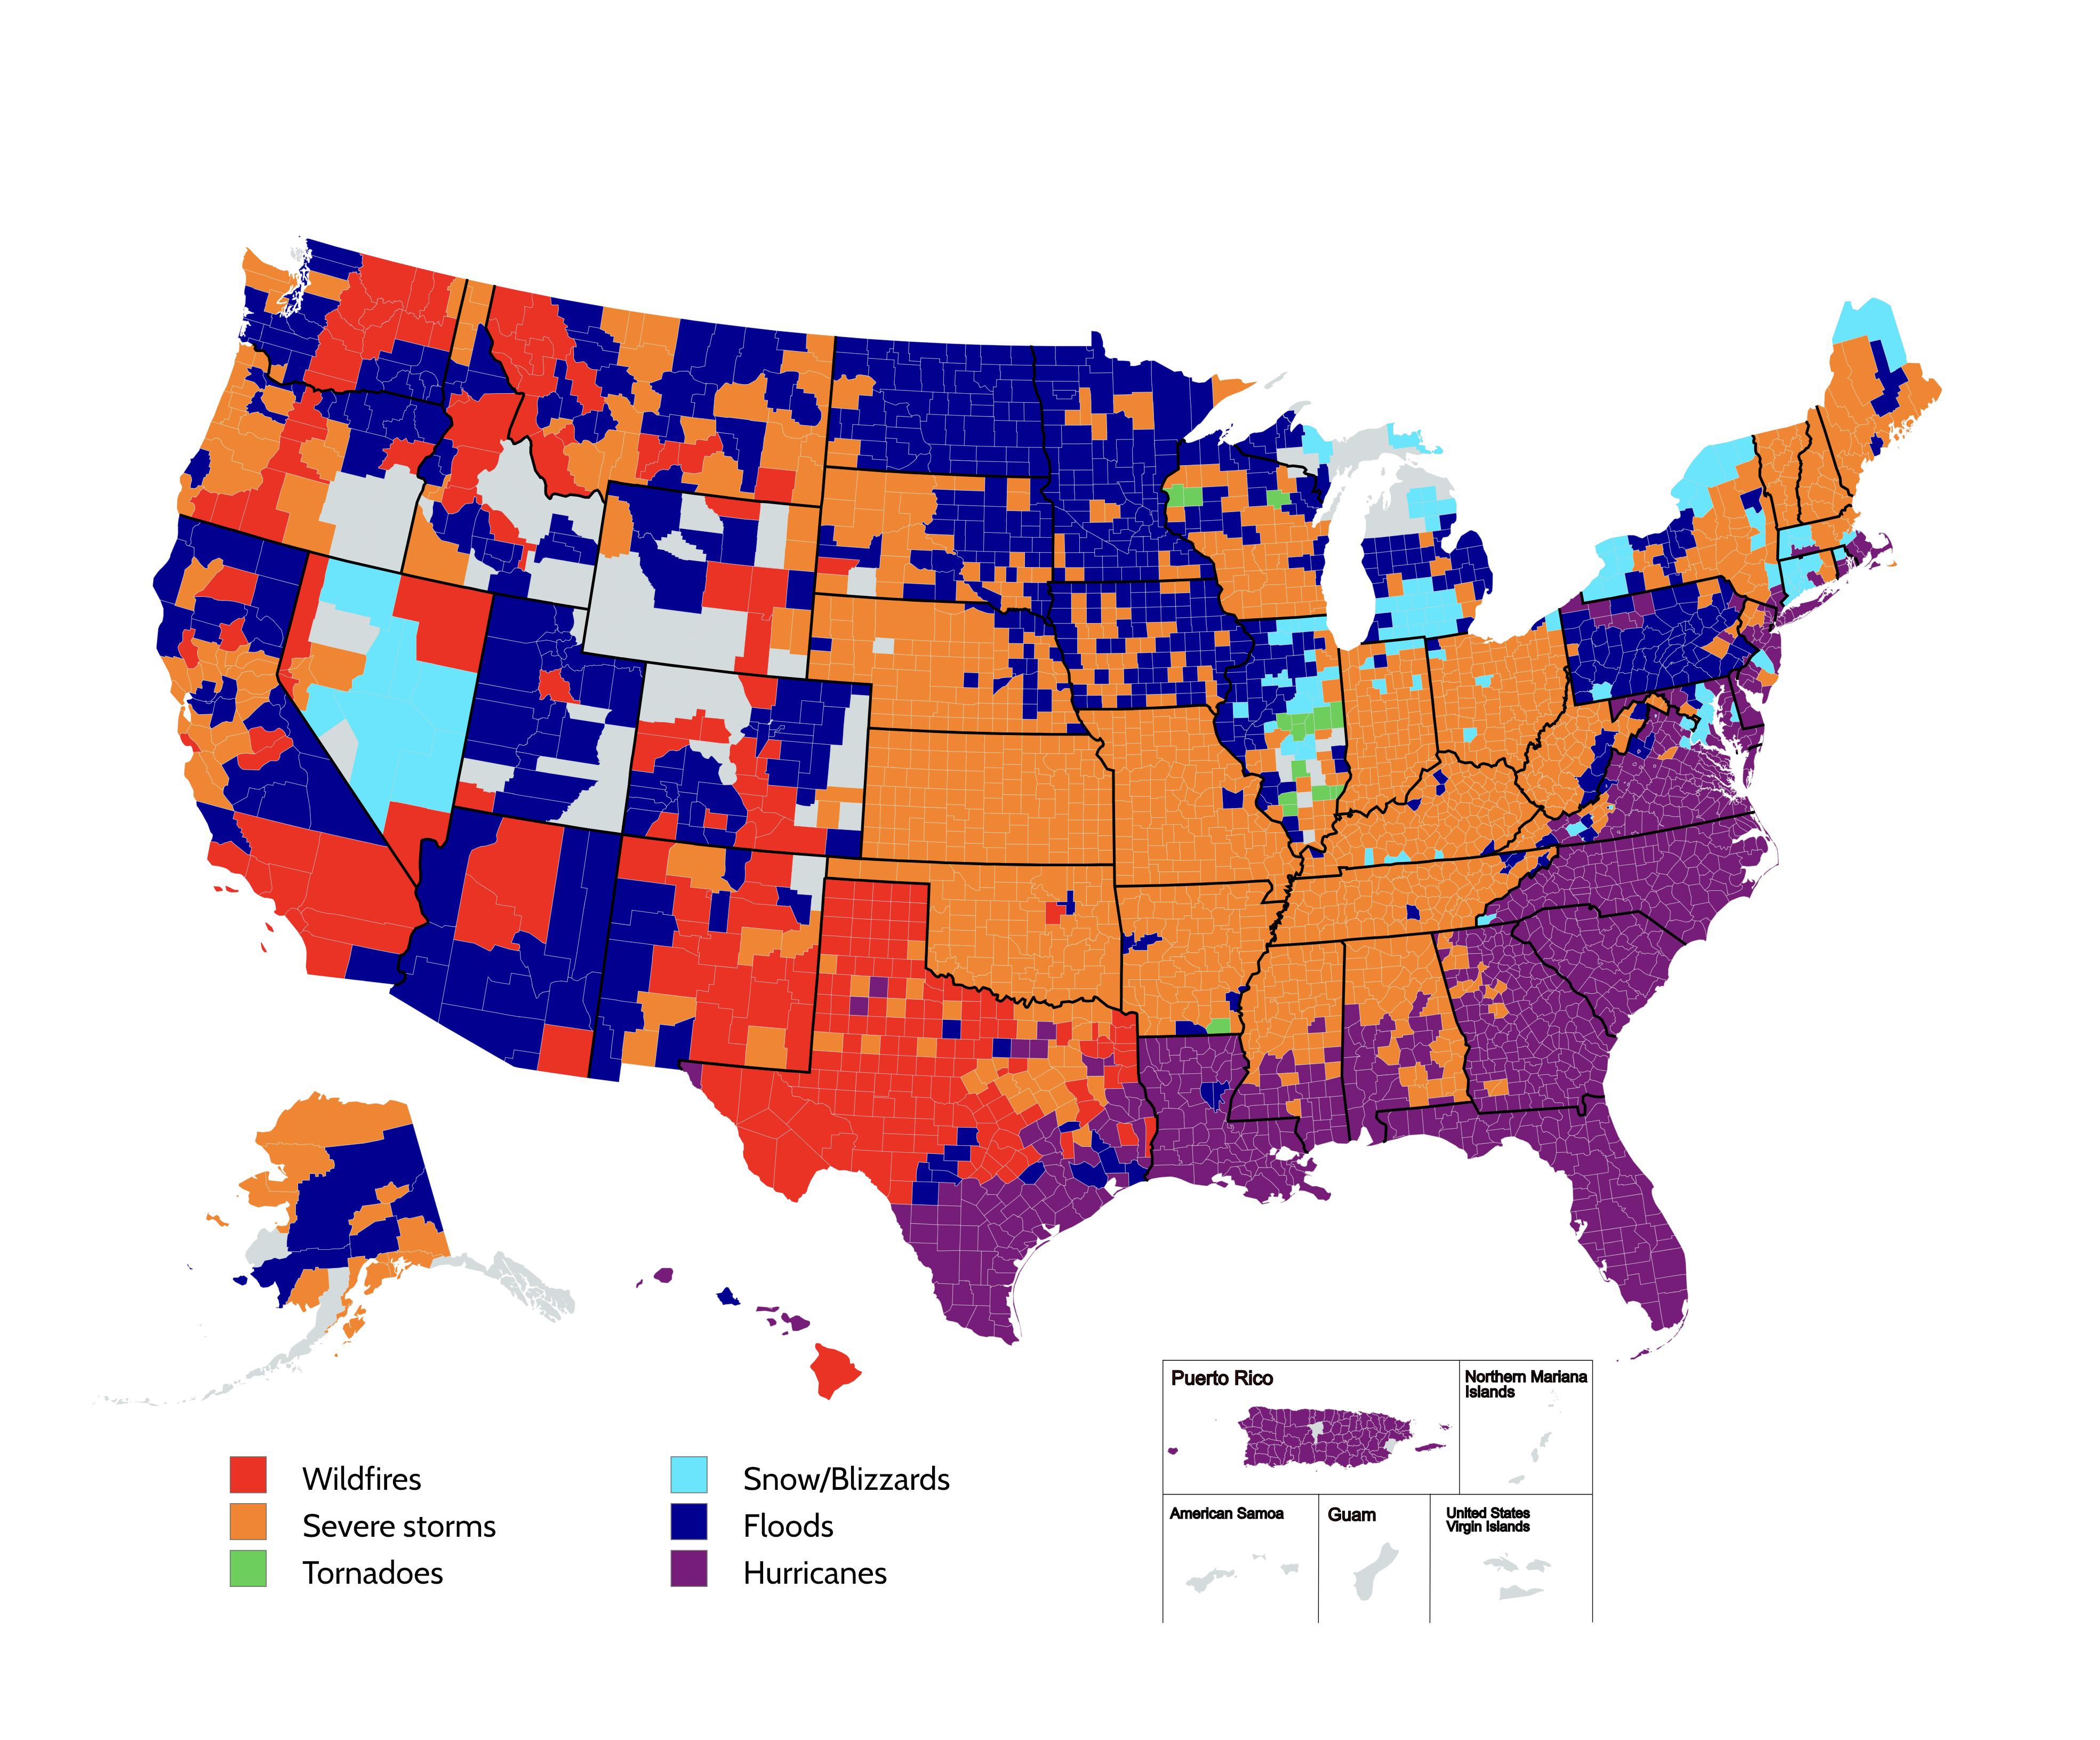
Map of Most Frequently Occurring Natural Disasters by US County
The visualization titled "Most Frequently Occurring Natural Disasters by US County" presents a striking overview of the ...
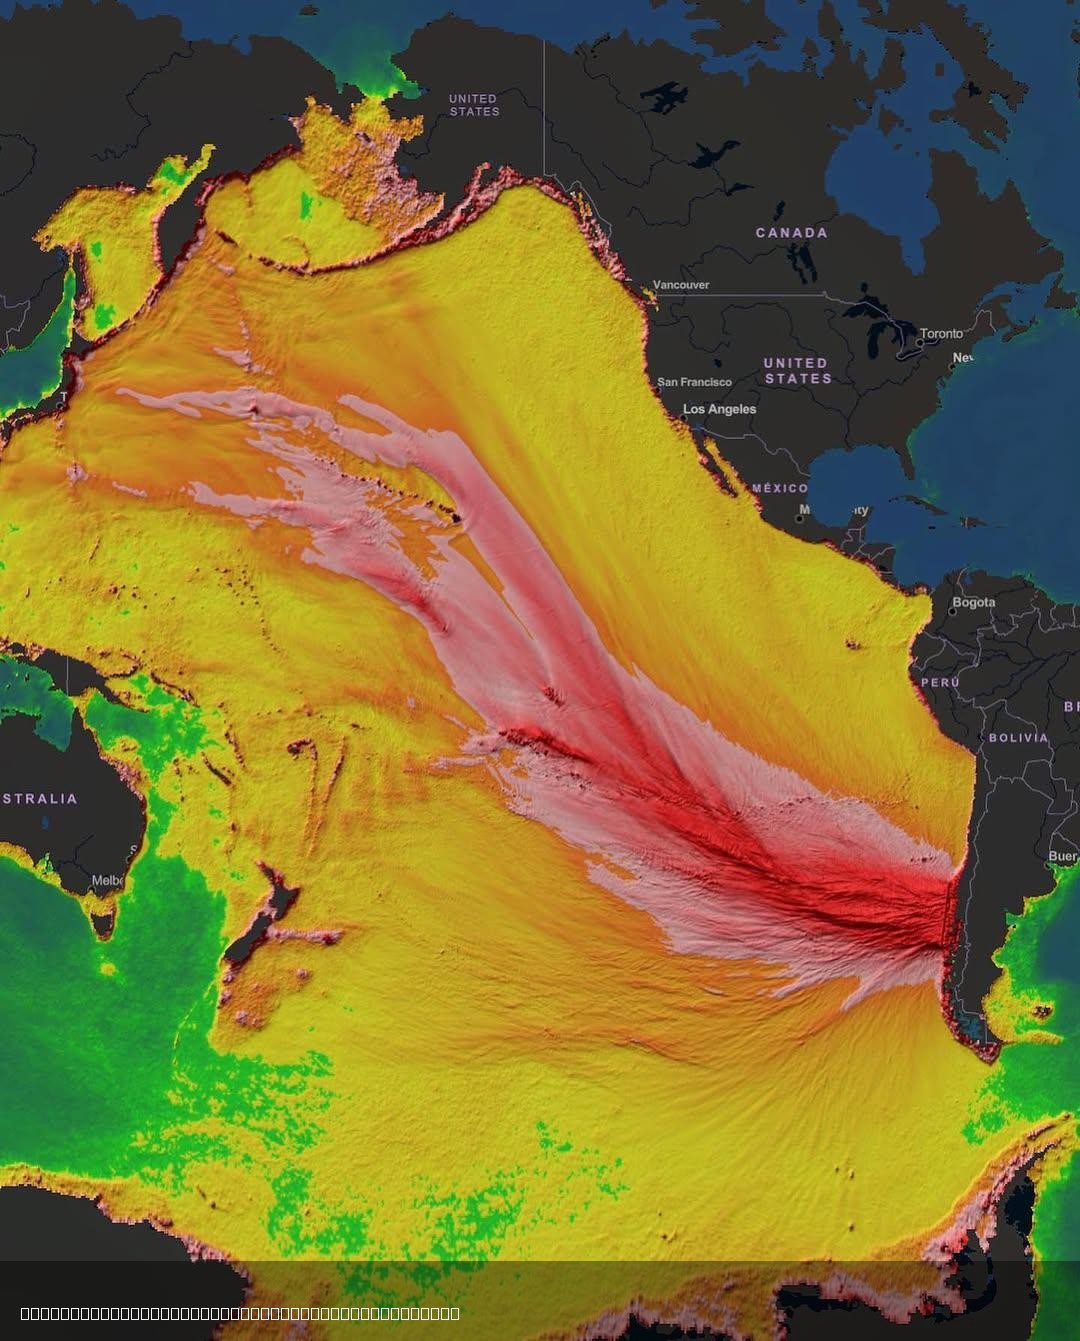
1960's M9.5 Tsunami Sea-Level Rise Map
The visualization titled 'Historic Energy Model of 1960's M9.5 Tsunami' from NOAA's Pacific Tsunami Warning Center illus...
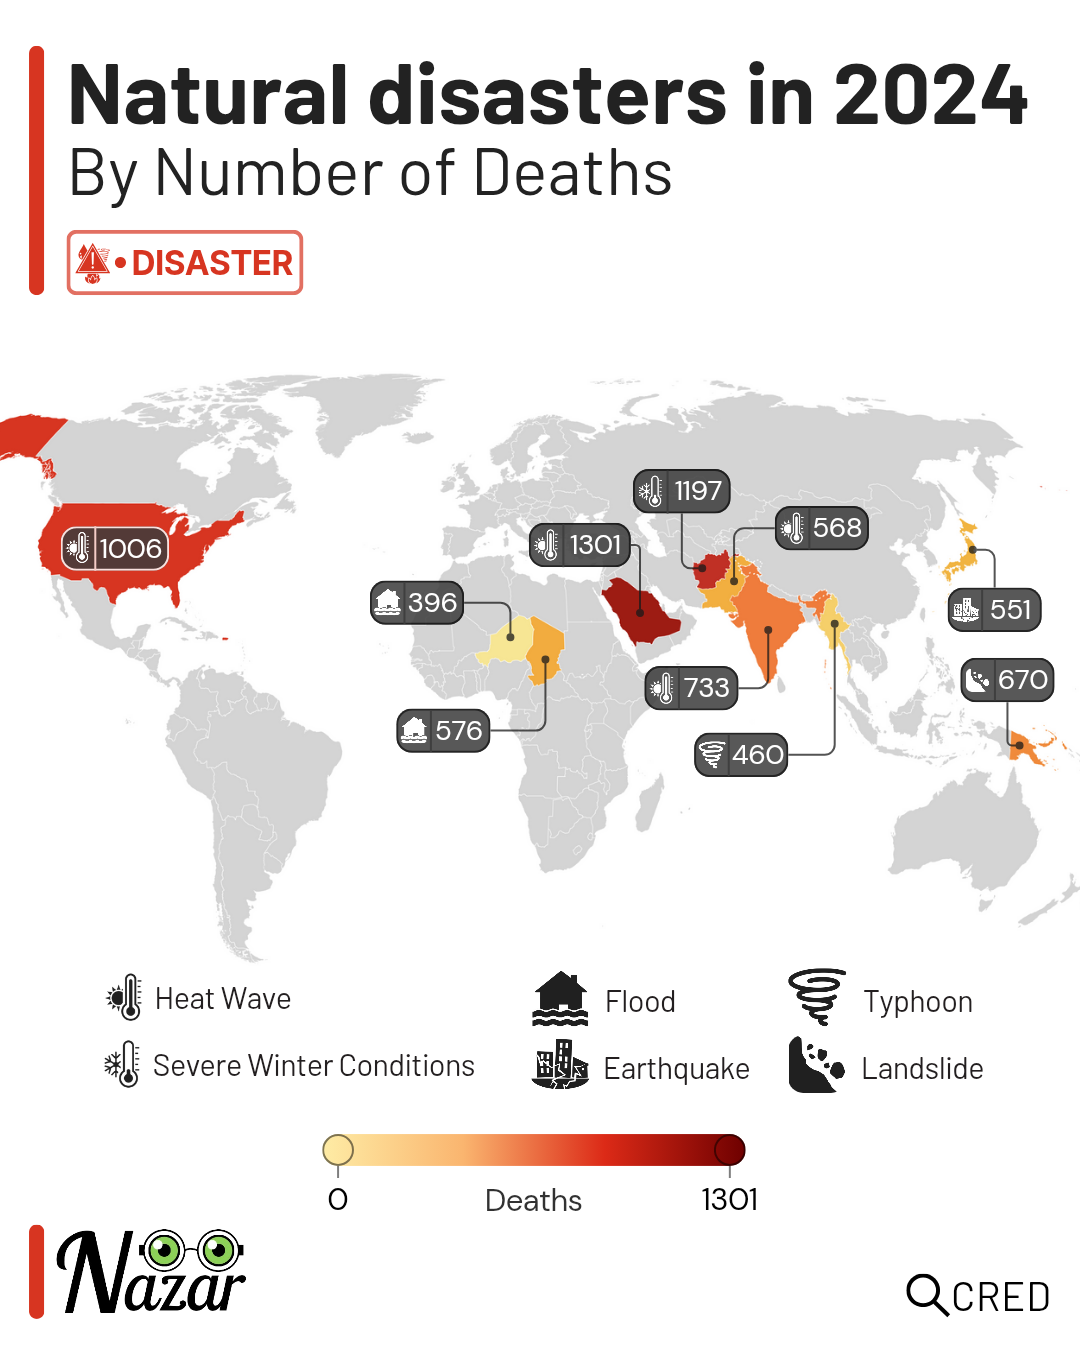
Natural Disasters in 2024 Map
The "Natural Disasters in 2024 Map" provides a stark visualization of the human toll inflicted by various natural disast...
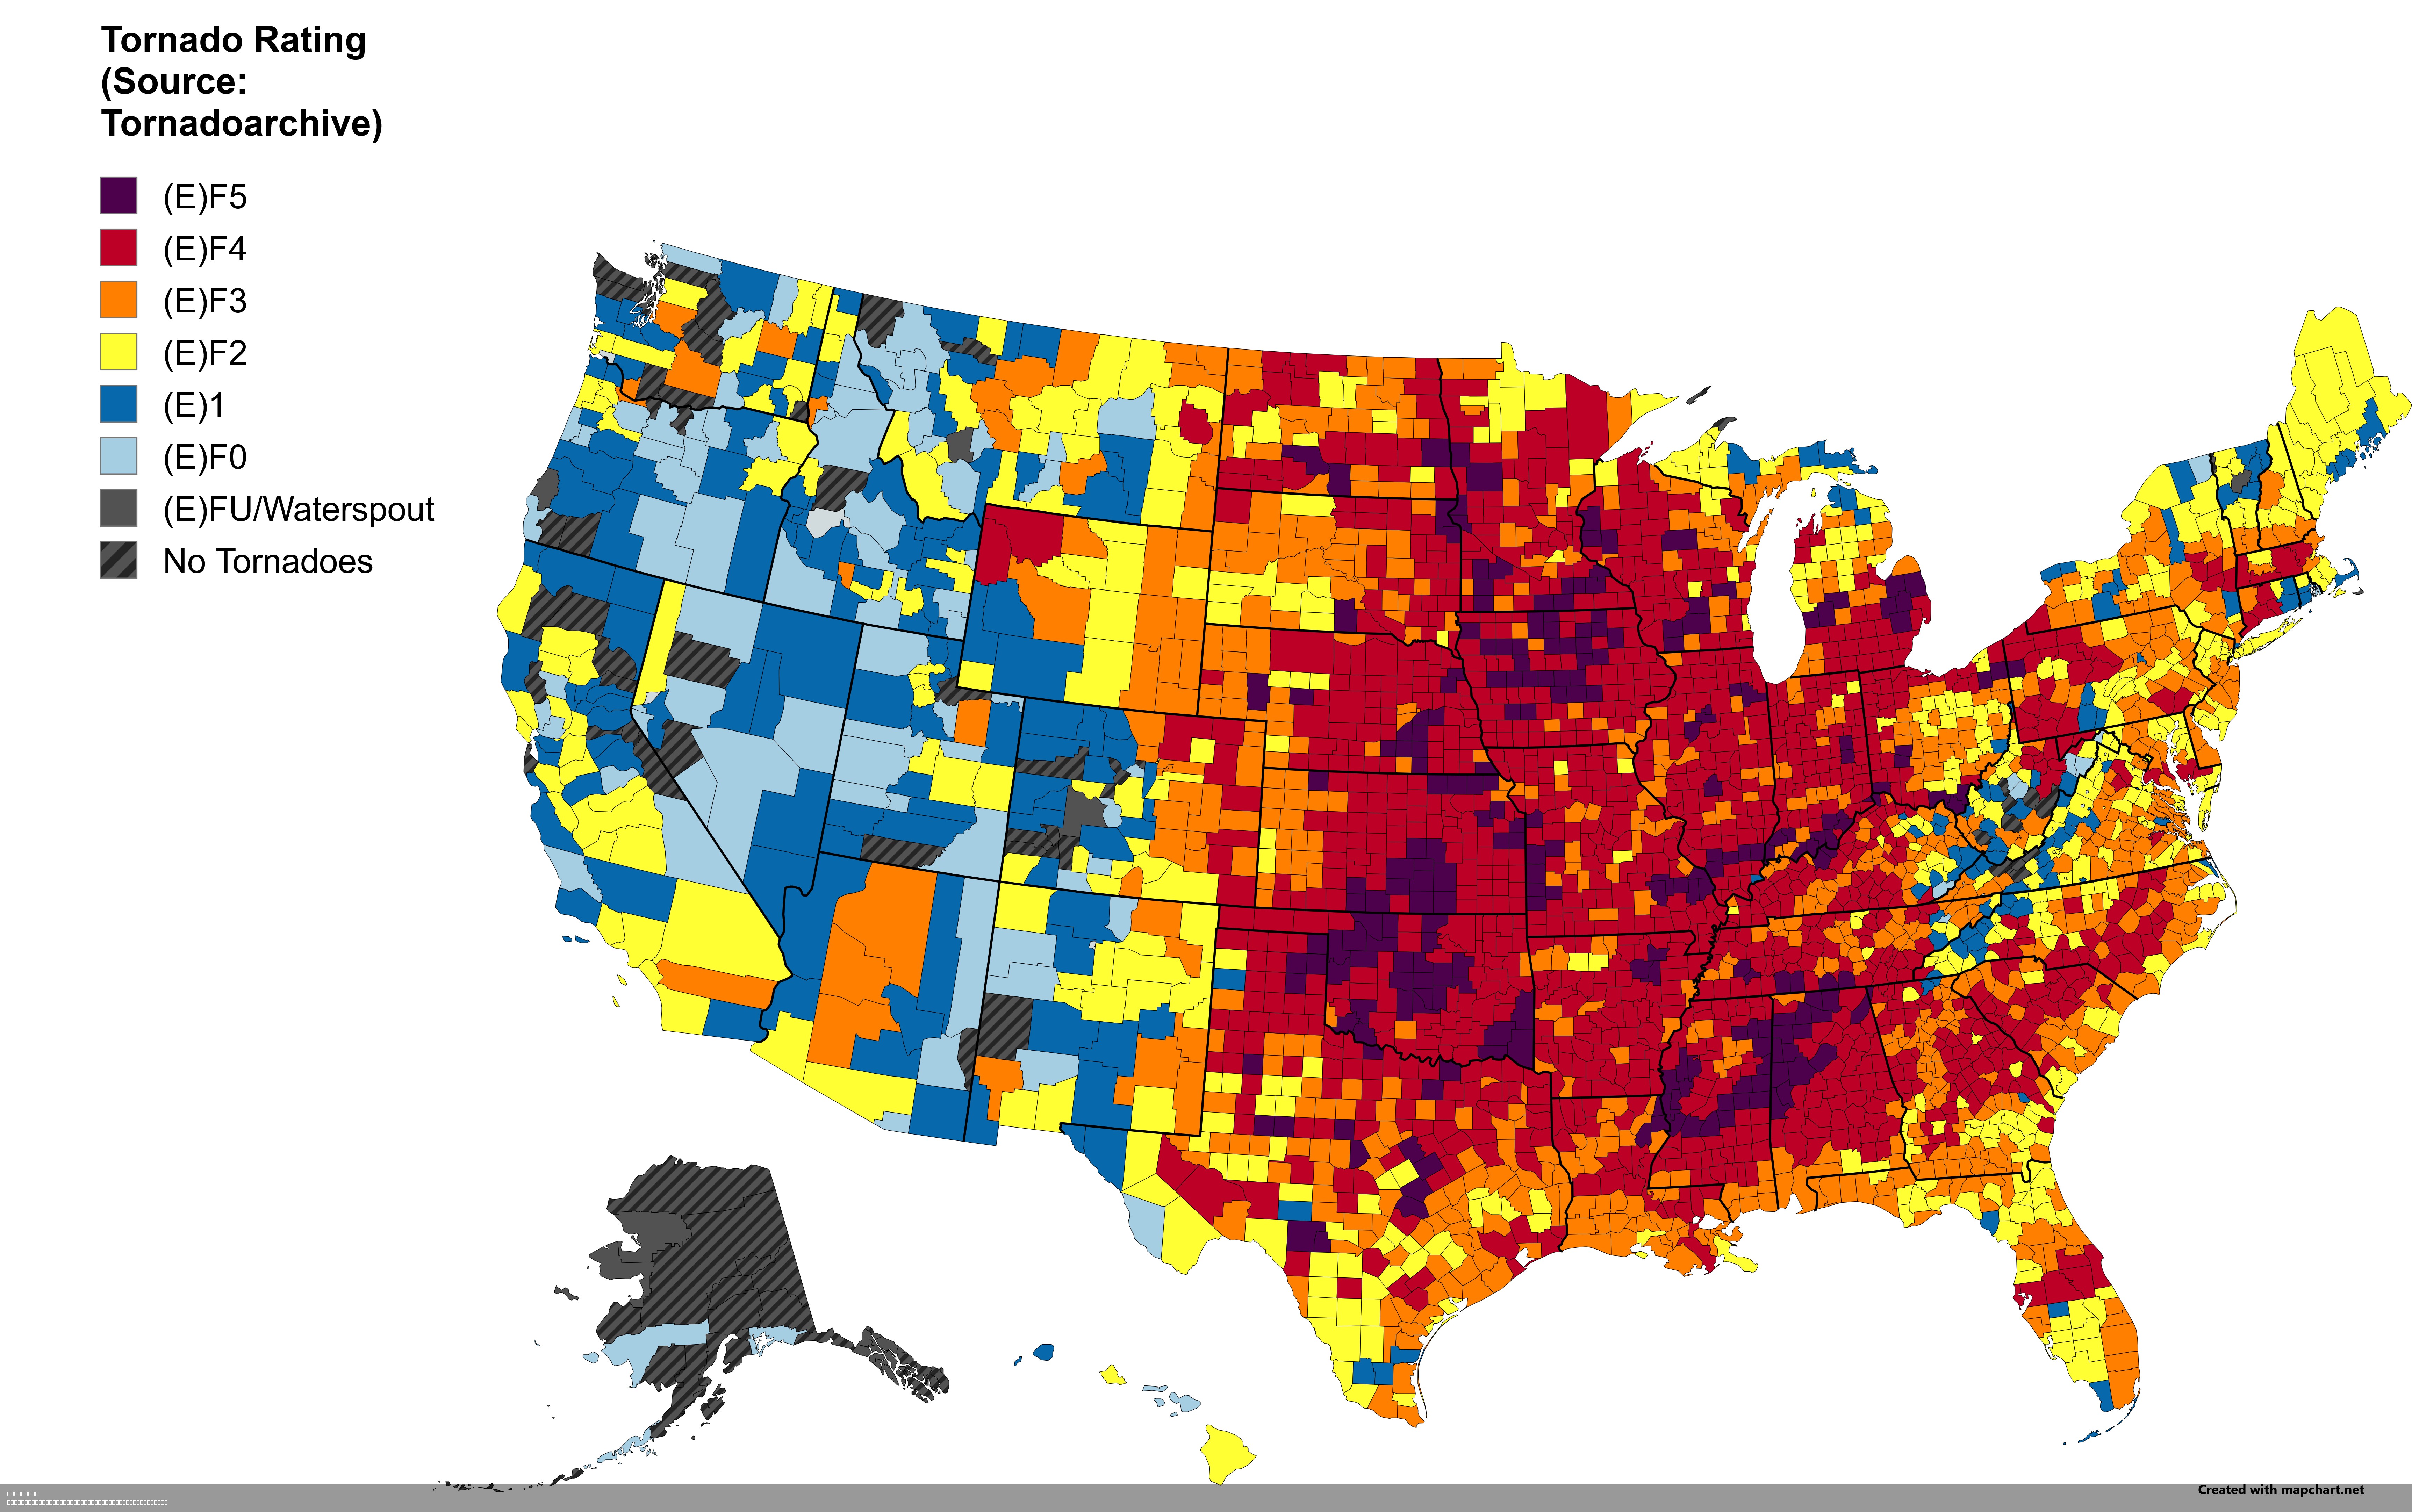
Strongest Tornado by US County Map
This intriguing visualization displays the strongest tornado recorded in each U.S. county. Tornadoes, nature's most viol...
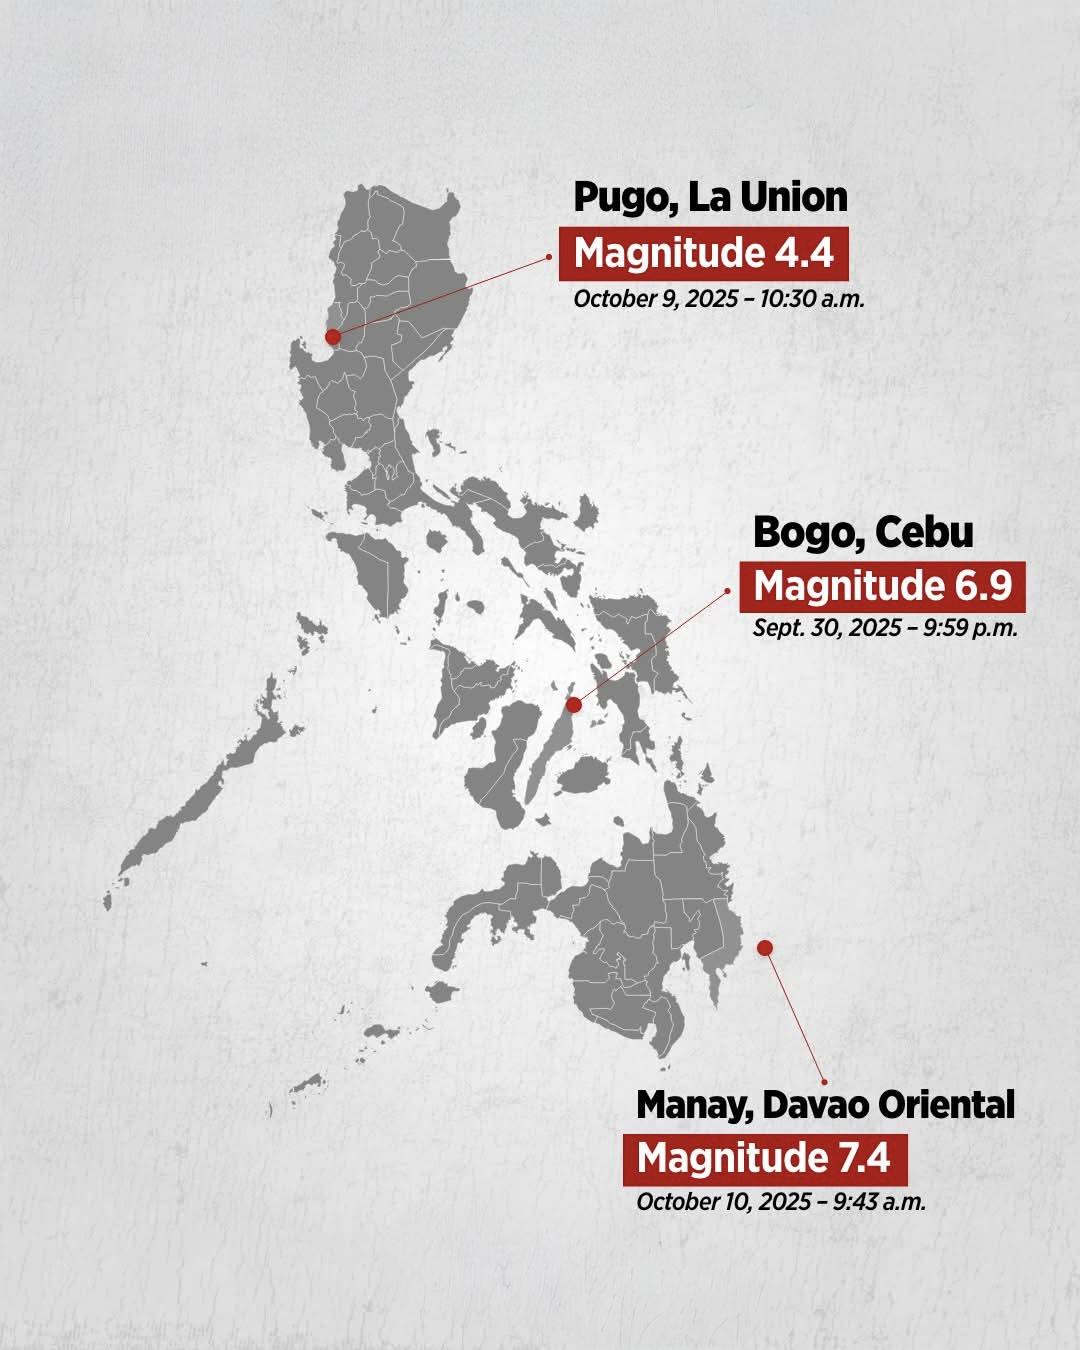
Recent Earthquake in the Philippines Map
The "Recent Earthquake in the Philippines Map" provides a detailed representation of seismic activity within the archipe...