FEMA Risk Map of Natural Disaster Vulnerability

Alex Cartwright
Senior Cartographer & GIS Specialist
Alex Cartwright is a renowned cartographer and geographic information systems specialist with over 15 years of experience in spatial analysis and data...
Geographic Analysis
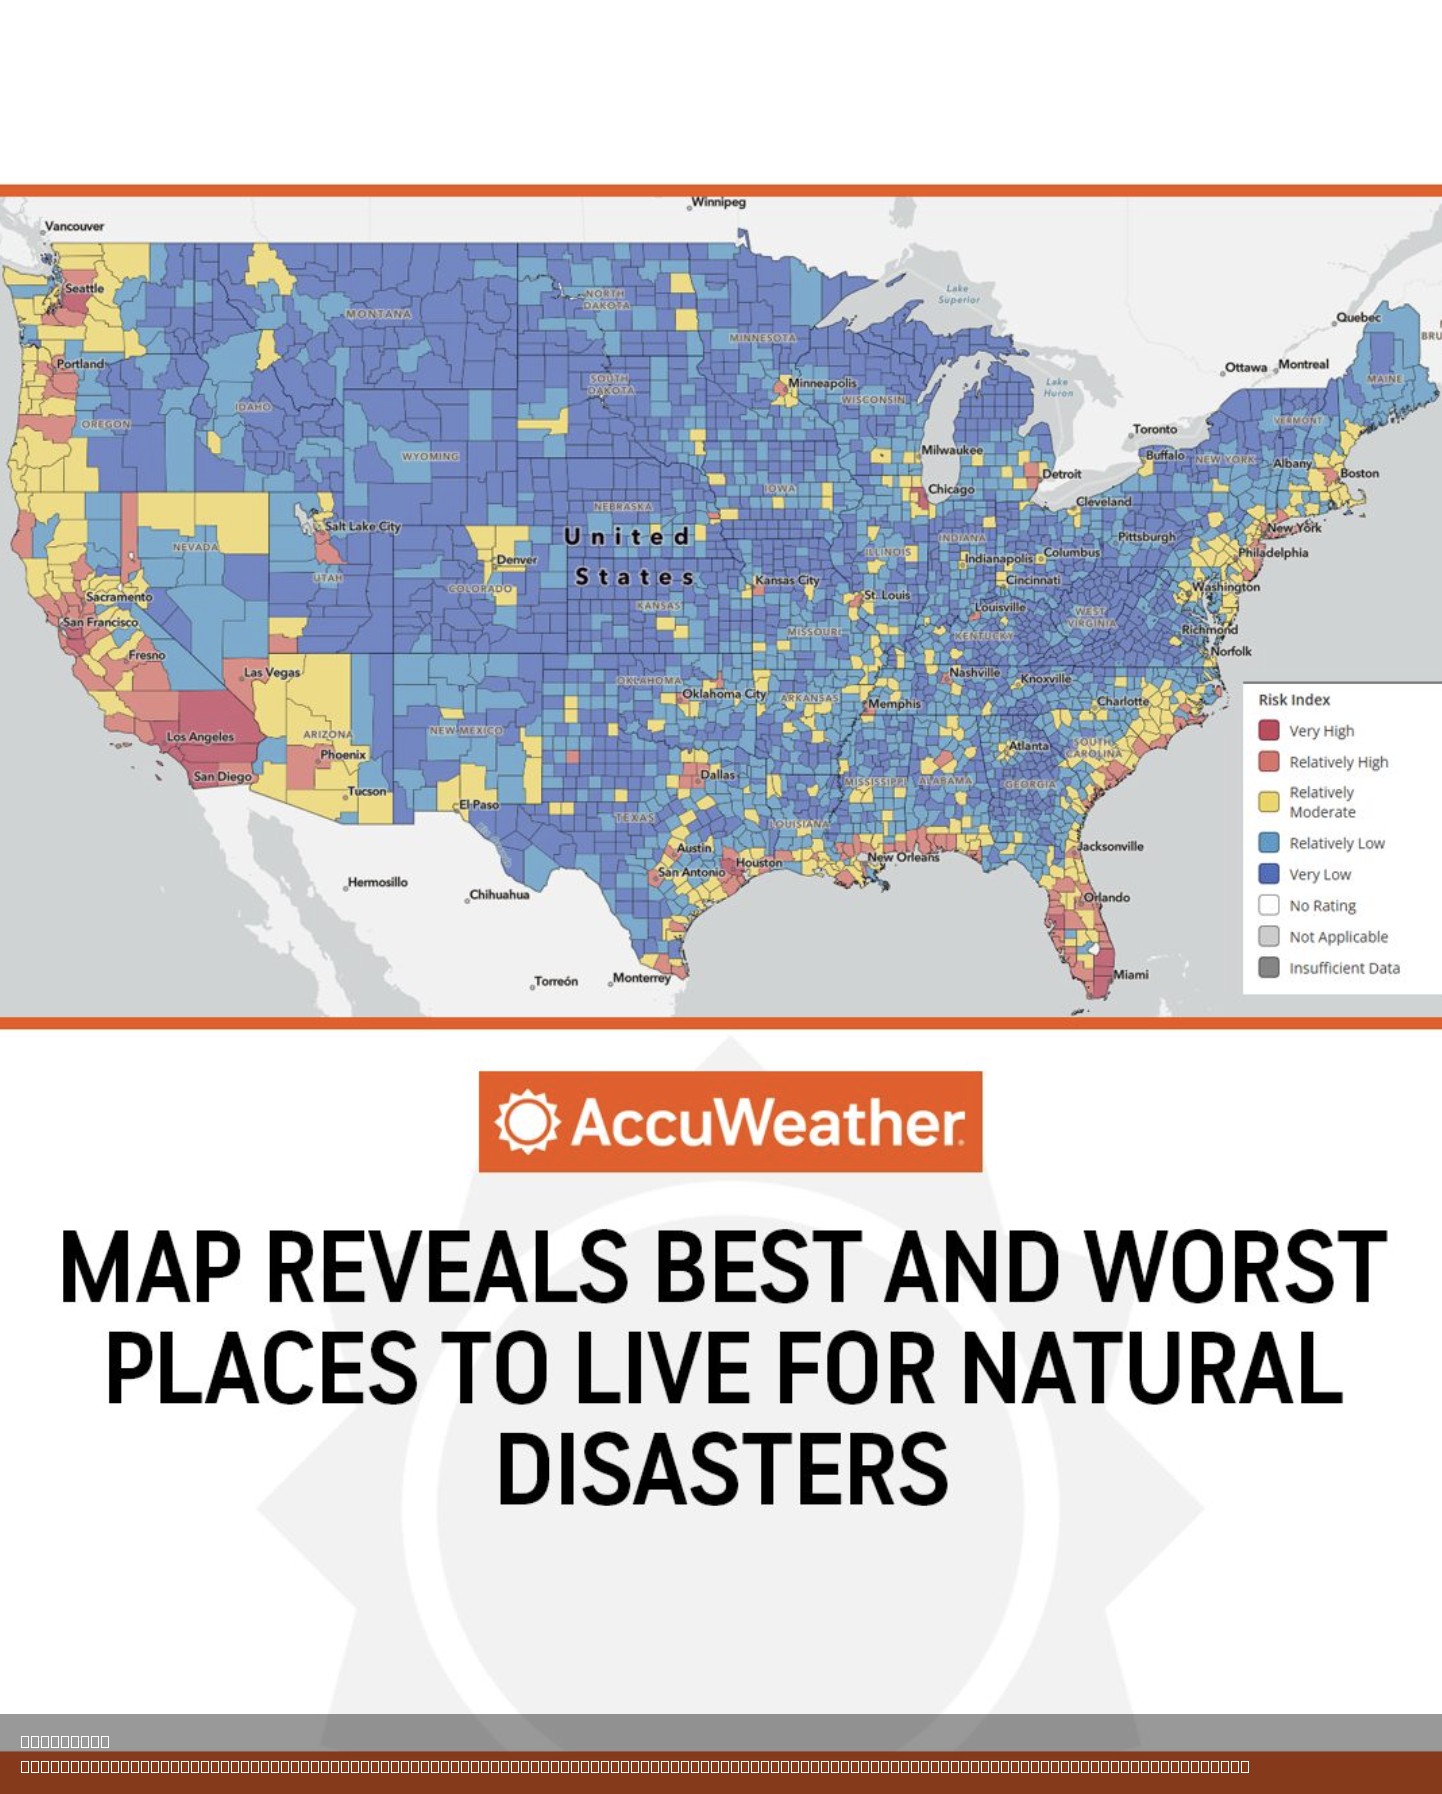
What This Map Shows\nThe FEMA Risk Map provides a comprehensive visualization of natural disaster risk across every county in the United States. It ranks areas based on disaster risk, social vulnerability, and community resilience, offering insights into where the greatest threats and challenges lie. This powerful tool not only highlights locations prone to natural disasters—such as hurricanes, floods, wildfires, and earthquakes—but also emphasizes the socio-economic factors that can exacerbate these risks.
Understanding the interplay between natural hazards and community vulnerability is critical for both individuals and policymakers. With the increasing frequency and intensity of climate-related disasters, this map serves as a vital resource for planning, preparedness, and risk mitigation.
Deep Dive into Natural Disaster Risks\nNatural disasters can vary widely in their nature and impact, and the FEMA Risk Map encapsulates this diversity. For instance, some regions are prone to hurricanes, particularly those along the Gulf Coast and the Eastern Seaboard. According to FEMA, these areas face not only the immediate threat of high winds and storm surges but also secondary effects such as flooding and infrastructure damage.
On the other hand, the western states, particularly California, are frequently threatened by wildfires, exacerbated by dry conditions and climate change. In 2020, wildfires burned over 4.3 million acres in California alone, causing widespread destruction and displacement. Interestingly, while the risk of wildfires is significant, the social vulnerability of populations in these areas varies considerably, affecting their capacity to respond and recover.
Flooding is another major concern, especially in regions with low-lying topography or near large bodies of water. States like Louisiana and Florida often face severe flooding, further complicated by socio-economic factors. For instance, areas with higher poverty rates may lack the resources necessary for effective disaster preparedness and recovery. FEMA’s data indicates that communities with lower resilience often experience longer recovery times, which can have lasting impacts on local economies and quality of life.
Earthquakes, particularly in California and parts of Alaska, present unique challenges. The seismic risks are high, and while building codes have improved, the potential for significant damage remains. The psychological toll of living in earthquake-prone areas can also affect community resilience and preparedness.
Regional Analysis\nThe FEMA Risk Map reveals significant regional differences in disaster risk and resilience. For example, the Midwest, while not frequently associated with hurricanes or earthquakes, faces its own unique challenges, such as tornadoes. States like Kansas and Nebraska experience a high frequency of tornadoes, yet they often have robust community networks that enhance resilience.
Conversely, the coastal regions of the Southeast, including Florida and North Carolina, are particularly vulnerable to hurricanes. The risk is compounded by the social vulnerability of communities that may lack the infrastructure or resources for effective disaster response. The map shows that many counties in these regions rank high in disaster risk and low in community resilience, indicating a critical need for targeted disaster preparedness programs.
Interestingly, areas like New York City, which face a combination of flooding and social vulnerability due to dense populations and economic disparities, underscore the importance of comprehensive urban planning and investment in infrastructure to mitigate risks. In contrast, regions like the Pacific Northwest, with lower overall disaster risk, still face challenges from potential volcanic eruptions and earthquakes, highlighting that no area is entirely safe from natural disasters.
Significance and Impact\nUnderstanding the implications of the FEMA Risk Map is crucial for a variety of stakeholders. For residents, this map serves as a warning and a call to action. It underscores the importance of being prepared for natural disasters, whether that means having an emergency kit, understanding evacuation routes, or developing community resilience plans.
Policymakers can use this information to prioritize funding and resources, ensuring that vulnerable communities receive the support they need to enhance their resilience. The map also highlights where investments in infrastructure could yield significant benefits, such as flood defenses in at-risk areas.
As climate change continues to exacerbate natural disasters, the insights provided by FEMA’s Risk Map will only grow in importance. Current trends show that disaster frequency is on the rise, necessitating proactive measures to safeguard communities. Future projections suggest that regions currently deemed low-risk may face increasing threats, making it vital for everyone to stay informed about their local risks and prepare accordingly.
In conclusion, FEMA’s Risk Map is more than just a visualization; it’s a crucial resource that informs our understanding of natural disaster risks across the United States. By recognizing the areas at greatest risk and the social vulnerabilities that can amplify those threats, we can work towards a more resilient future for all communities.
Visualization Details
- Published
- August 3, 2025
- Views
- 142
Comments
Loading comments...