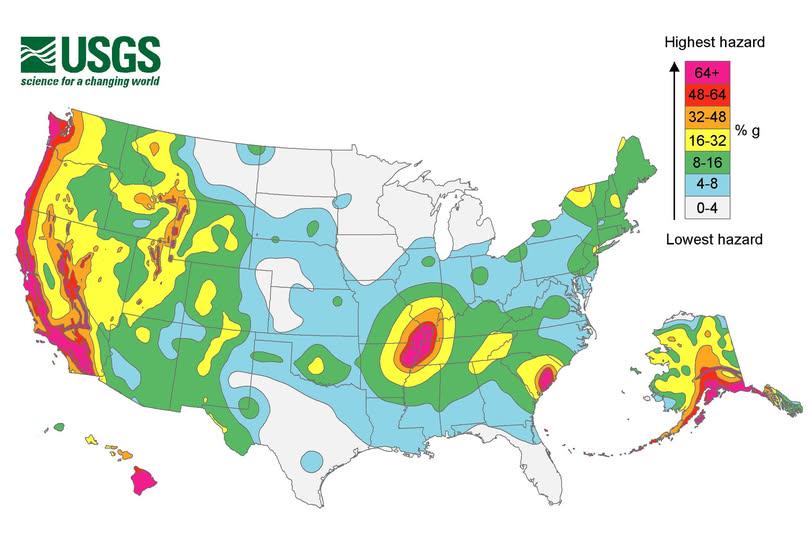
Earthquake Hazard Levels Map of the United States


Alex Cartwright
Senior Cartographer & GIS Specialist
Alex Cartwright is a renowned cartographer and geographic information systems specialist with over 15 years of experience in spatial analysis and data...
Geographic Analysis
What This Map Shows
The "Earthquake Hazard Levels Map of the United States" illustrates the varying levels of seismic risk across the country. Using a color-coded system, it highlights areas prone to earthquakes, indicating which regions are at higher risk based on historical data and geological assessments. This map serves as an important tool for understanding the potential threat of earthquakes and preparing for such natural disasters.
Deep Dive into Earthquake Hazards
Earthquakes are among the most dramatic and unpredictable natural disasters, caused by the sudden release of energy in the Earth’s crust. The United States is home to several tectonic plates, including the Pacific Plate and the North American Plate, which interact in ways that can trigger earthquakes of varying magnitudes. The geological makeup of these regions is crucial in determining the frequency and intensity of seismic activity.
Interestingly, the U.S. Geological Survey (USGS) has categorized earthquake hazard levels into different zones. Areas in the West, particularly California, Alaska, and parts of the Pacific Northwest, are classified as high-risk zones due to their proximity to major fault lines, such as the San Andreas Fault. For example, California experiences thousands of earthquakes each year, most of which are small and go unnoticed. However, the potential for a significant quake looms large, with the USGS estimating that there’s a 72% chance of a magnitude 6.7 or greater earthquake in California within the next 30 years.
In contrast, the central and eastern United States are generally considered to have lower earthquake hazard levels. However, significant historical earthquakes, such as the 1811-1812 New Madrid earthquakes and the 1886 Charleston earthquake, remind us that seismic activity can occur outside the traditional high-risk zones. Populations in these areas may be less prepared due to the lower frequency of earthquakes, which raises concerns about resilience and response capabilities in the event of a significant seismic event.
The map also reflects the importance of public awareness and preparedness. Regions identified as having high earthquake hazards have typically implemented stricter building codes and regulations to mitigate damage during seismic events. Interestingly, states like California have adopted proactive measures, including earthquake drills and community preparedness initiatives, to enhance public safety.
Regional Analysis
When examining the map more closely, we can see distinct regional patterns. The West Coast, particularly California, Nevada, and parts of Washington and Oregon, are marked in high-risk colors. These areas not only experience frequent seismic activity but also have diverse geological features that contribute to the likelihood of earthquakes. For instance, the Sierra Nevada mountain range's uplift and the volcanic activity in Oregon increase the risk factors considerably.
Moving inland, states like Utah and Idaho also show significant hazard levels due to their geological settings. The Wasatch Fault in Utah is an area of concern, as it is expected to produce a major earthquake within the next few decades, according to seismologists.
Conversely, the Midwest and the Eastern U.S., while generally safer, should not be overlooked. The map highlights regions like the New Madrid Seismic Zone, where the risk is moderate but can result in substantial damage due to the older infrastructure and less earthquake-resistant building practices.
Significance and Impact
Understanding earthquake hazard levels is critical for disaster preparedness and risk management. The implications of these hazards can be profound, affecting everything from urban planning to insurance rates and emergency response strategies. Have you noticed how cities in high-risk areas often have more robust infrastructure? This is no coincidence; it’s a direct response to the understanding of their seismic vulnerabilities.
Moreover, with climate change and urban expansion, the dynamics of seismic hazard levels may evolve. As more people move into high-risk zones, the potential for loss of life and property increases. This makes ongoing education and preparedness initiatives essential.
In conclusion, the "Earthquake Hazard Levels Map of the United States" not only serves as a visual representation of seismic risks but also emphasizes the need for proactive measures to safeguard lives and property. By understanding these hazards, communities can make informed decisions about building practices and emergency preparedness, ultimately reducing the impact of future earthquakes.
Visualization Details
- Published
- August 7, 2025
- Views
- 268
Comments
Loading comments...