socio-economics Maps
11 geographic visualizations tagged with "socio-economics"
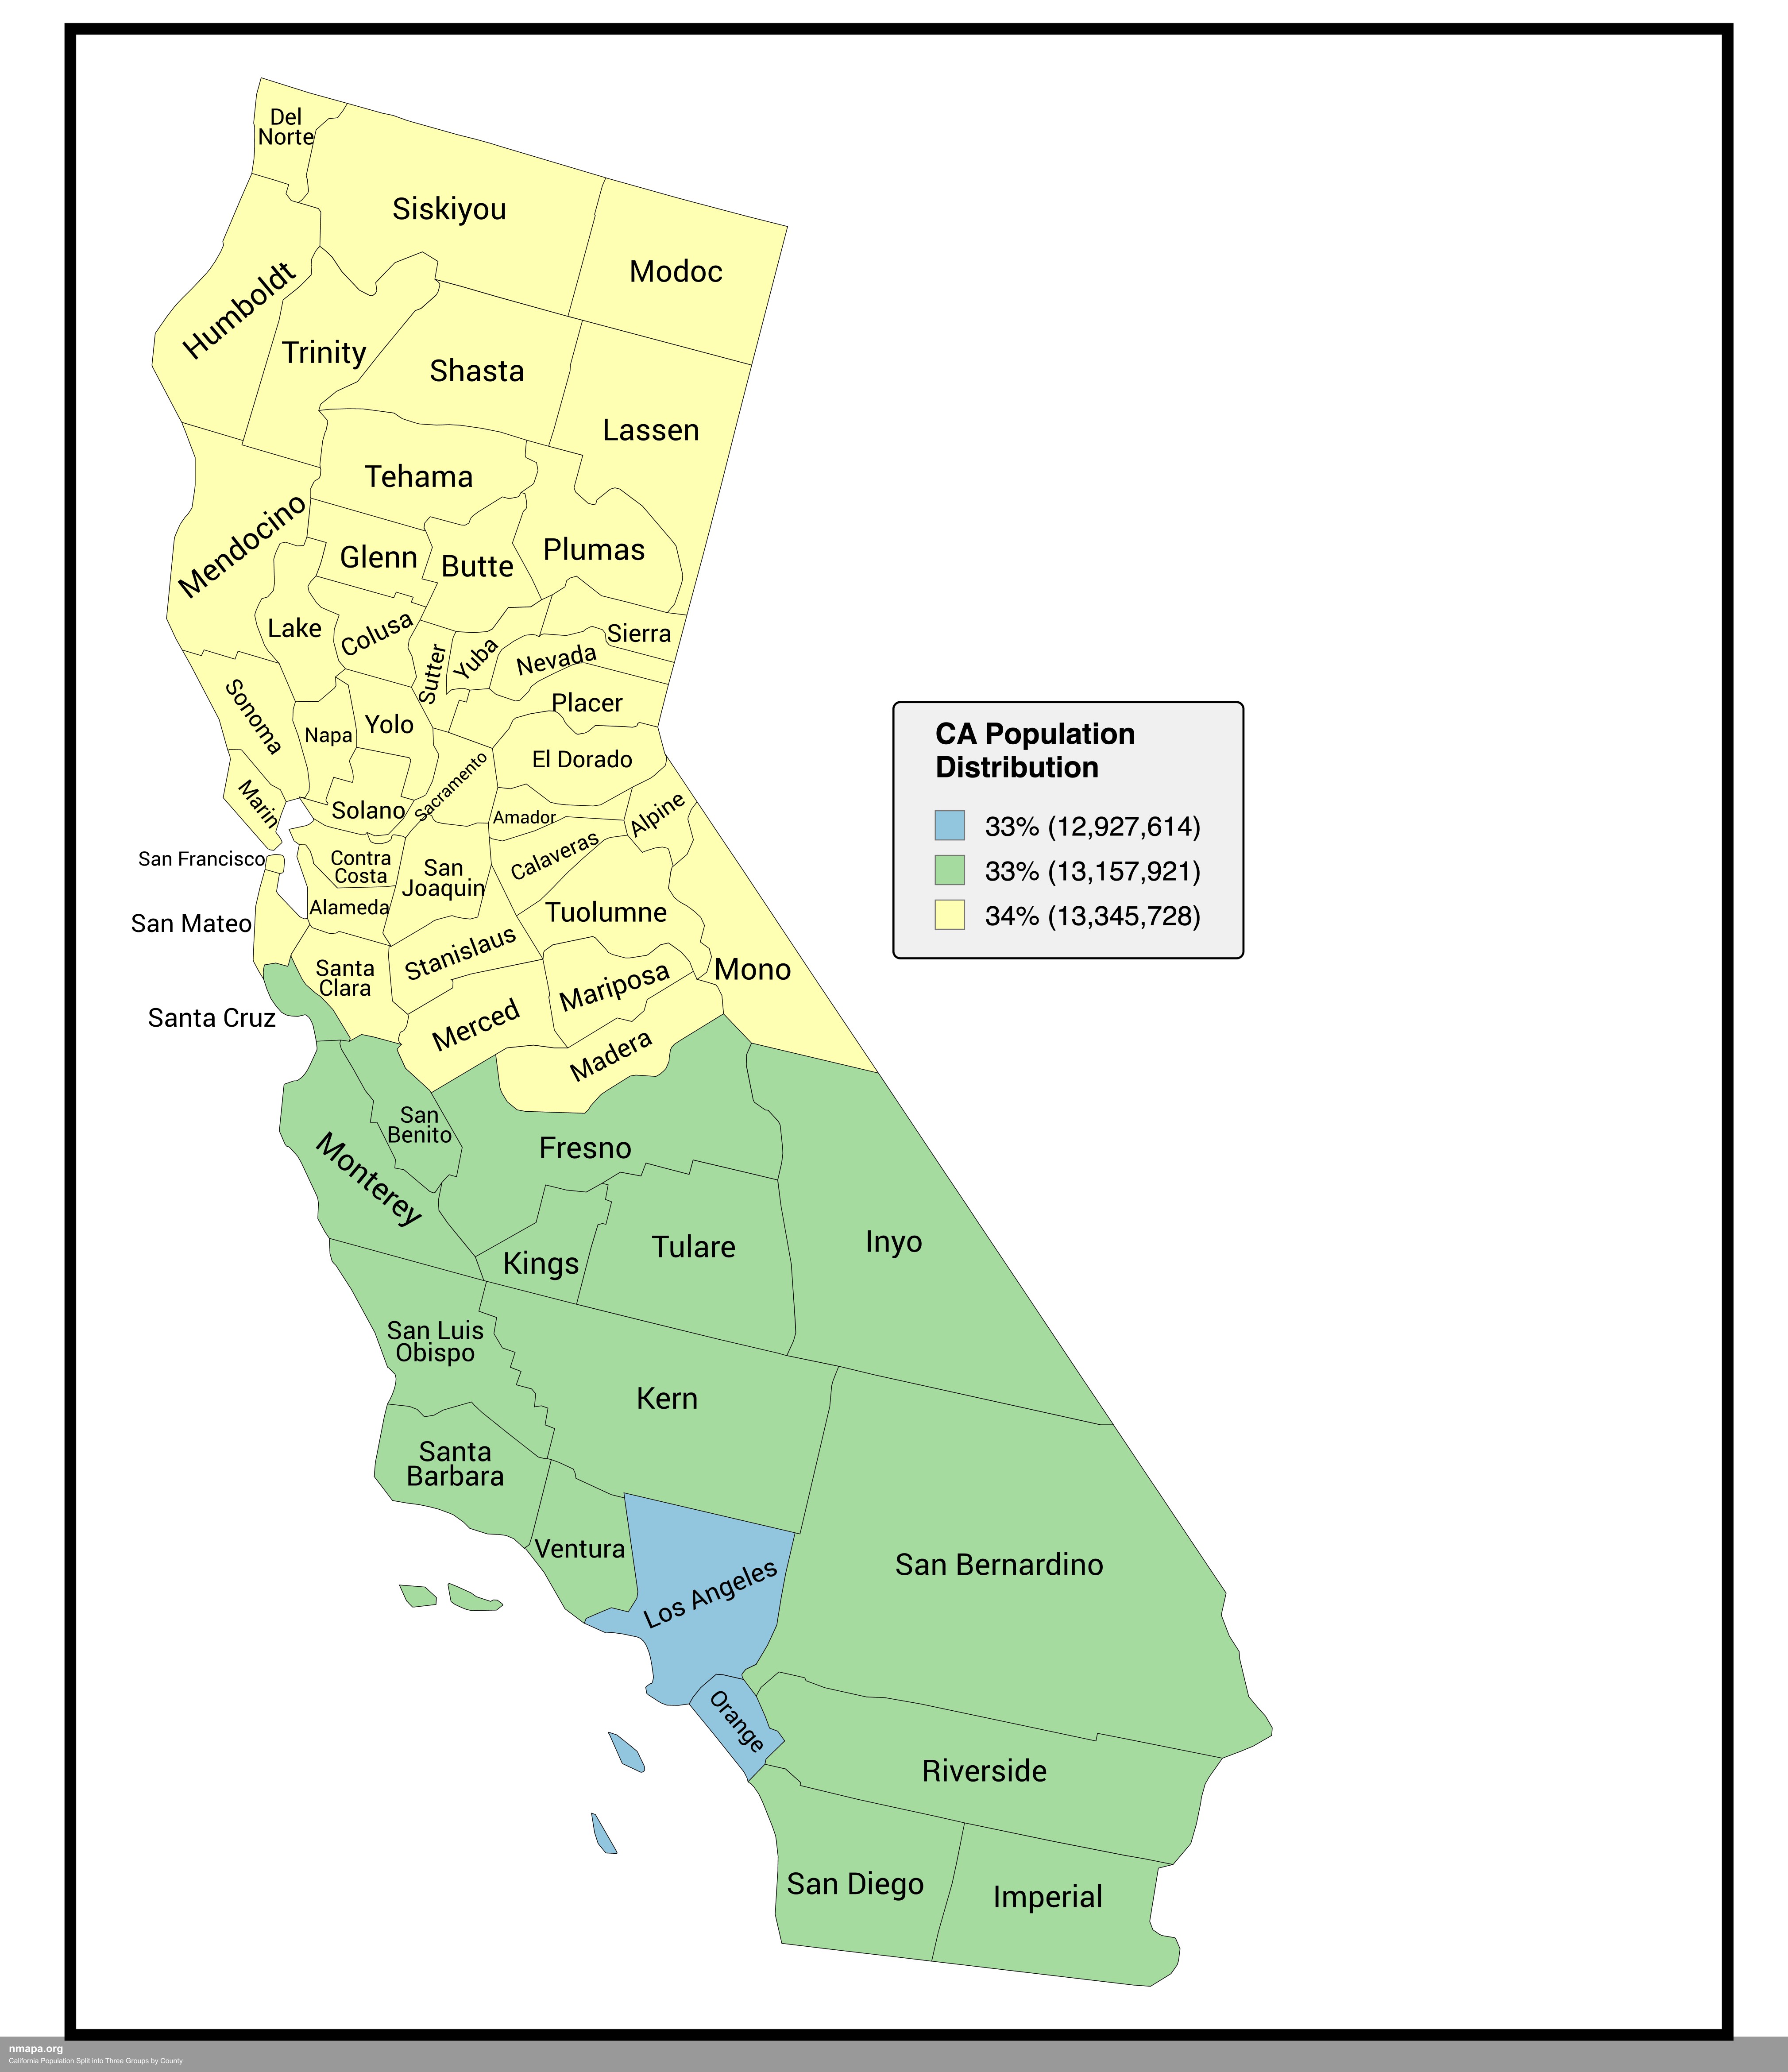
Explore the California Population Map: A County-Level Breakdown
The 'California Population Split into Three Groups by County' map offers a detailed visualization of the demographic lan...
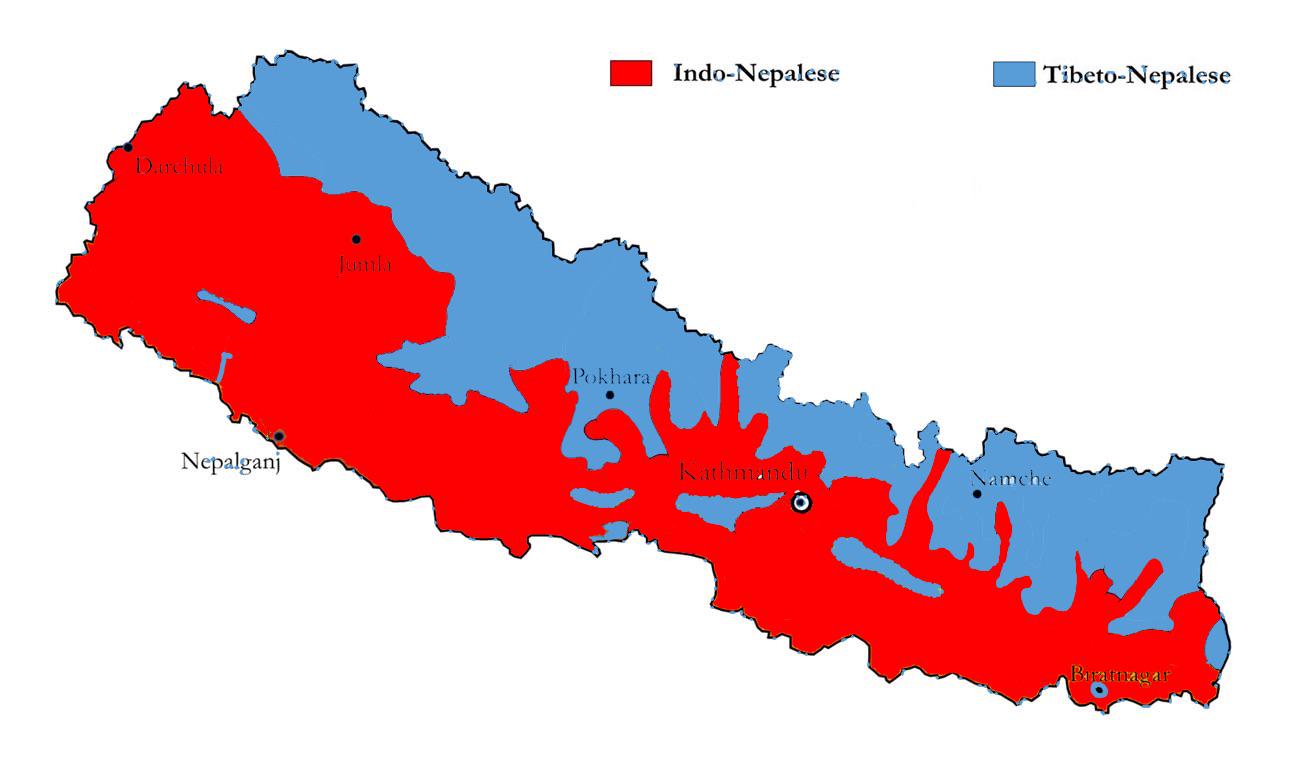
Ethnic Map of Nepal Showing Indo-European and Sino-Tibetan Divide
This ethnic map of Nepal provides a detailed visualization of the demographic divide between Indo-European Nepalese and ...
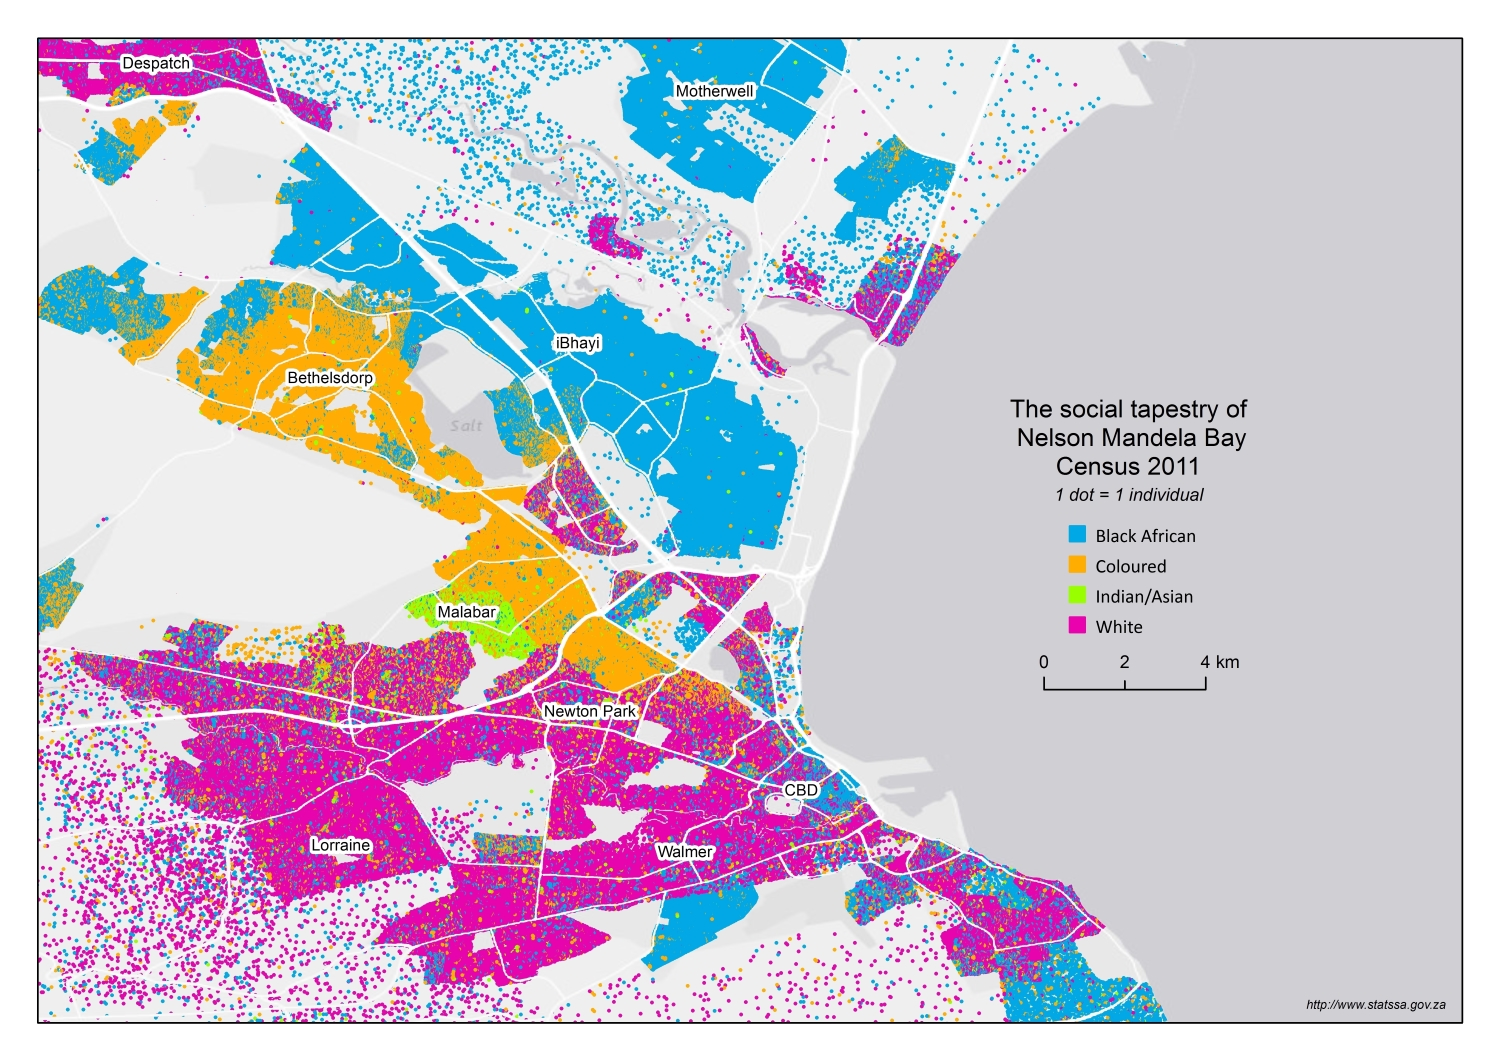
Racial Composition Map of Port Elizabeth
Interestingly, the city's racial demographics echo the complex history of South Africa itself, shaped by colonialism, ap...
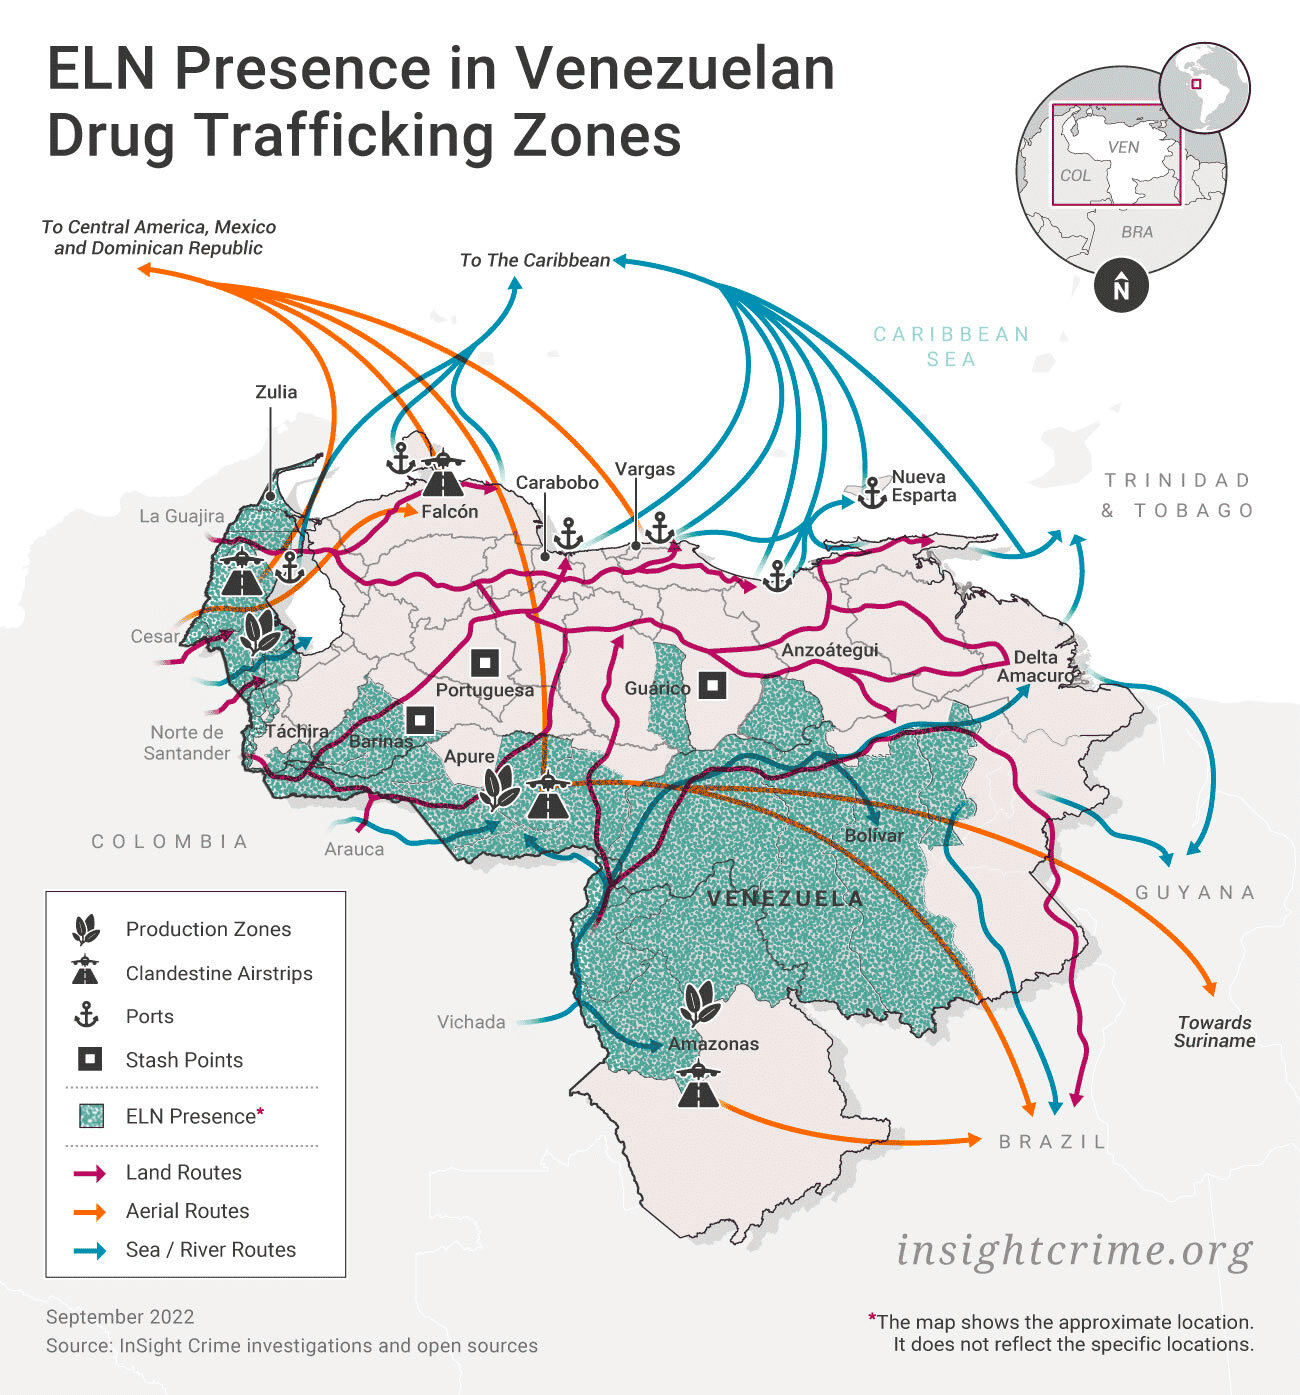
Venezuela Drug Traffic Zones Map
The "Venezuela Drug Traffic Zones Map" provides a stark visual representation of the areas within Venezuela that are hea...
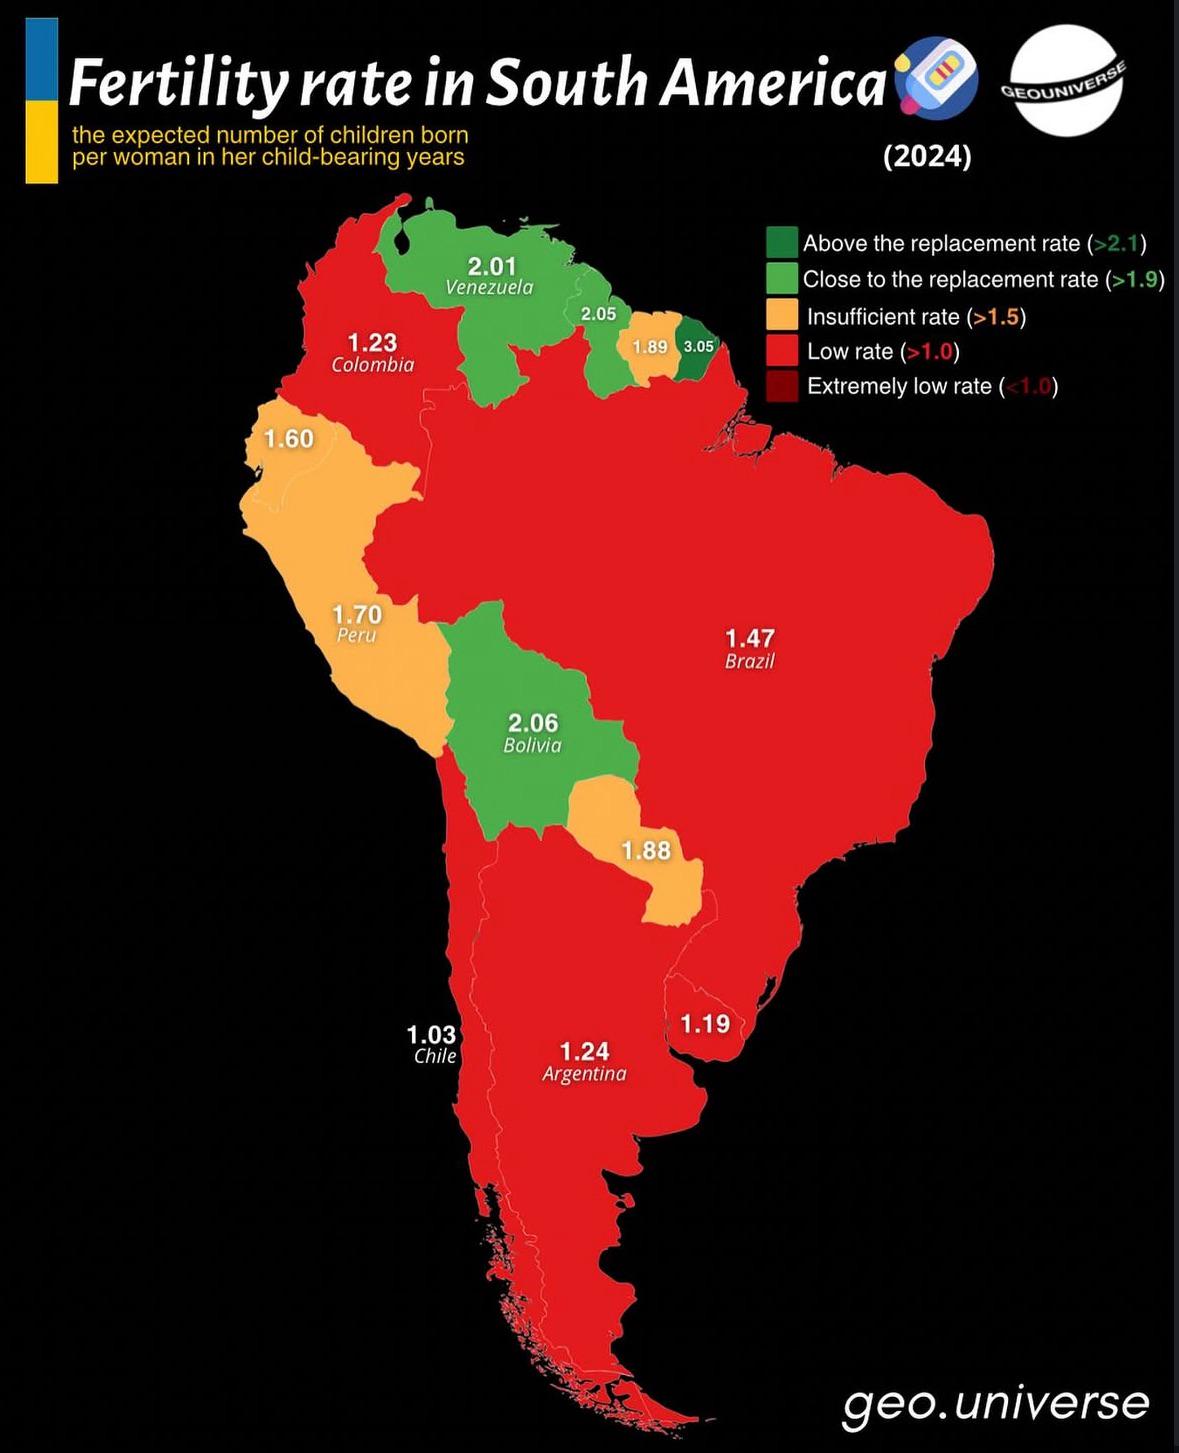
Fertility Rate Map of South America
The "Fertility Rate Map of South America" provides a visual representation of the birth rates across different countries...
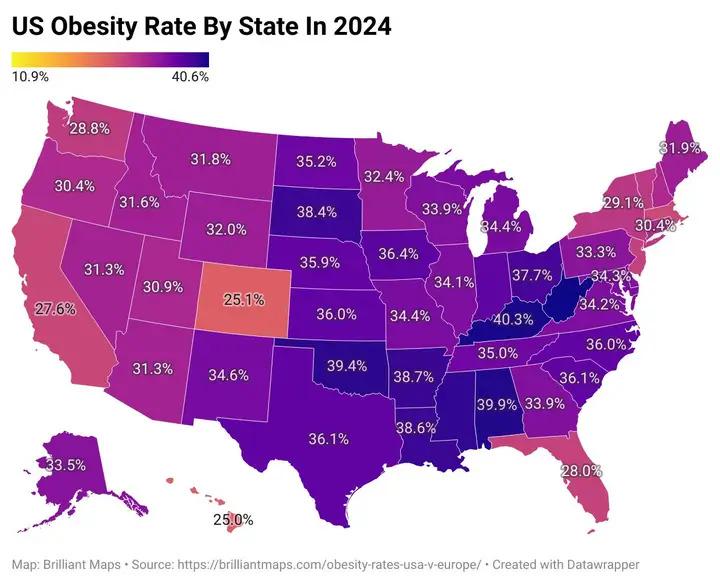
U.S. Obesity Map 2024
The U.S. obesity map for 2024 presents a compelling visual representation of obesity rates across the country. It highli...
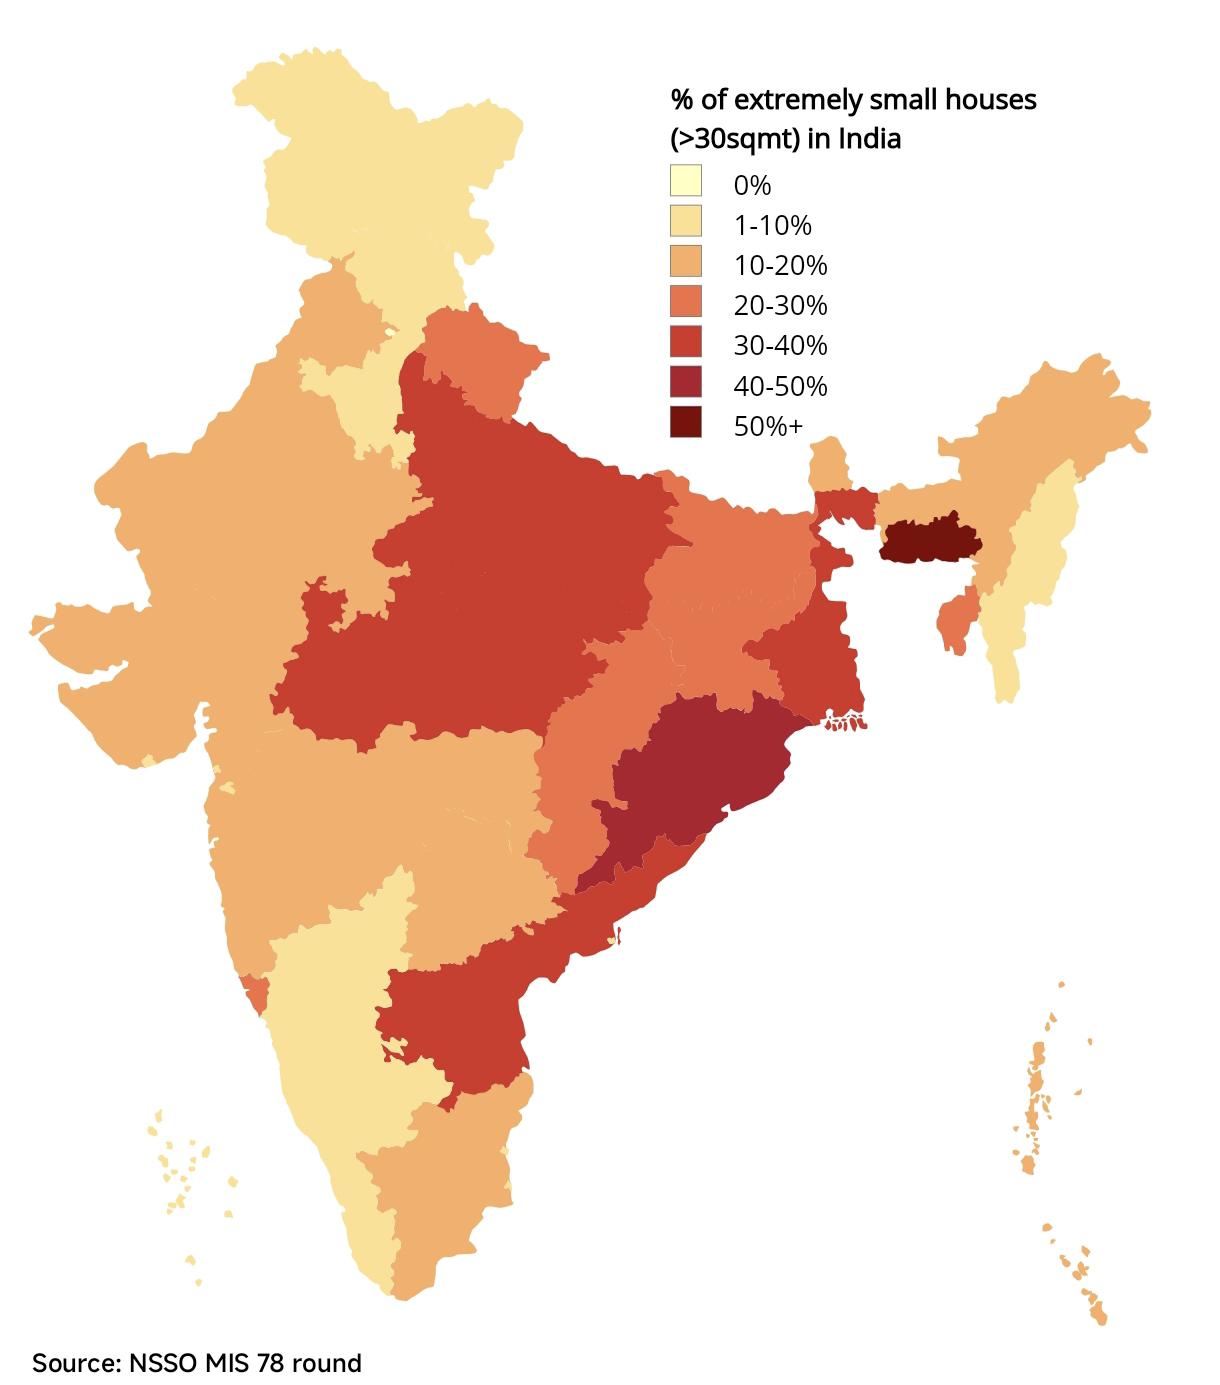
Percentage of Extremely Small Houses in India Map
The map titled "Percentage of Extremely Small Houses in India" visualizes the distribution and prevalence of houses meas...
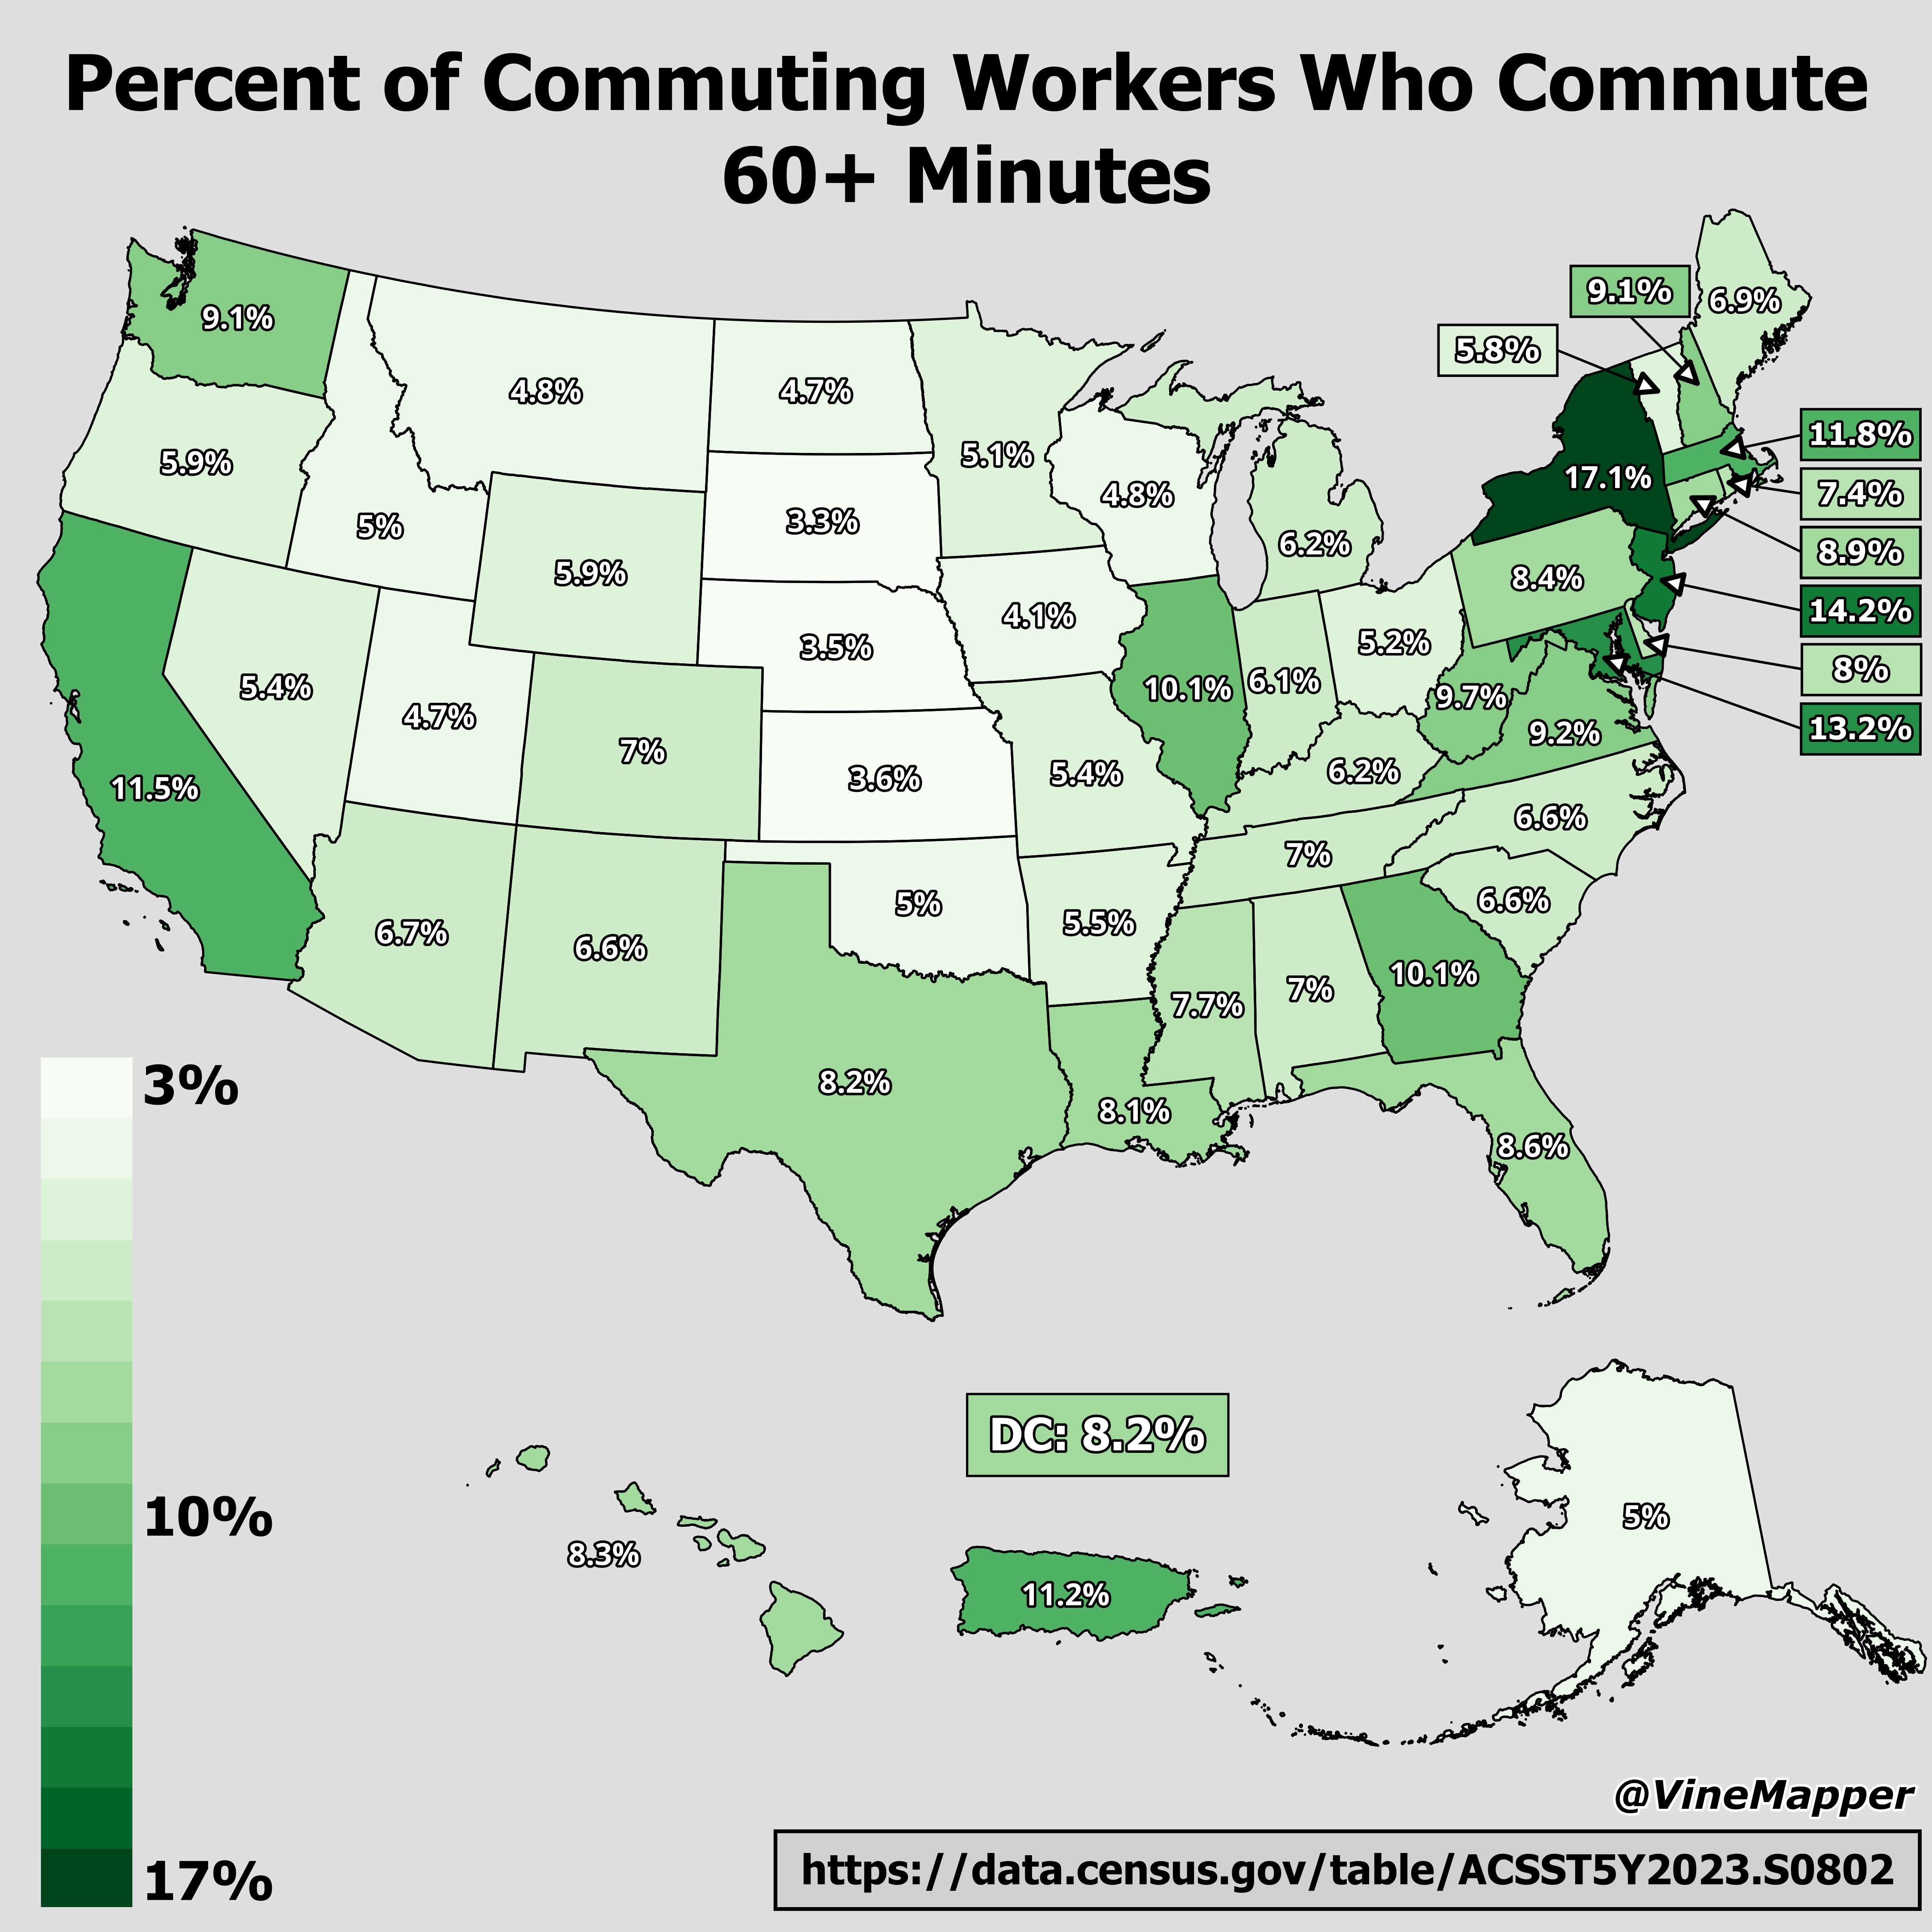
Map of Workers Commuting Over 60 Minutes
Interestingly, long-distance commutes are often linked to housing affordability. Many individuals choose to live in subu...
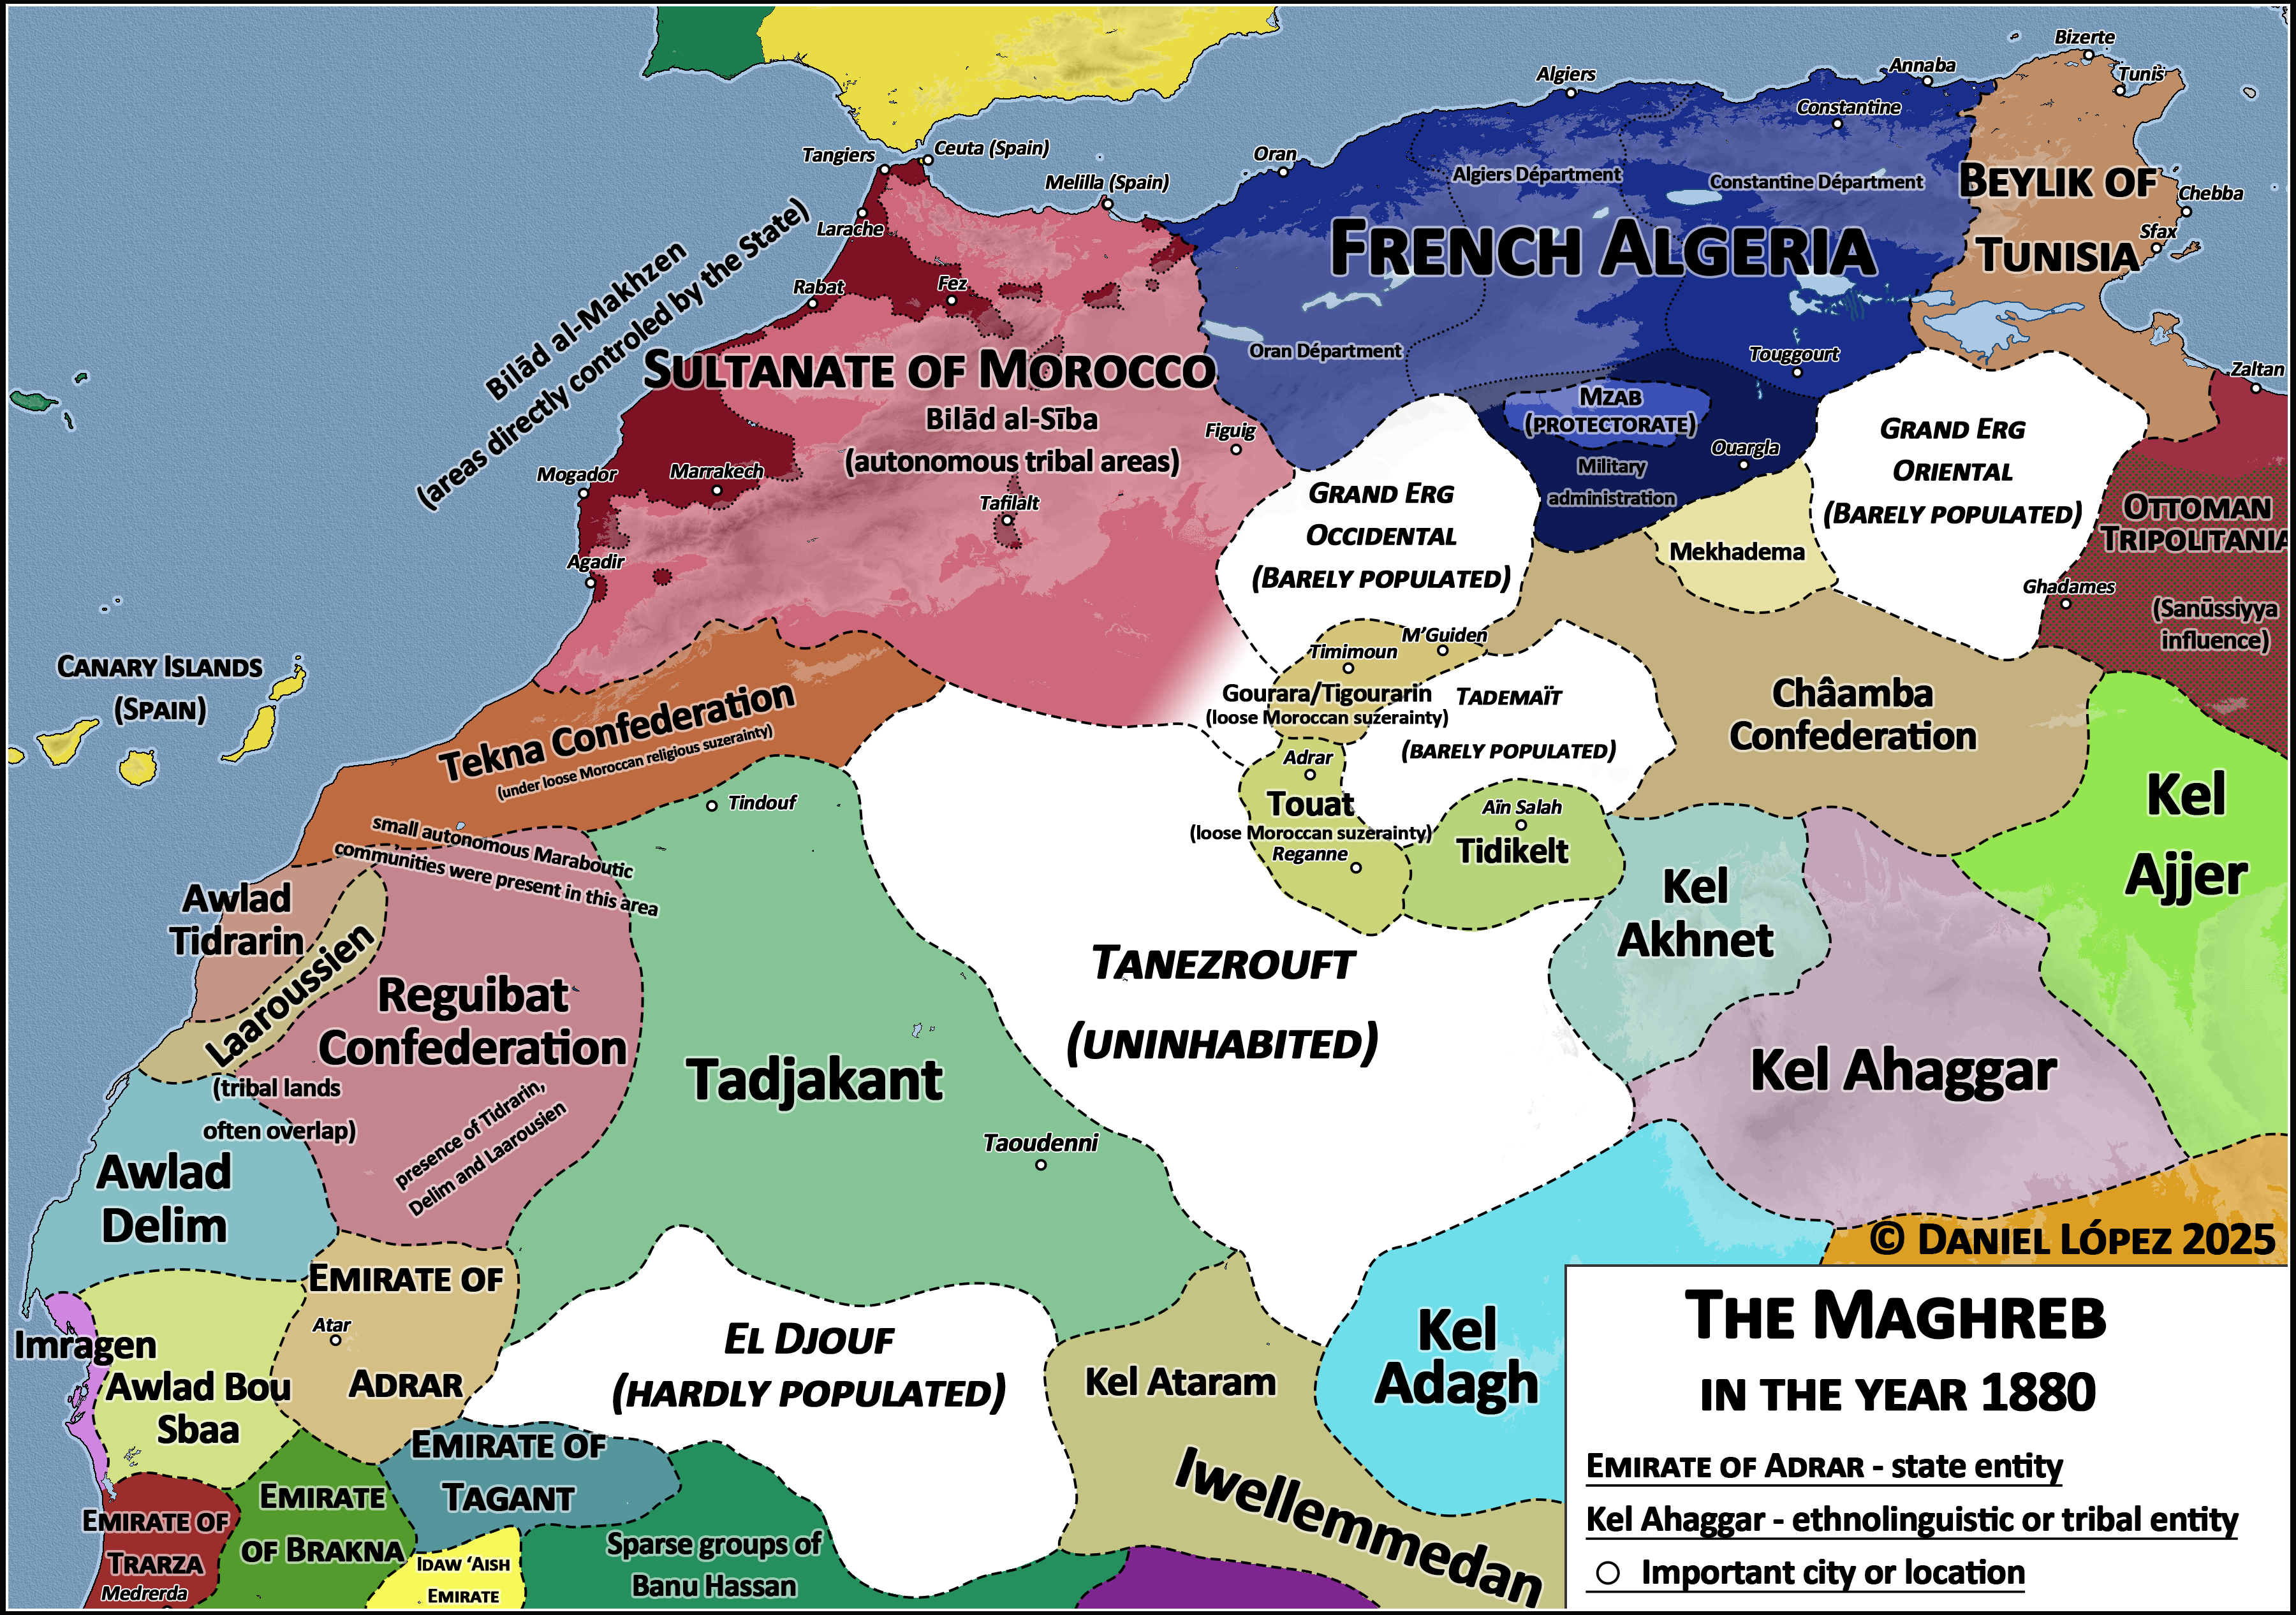
The Maghreb Map in the Year 1880
This map of the Maghreb region in the year 1880 provides a compelling visual representation of North Africa during a tim...
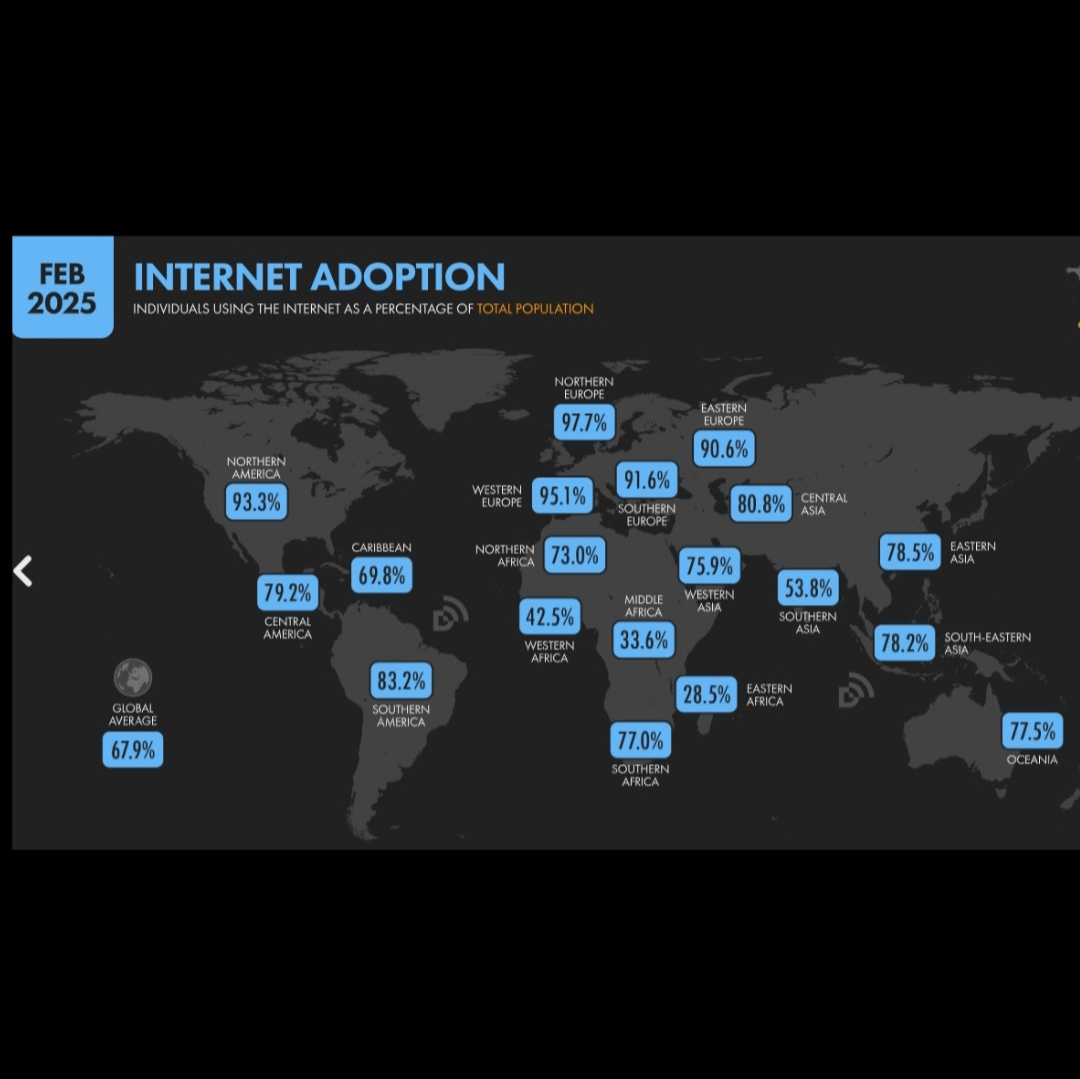
World Internet Access Map by Population
The map titled "Almost 70% of the World Population Has Internet Access" visually represents the global distribution of i...
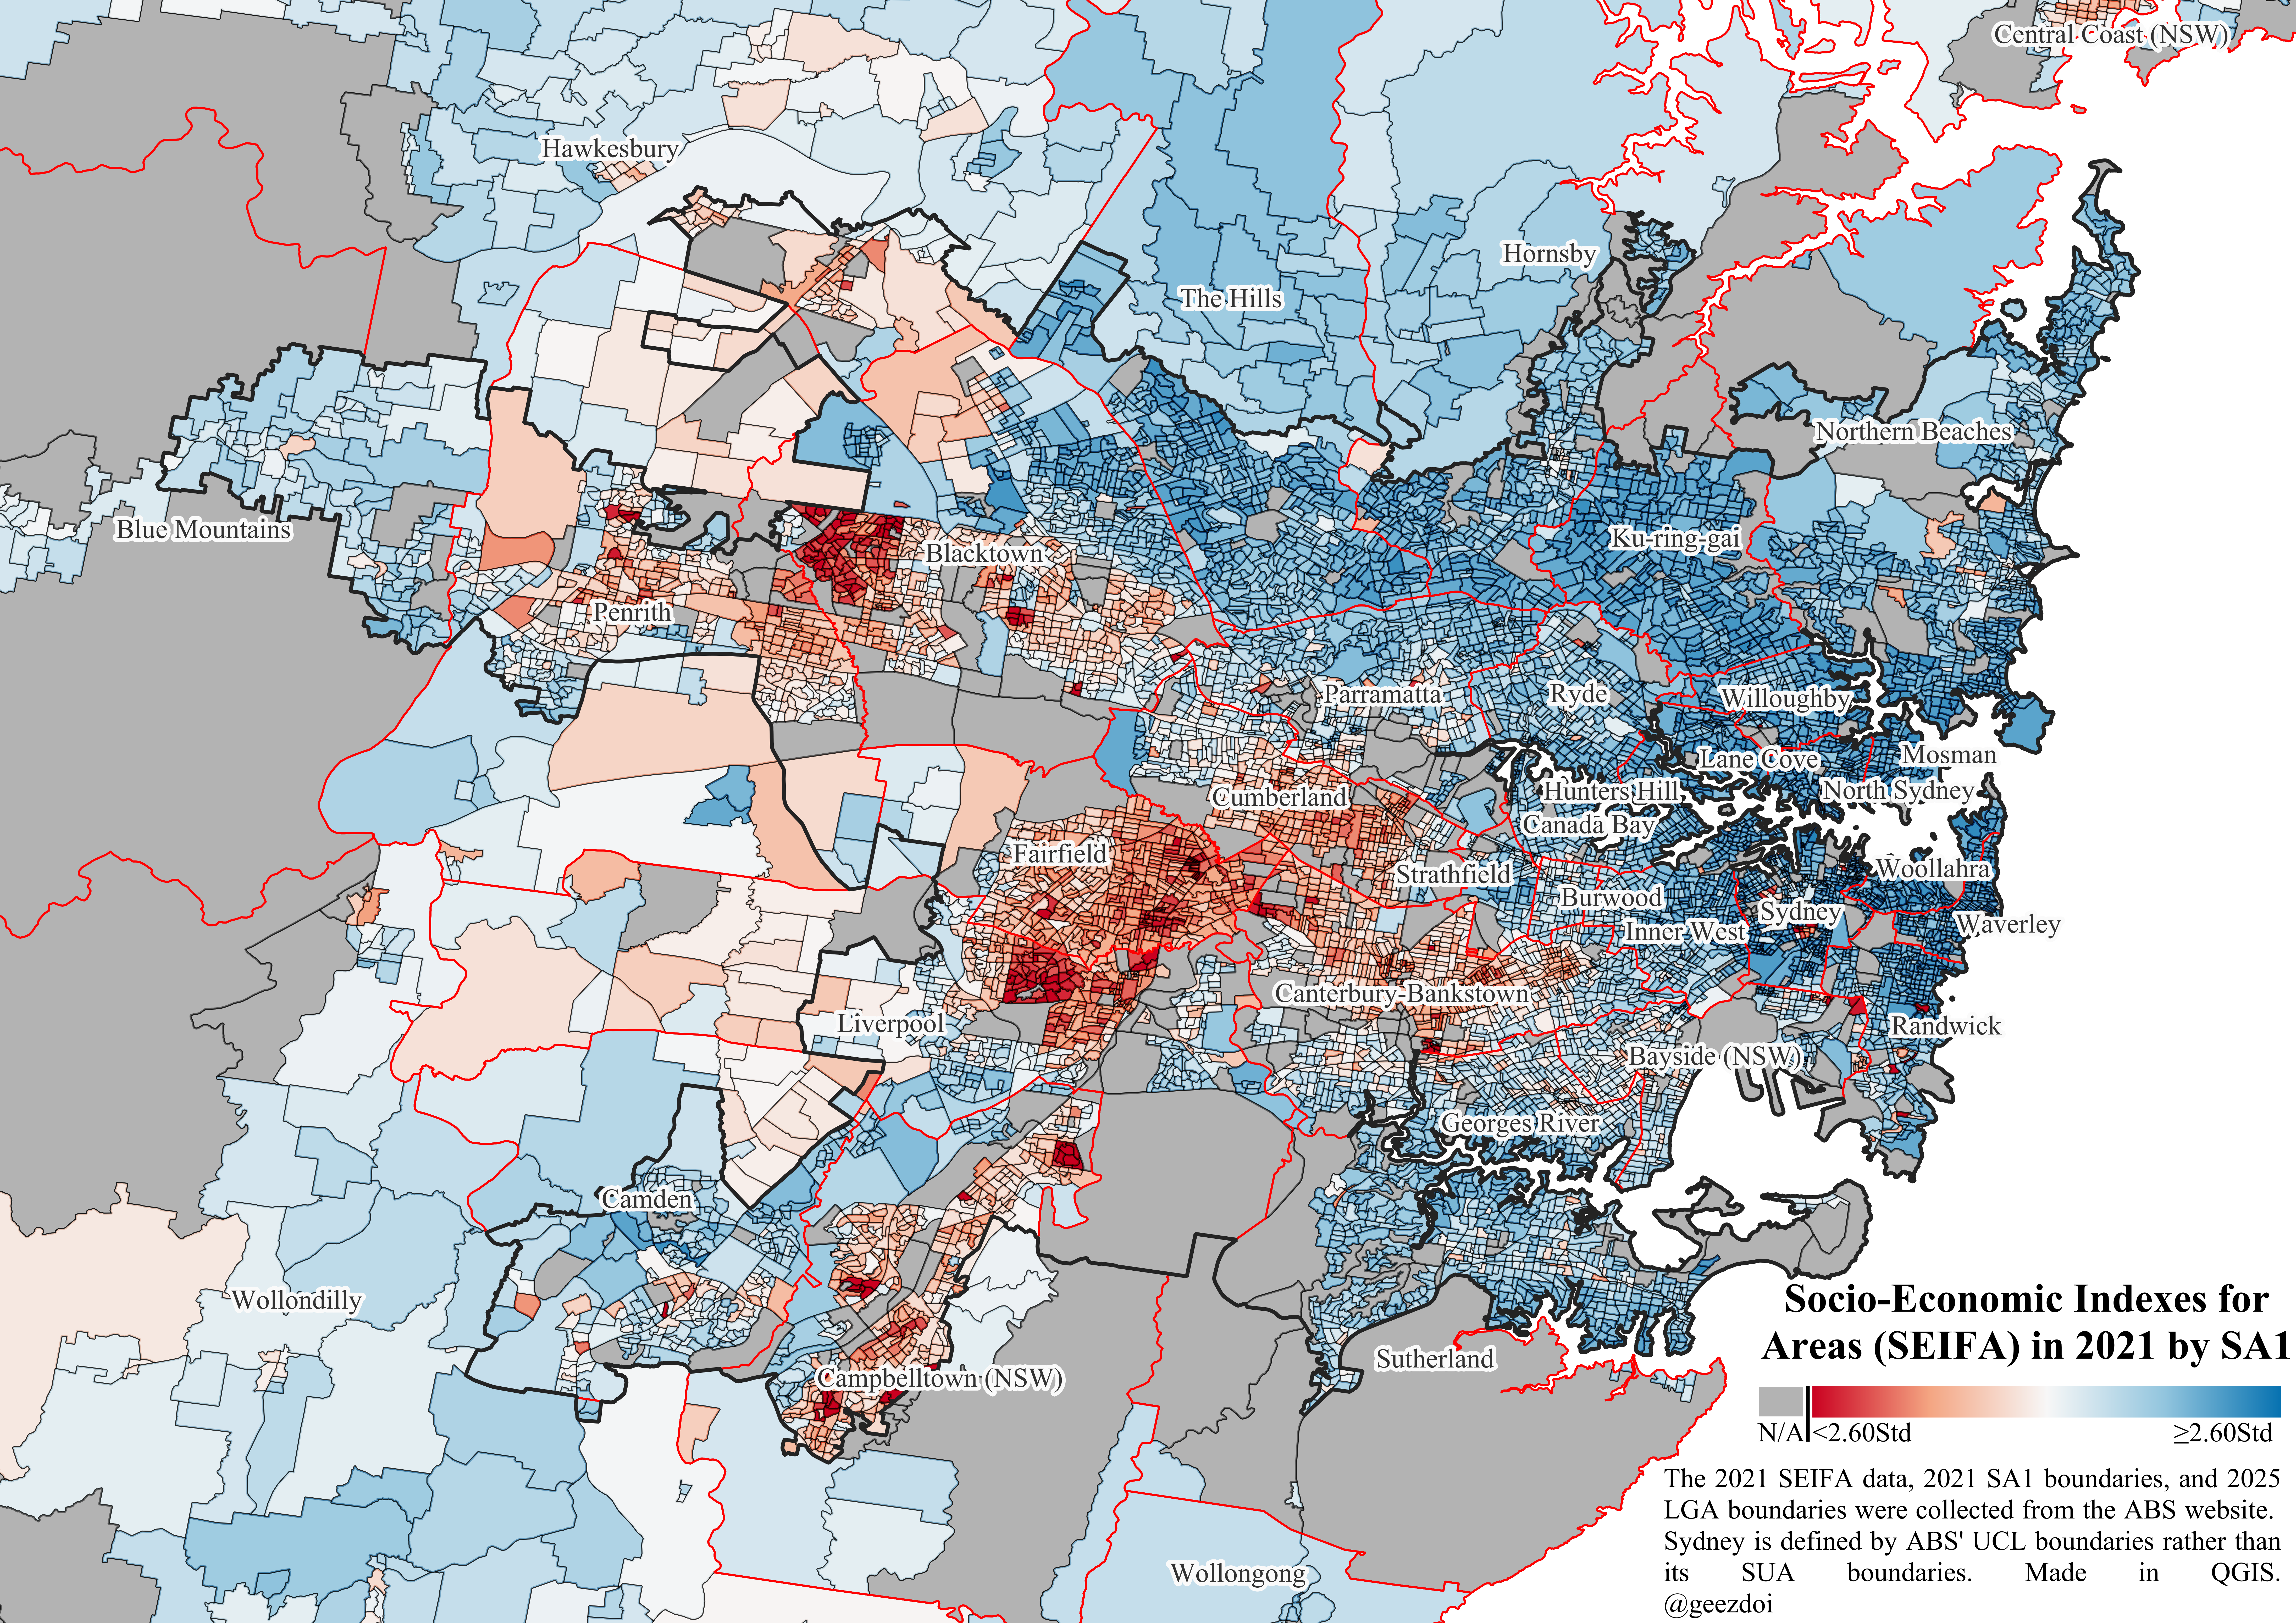
Socio-Economic Advantage and Disadvantage Map of Sydney
The "Map of Relative Socio-Economic Advantage and Disadvantage within Sydney" provides a visual representation of socio-...