U.S. Obesity Map 2024

David Chen
Data Visualization Specialist
David Chen is an expert in transforming complex geographic datasets into compelling visual narratives. He combines his background in computer science ...
Geographic Analysis
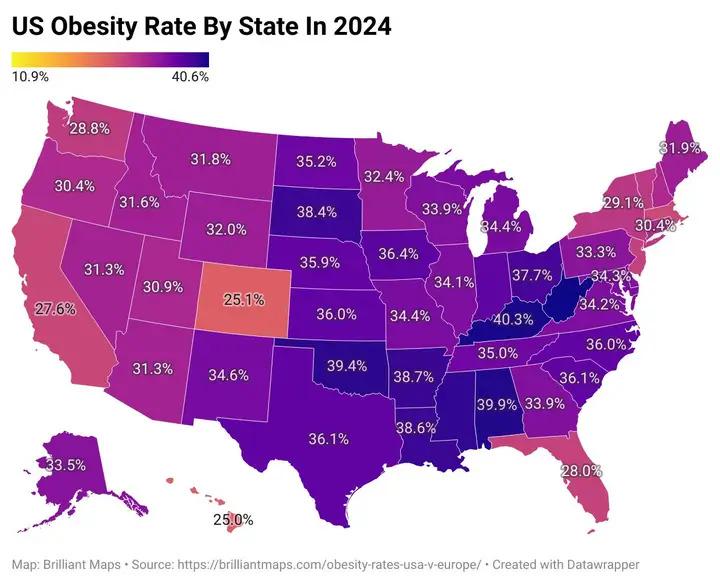
What This Map Shows
The U.S. obesity map for 2024 presents a compelling visual representation of obesity rates across the country. It highlights a pronounced “obesity crescent” that stretches across the Southern and Midwestern regions, where obesity rates exceed 35%. In stark contrast, states in the West and Northeast showcase more favorable health statistics, with obesity rates falling below 30%. This map is not just a collection of statistics; it acts as a window into the complex interplay of history, socio-economic factors, and public health in the United States.
Deep Dive into Obesity in the U.S.
Obesity is defined as having a body mass index (BMI) of 30 or higher, and it has risen to alarming levels in the U.S. over the past few decades. According to the CDC, the adult obesity rate in the U.S. has increased significantly from 30.5% in 1999 to over 42% in 2020. By 2024, these numbers are projected to rise further, particularly in specific regions of the country.
Interestingly, obesity is not merely a matter of individual lifestyle choices; it is deeply rooted in geography and historical context. For example, the Southern states, often characterized by food deserts—areas with limited access to affordable and nutritious food—see some of the highest obesity rates. This phenomenon can be traced back to the agricultural economy that flourished post-slavery, which left a legacy of poverty and limited access to healthy food options for many communities. The availability of cheap, high-calorie foods often makes them more accessible than healthier options.
Moreover, the Midwestern states, often referred to as the Rust Belt, have faced significant economic decline due to deindustrialization. High unemployment and poverty rates in these regions contribute to unhealthy eating habits and sedentary lifestyles, further exacerbating obesity rates. The historical context of these areas creates a unique set of challenges that cannot be overlooked when analyzing this public health crisis.
In contrast, states like Colorado, Oregon, and those in the Northeast, such as Massachusetts and New York, have lower obesity rates, often attributed to higher educational attainment, urbanization, and a culture that promotes outdoor activities. These regions have invested in public health initiatives, infrastructure for physical activity, and access to fresh foods, contributing to healthier lifestyles. Interestingly, the geographic and cultural differences in these areas highlight the importance of understanding obesity as not just a health issue, but as a multifaceted problem influenced by various factors.
Regional Analysis
When we look at the U.S. obesity map, the variations between regions stand out starkly. In the South, states like Louisiana, Mississippi, and Alabama consistently report some of the highest obesity rates, often exceeding 40%. These states face challenges such as limited healthcare access, high poverty levels, and a lack of educational resources that can hinder public health efforts.
Conversely, in the Northeast, states like Vermont and New York boast lower obesity rates, generally in the low 30% range. These states benefit from a combination of better access to healthcare, more robust public health campaigns, and a population that is more engaged in health and fitness. The urban landscape in these areas also provides more opportunities for physical activity, with parks and recreational facilities readily available.
The West showcases a diverse landscape; states like California and Washington not only enjoy lower obesity rates but also have implemented progressive health policies aimed at improving public health outcomes. The emphasis on nutrition education and access to fresh produce has made a significant impact in these regions, highlighting how local policies can shape health outcomes.
Significance and Impact
Understanding the U.S. obesity map is crucial for policymakers, healthcare providers, and the general public. The implications of these obesity rates go beyond individual health; they encompass economic, social, and environmental factors that affect entire communities. Obesity is linked to numerous chronic health issues, including heart disease, diabetes, and certain cancers, which place a significant burden on the healthcare system.
Current trends indicate a worrying trajectory, particularly in the South and Midwest. As obesity rates continue to rise, the need for targeted interventions becomes increasingly urgent. Public health initiatives focused on improving access to healthy foods, promoting physical activity, and addressing socio-economic disparities are essential for reversing this trend.
In conclusion, the U.S. obesity map serves as a vital tool for understanding the geographical and historical context of public health in America. It emphasizes the importance of addressing not only individual behaviors but also the broader socio-economic factors that shape health outcomes. Have you noticed these patterns in your local community? It’s a crucial conversation to have as we work towards a healthier future for all Americans.
Visualization Details
- Published
- October 8, 2025
- Views
- 16
Comments
Loading comments...