Trump Vote Percentage Increase by State Map

Marcus Rodriguez
Historical Geography Expert
Marcus Rodriguez specializes in historical cartography and geographic data analysis. With a background in both history and geography, he brings unique...
Geographic Analysis
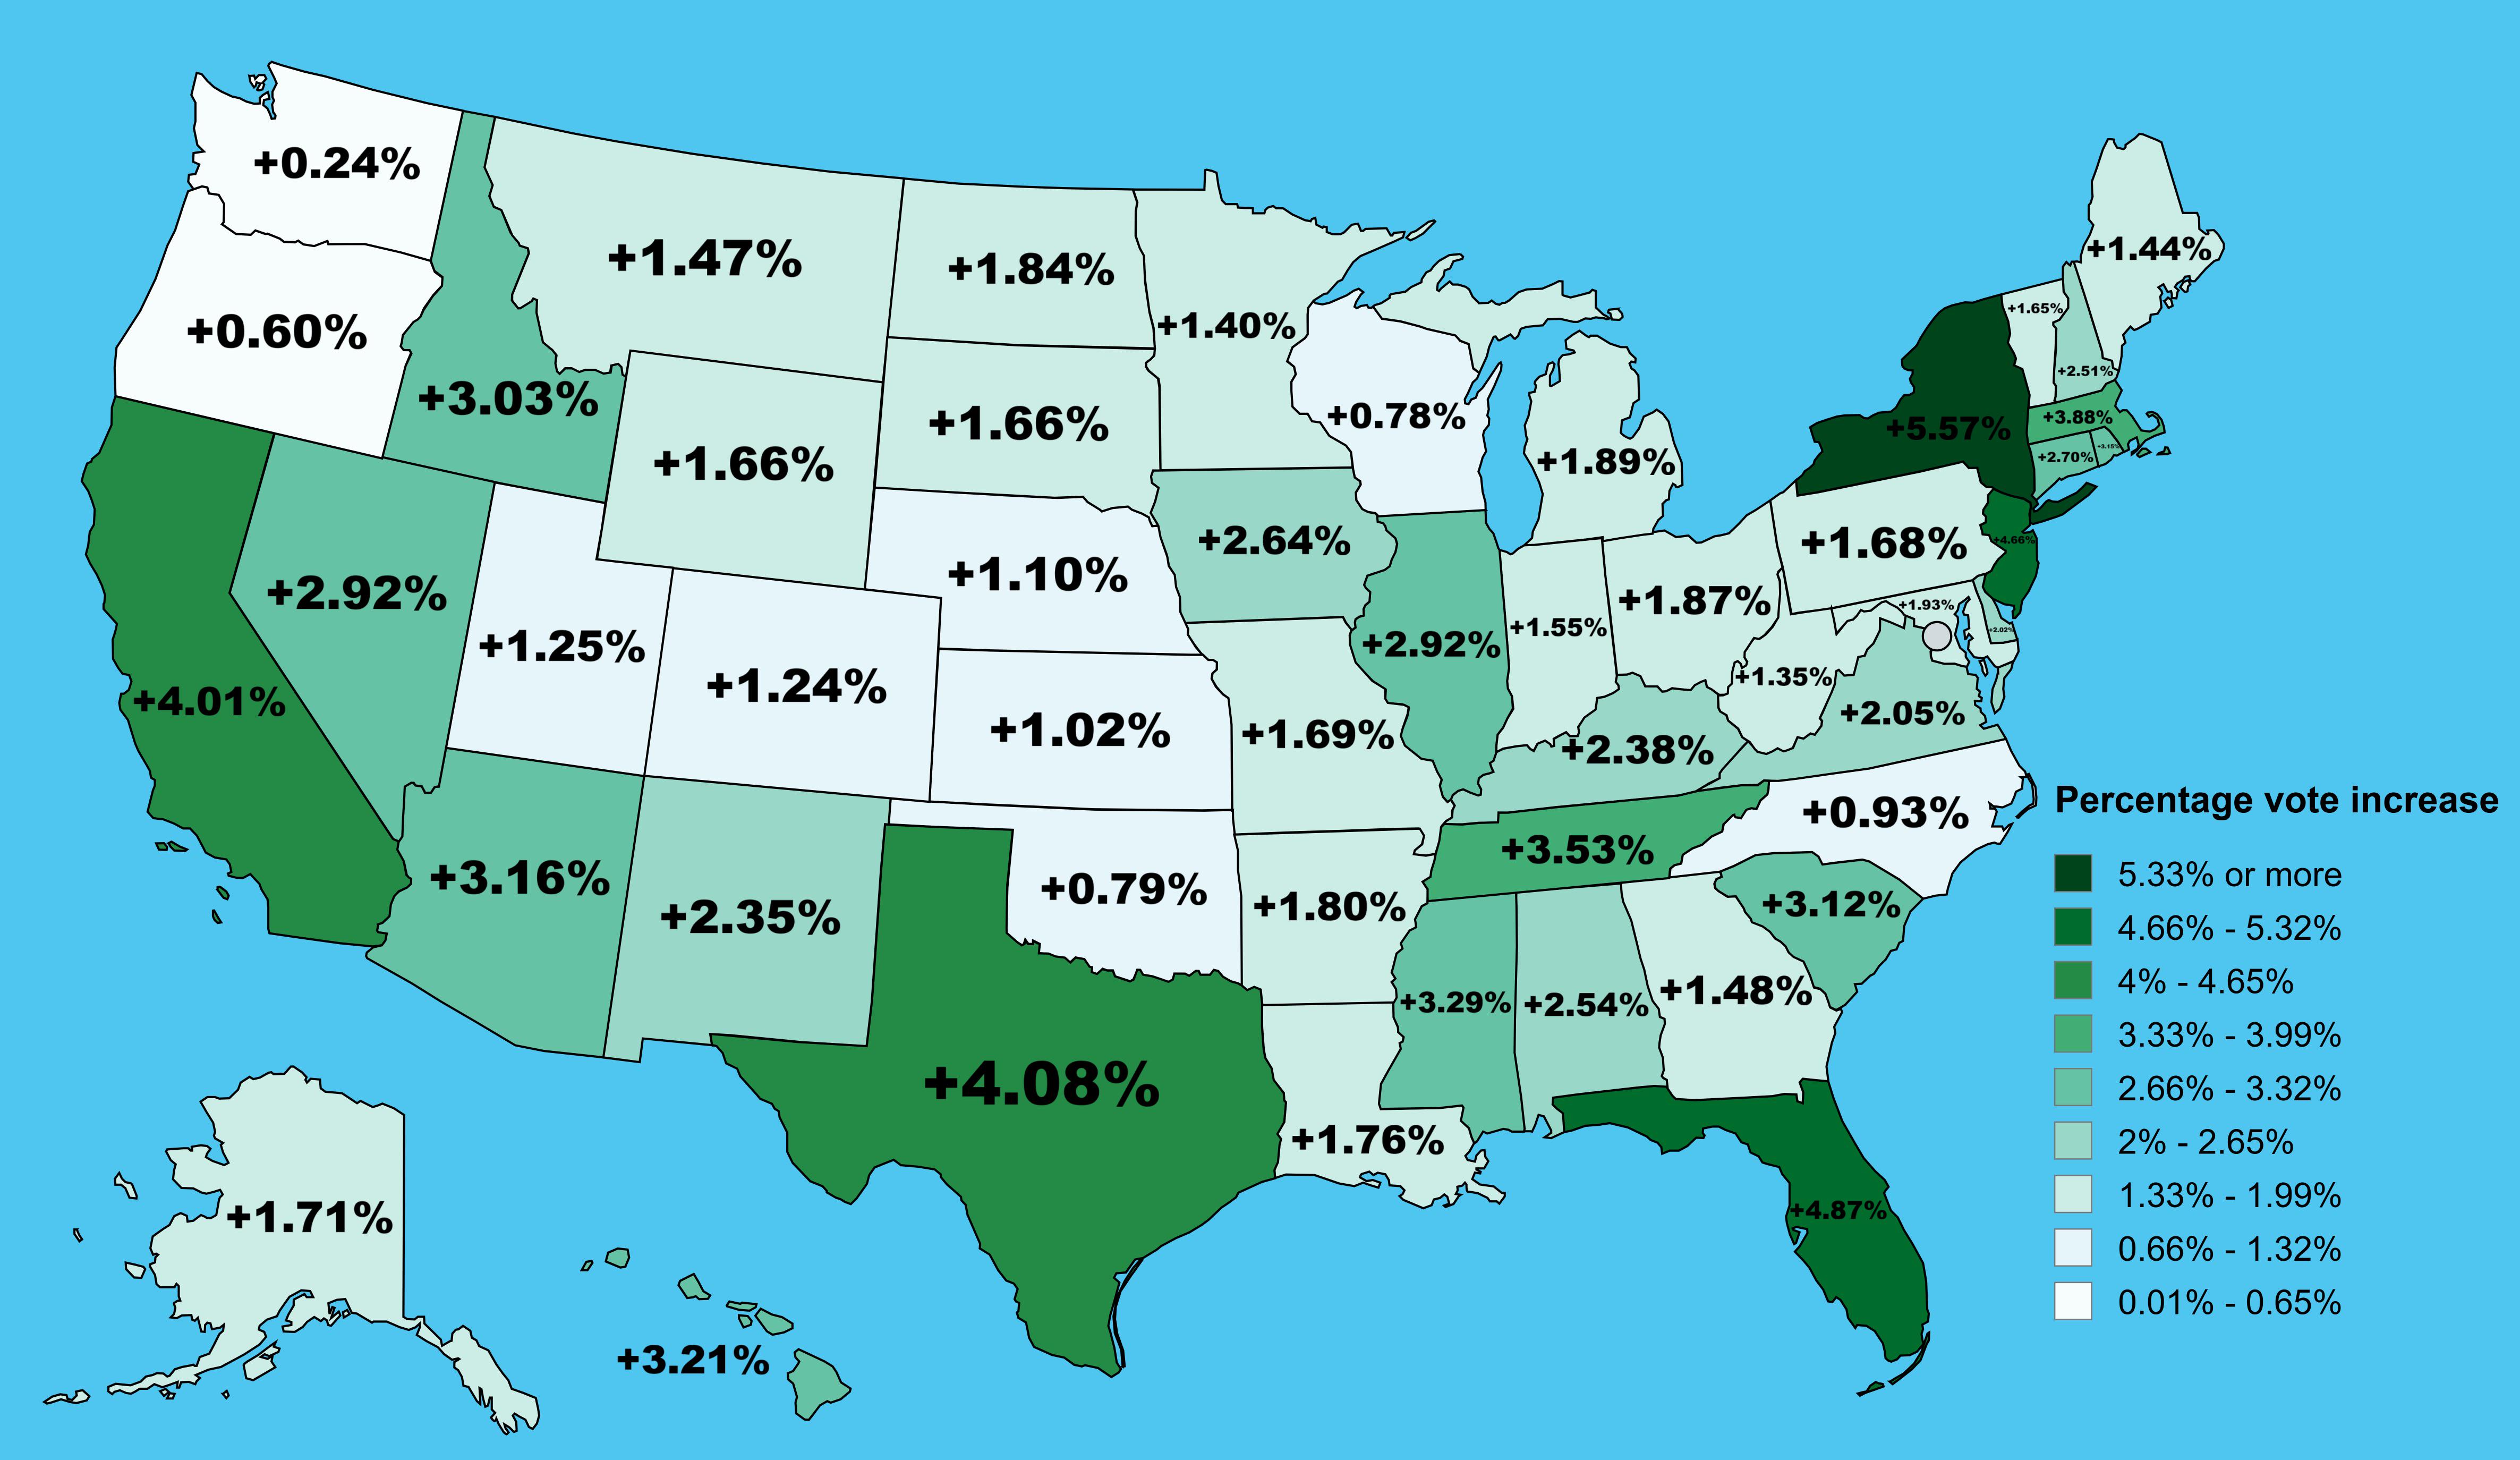
What This Map Shows
This map illustrates the percentage increase in vote percentage for Donald Trump from the 2020 to the 2024 presidential election across all 50 U.S. states. By visually representing this data, we can glean insights into the shifting political landscape of the country. The fluctuations in Trump’s support can serve as a reflection of various sociopolitical factors, demographics, and regional sentiments that influence voter behavior. This visualization allows us to identify which states have shown significant increases in support for Trump and potentially highlights emerging political trends.
Deep Dive into Voting Trends
Voting trends in the United States are not just numbers; they are a narrative of the collective sentiments of various communities. To understand why there might be a percentage increase in Trump’s vote in certain states, we need to consider factors such as economic conditions, demographic shifts, and key issues that resonate with voters.
For instance, states like Texas and Florida have seen considerable growth in Republican support, reflecting a combination of economic prosperity and demographic changes. Interestingly, Florida is notable for its diverse population, which includes a significant number of Hispanic voters. Here, Trump’s messaging around economic opportunity and immigration may have resonated more than in previous elections.
Moreover, the rise of the suburban voter is another factor influencing these trends. Suburban areas, once considered a stronghold for Democrats, have shown a shift towards Republican candidates, with Trump benefitting from this trend. A 2021 survey by the Pew Research Center indicated that issues like public safety and economic recovery post-COVID-19 played a significant role in changing suburban voters' preferences.
What’s fascinating is that while some traditionally blue states have shown increases in support for Trump, it’s the rural areas that overwhelmingly contribute to his vote percentage. The cultural divide between urban and rural communities continues to be a significant factor in American politics. In rural regions, issues such as gun rights, energy policies, and agricultural concerns have a profound impact on voting behavior.
Additionally, social media and targeted campaigning have transformed how candidates engage with voters. The 2024 election cycle has seen an increased focus on digital outreach, particularly among younger voters and minority groups, which could also influence voting patterns.
Regional Analysis
Analyzing the data regionally reveals some compelling contrasts. For instance, in the South, states such as Alabama and South Carolina have shown significant increases in Trump’s vote percentage, largely due to their strong conservative bases. These states have aligned closely with Trump’s policies on issues like taxation and social conservatism, reinforcing the Republican stronghold in this region.
In contrast, the Midwest presents a nuanced picture. States like Ohio have historically leaned Republican, yet the increase in vote percentage indicates a solidification of Trump’s support amidst ongoing economic changes in manufacturing and agriculture. However, neighboring states like Michigan have diverged, reflecting a more competitive political landscape where Democrats are still vying for a stronghold.
In the Northeast, states like Pennsylvania and New Hampshire are worth noting. While they have traditionally leaned Democratic, the percentage increases in Trump’s votes suggest a growing discontent with the incumbent policies, particularly in the wake of economic challenges and public health crises. This shift can lead to interesting dynamics in future elections as both parties adjust their strategies to appeal to these changing voter bases.
Significance and Impact
Understanding the percentage increase in Trump’s vote across states is crucial for several reasons. Firstly, it allows analysts and political strategists to gauge the pulse of the electorate, providing insights into the issues that matter most to voters. As we look towards future elections, these trends will undoubtedly shape campaign strategies and party platforms.
Moreover, this data is significant in understanding the broader implications for American democracy. Ever wondered why voter turnout varies so much from one election to the next? The factors influencing these trends—economic conditions, social issues, and demographic shifts—are complex and interwoven, making the study of voting patterns essential for grasping the dynamics of American politics.
As we approach the 2024 elections, keeping a close eye on these trends will help us forecast electoral outcomes and understand the evolving landscape of American political allegiance. The increase in Trump’s vote percentage in various states may signal not only a consolidation of his base but also a potential resurgence of Republican influence in regions previously thought to be slipping away.
Ultimately, this map is more than just data; it encapsulates the voices of millions of Americans and the ongoing dialogue about their hopes, concerns, and aspirations for the future of their country. As we navigate this complex political terrain, the insights derived from such visualizations will be critical in shaping our understanding of American democracy moving forward.
Visualization Details
- Published
- October 25, 2025
- Views
- 12
Comments
Loading comments...