voting trends Maps
5 geographic visualizations tagged with "voting trends"
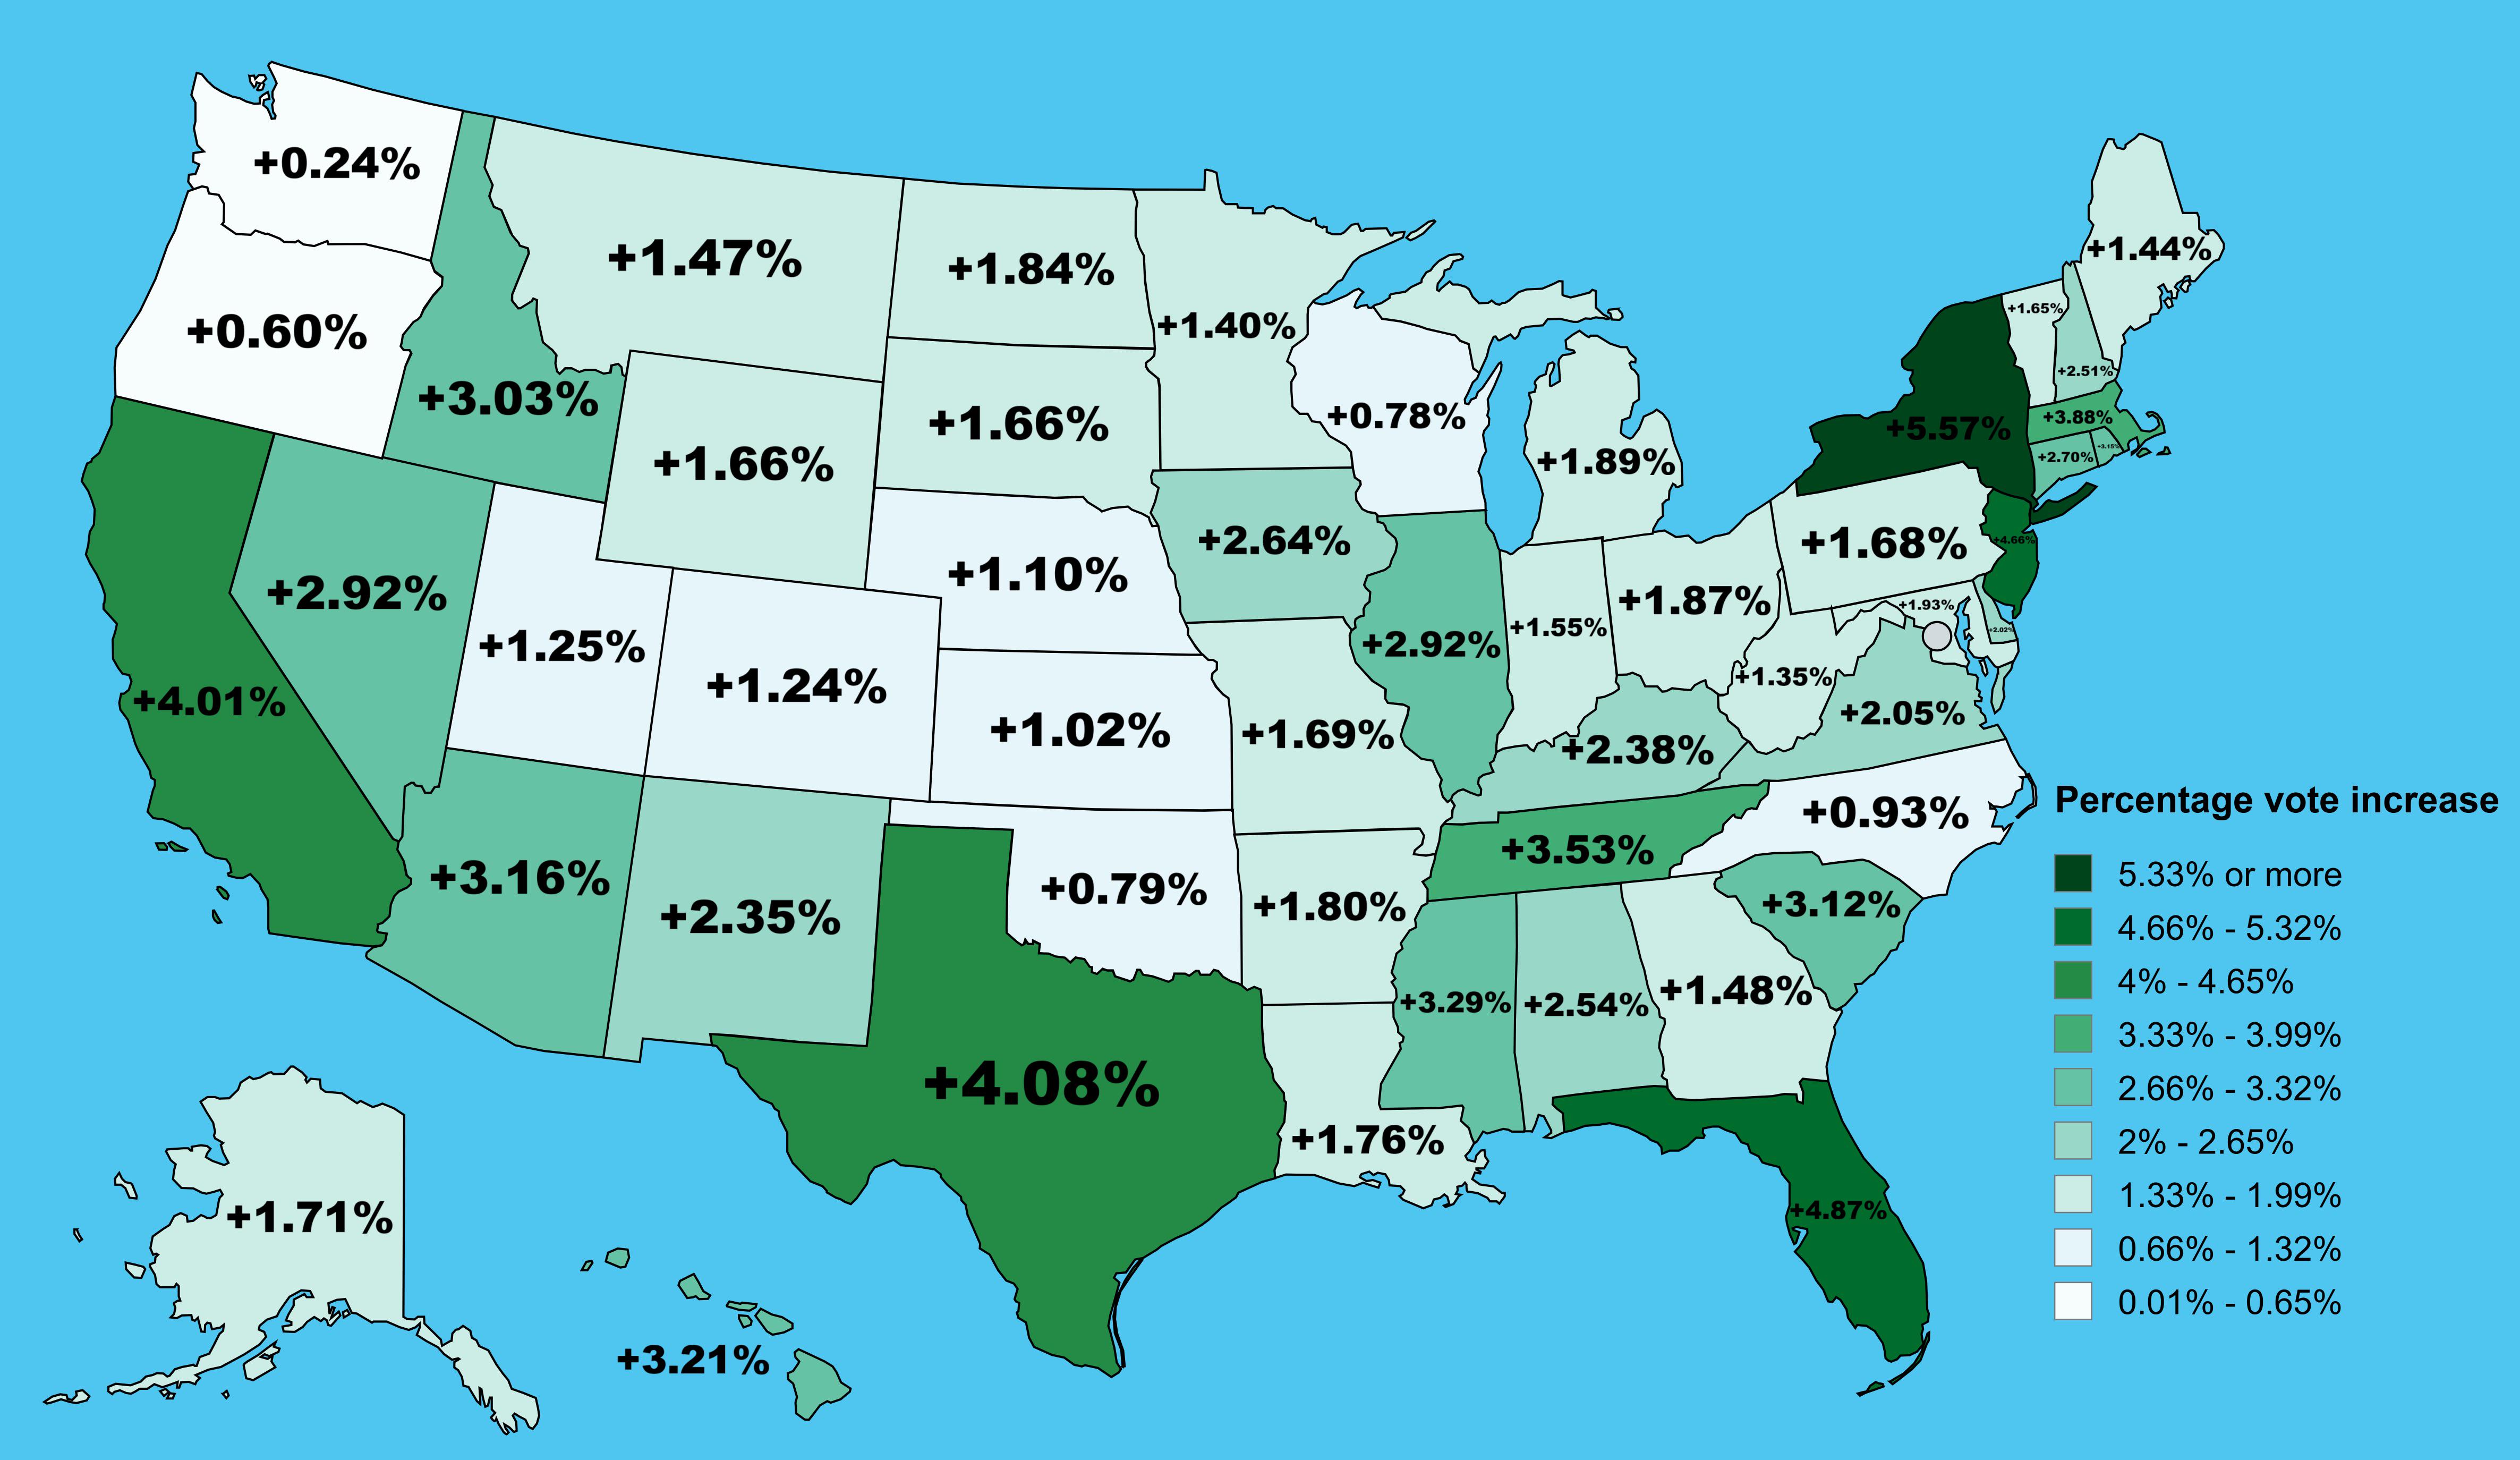
Trump Vote Percentage Increase by State Map
This map illustrates the percentage increase in vote percentage for Donald Trump from the 2020 to the 2024 presidential ...
👁 12📅 10/25/2025
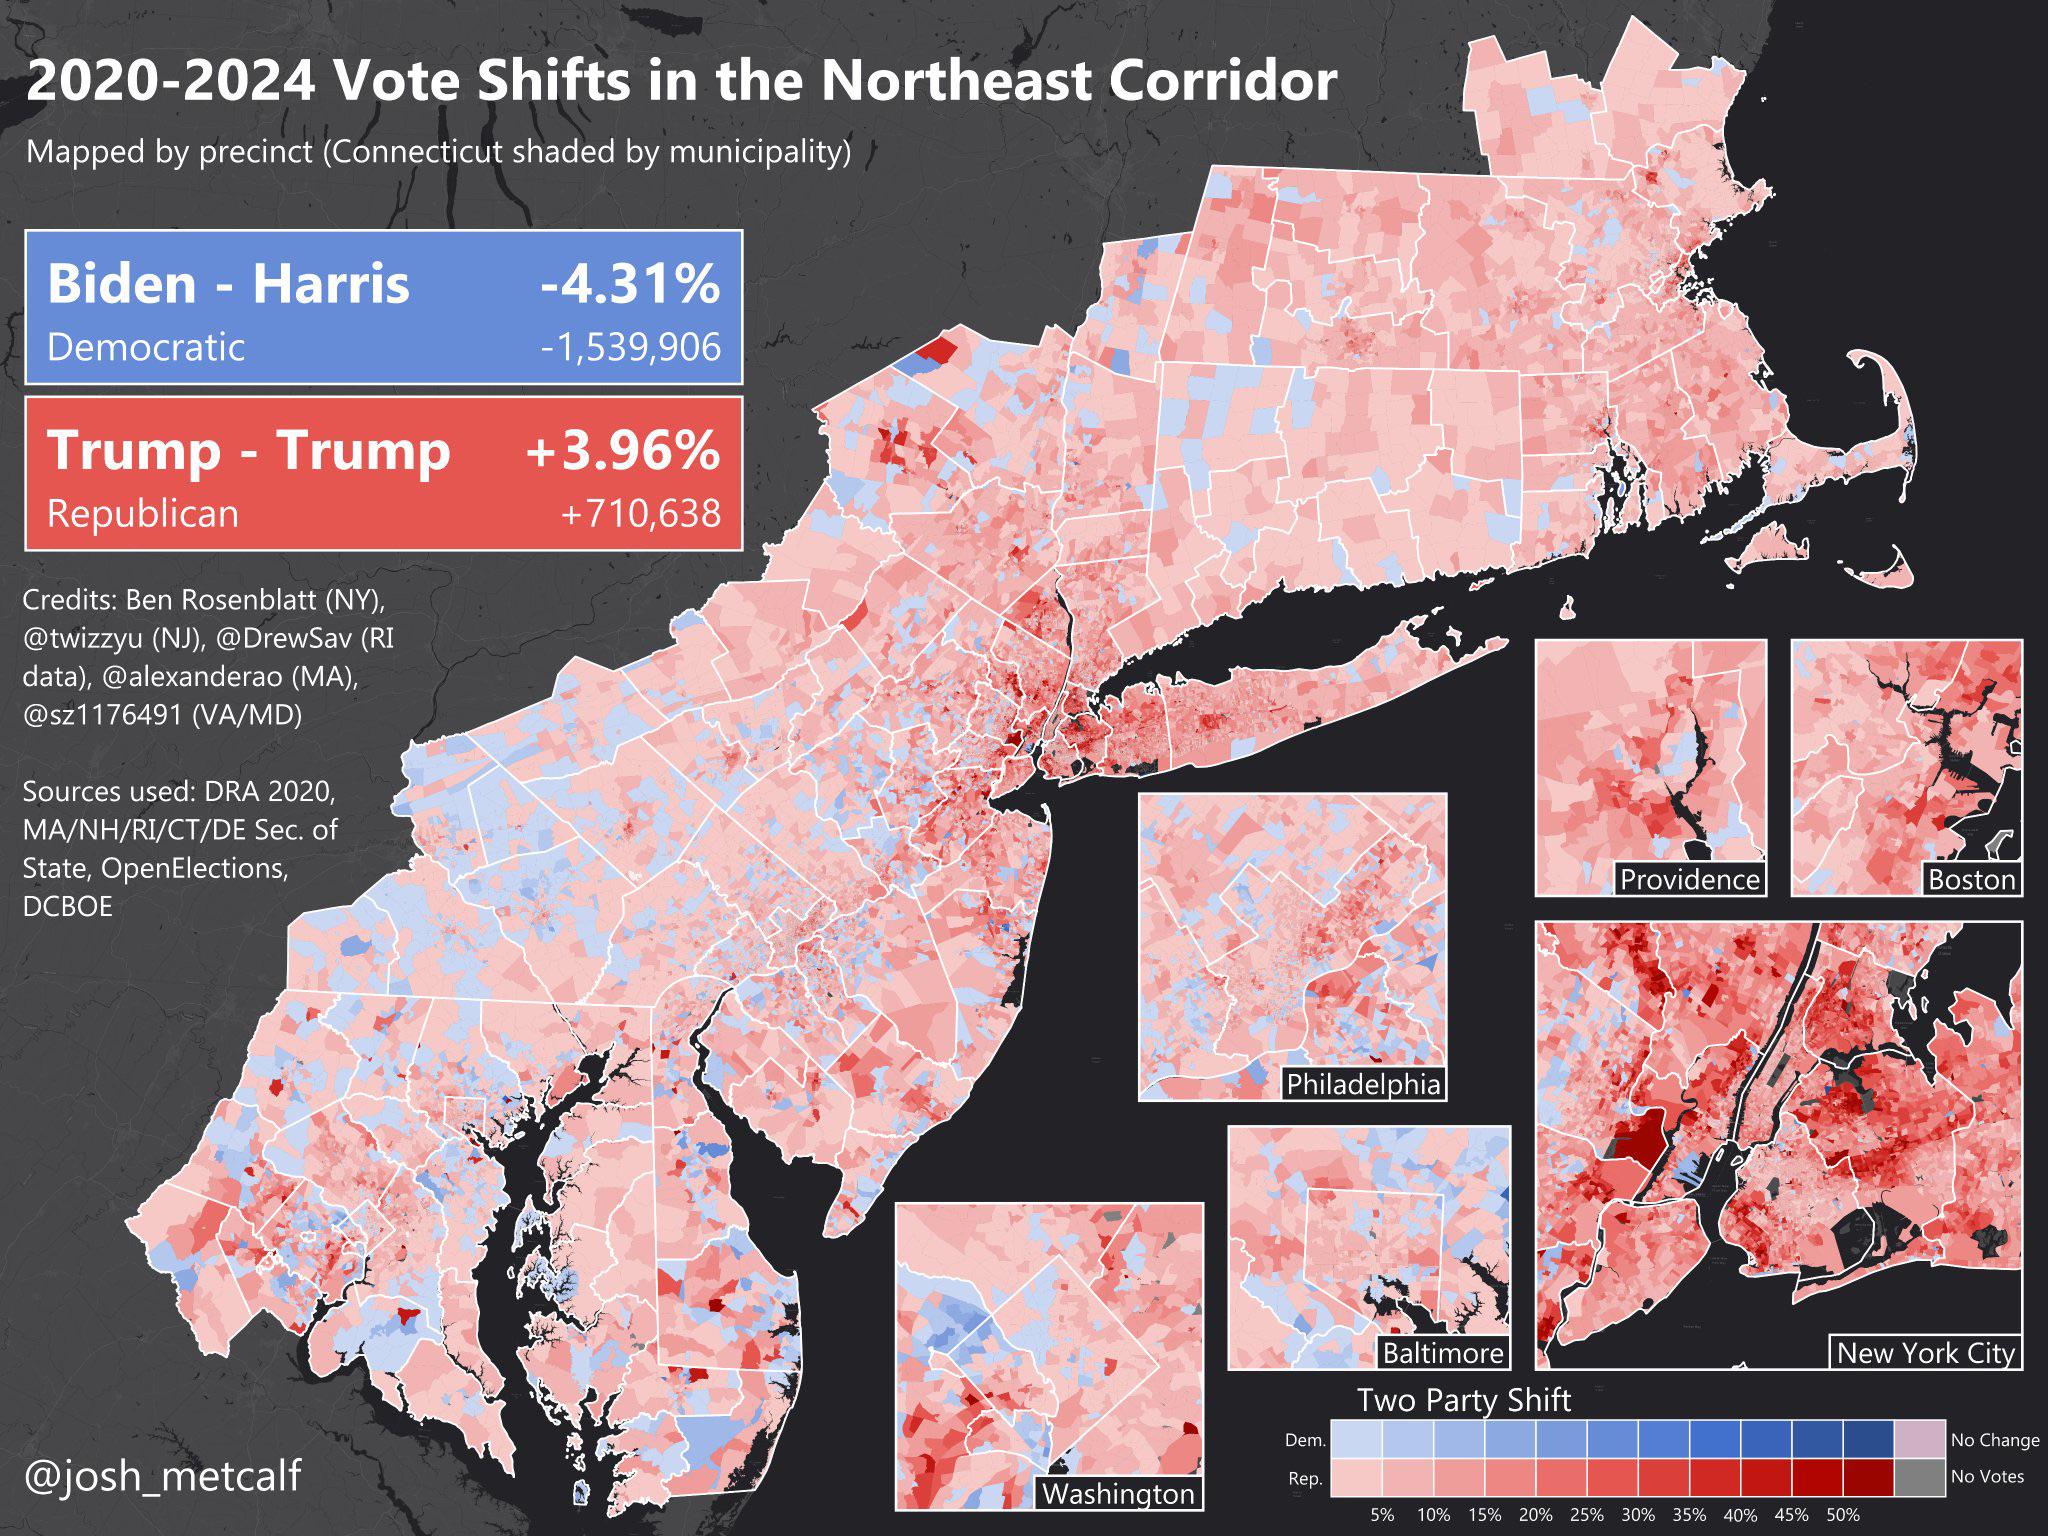
Vote Shifts Map in the Northeast Corridor 2020 to 2024
The visualization titled "Vote Shifts in the Northeast Corridor between the 2020 and 2024 elections" illustrates the cha...
👁 120📅 8/15/2025
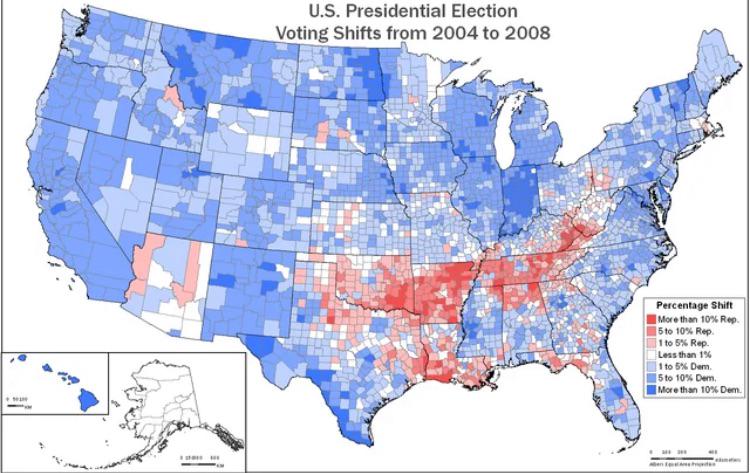
Voting Margin Shift Map from 2004 to 2008
The visualization titled "Shift in Voting Margins across Counties in the US from the 2004 election to the 2008 election"...
👁 58📅 9/27/2025
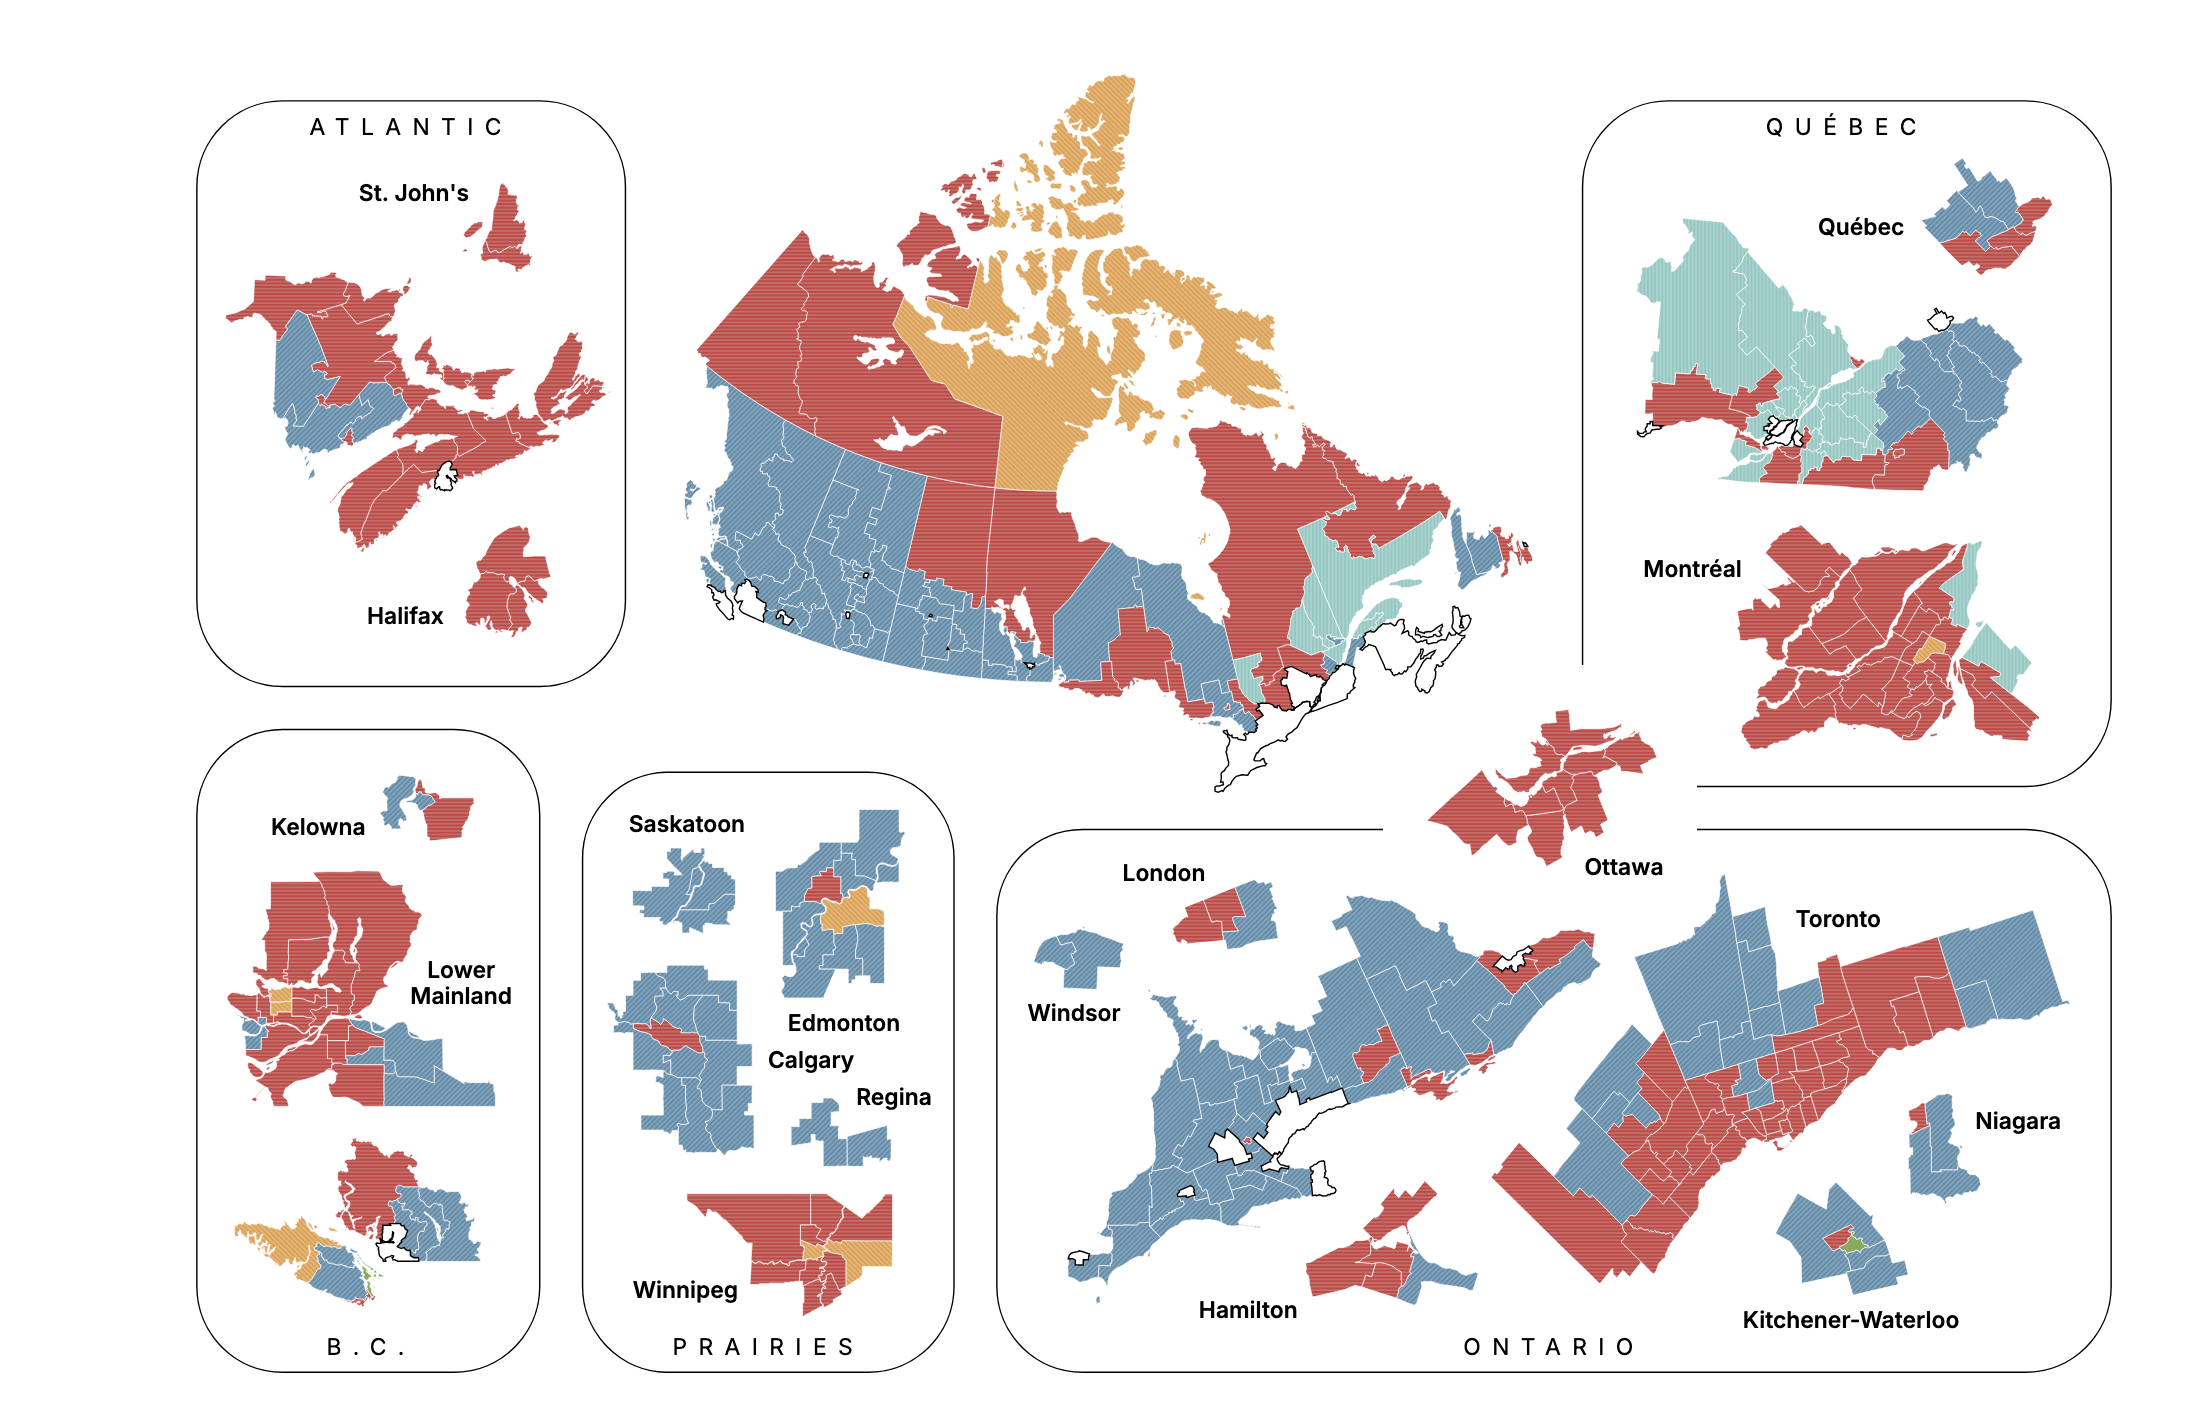
Canadian Election Projection Map September 2025
The "Canadian Election Projection - September 28, 2025" map provides a visual representation of the anticipated results ...
👁 66📅 9/28/2025
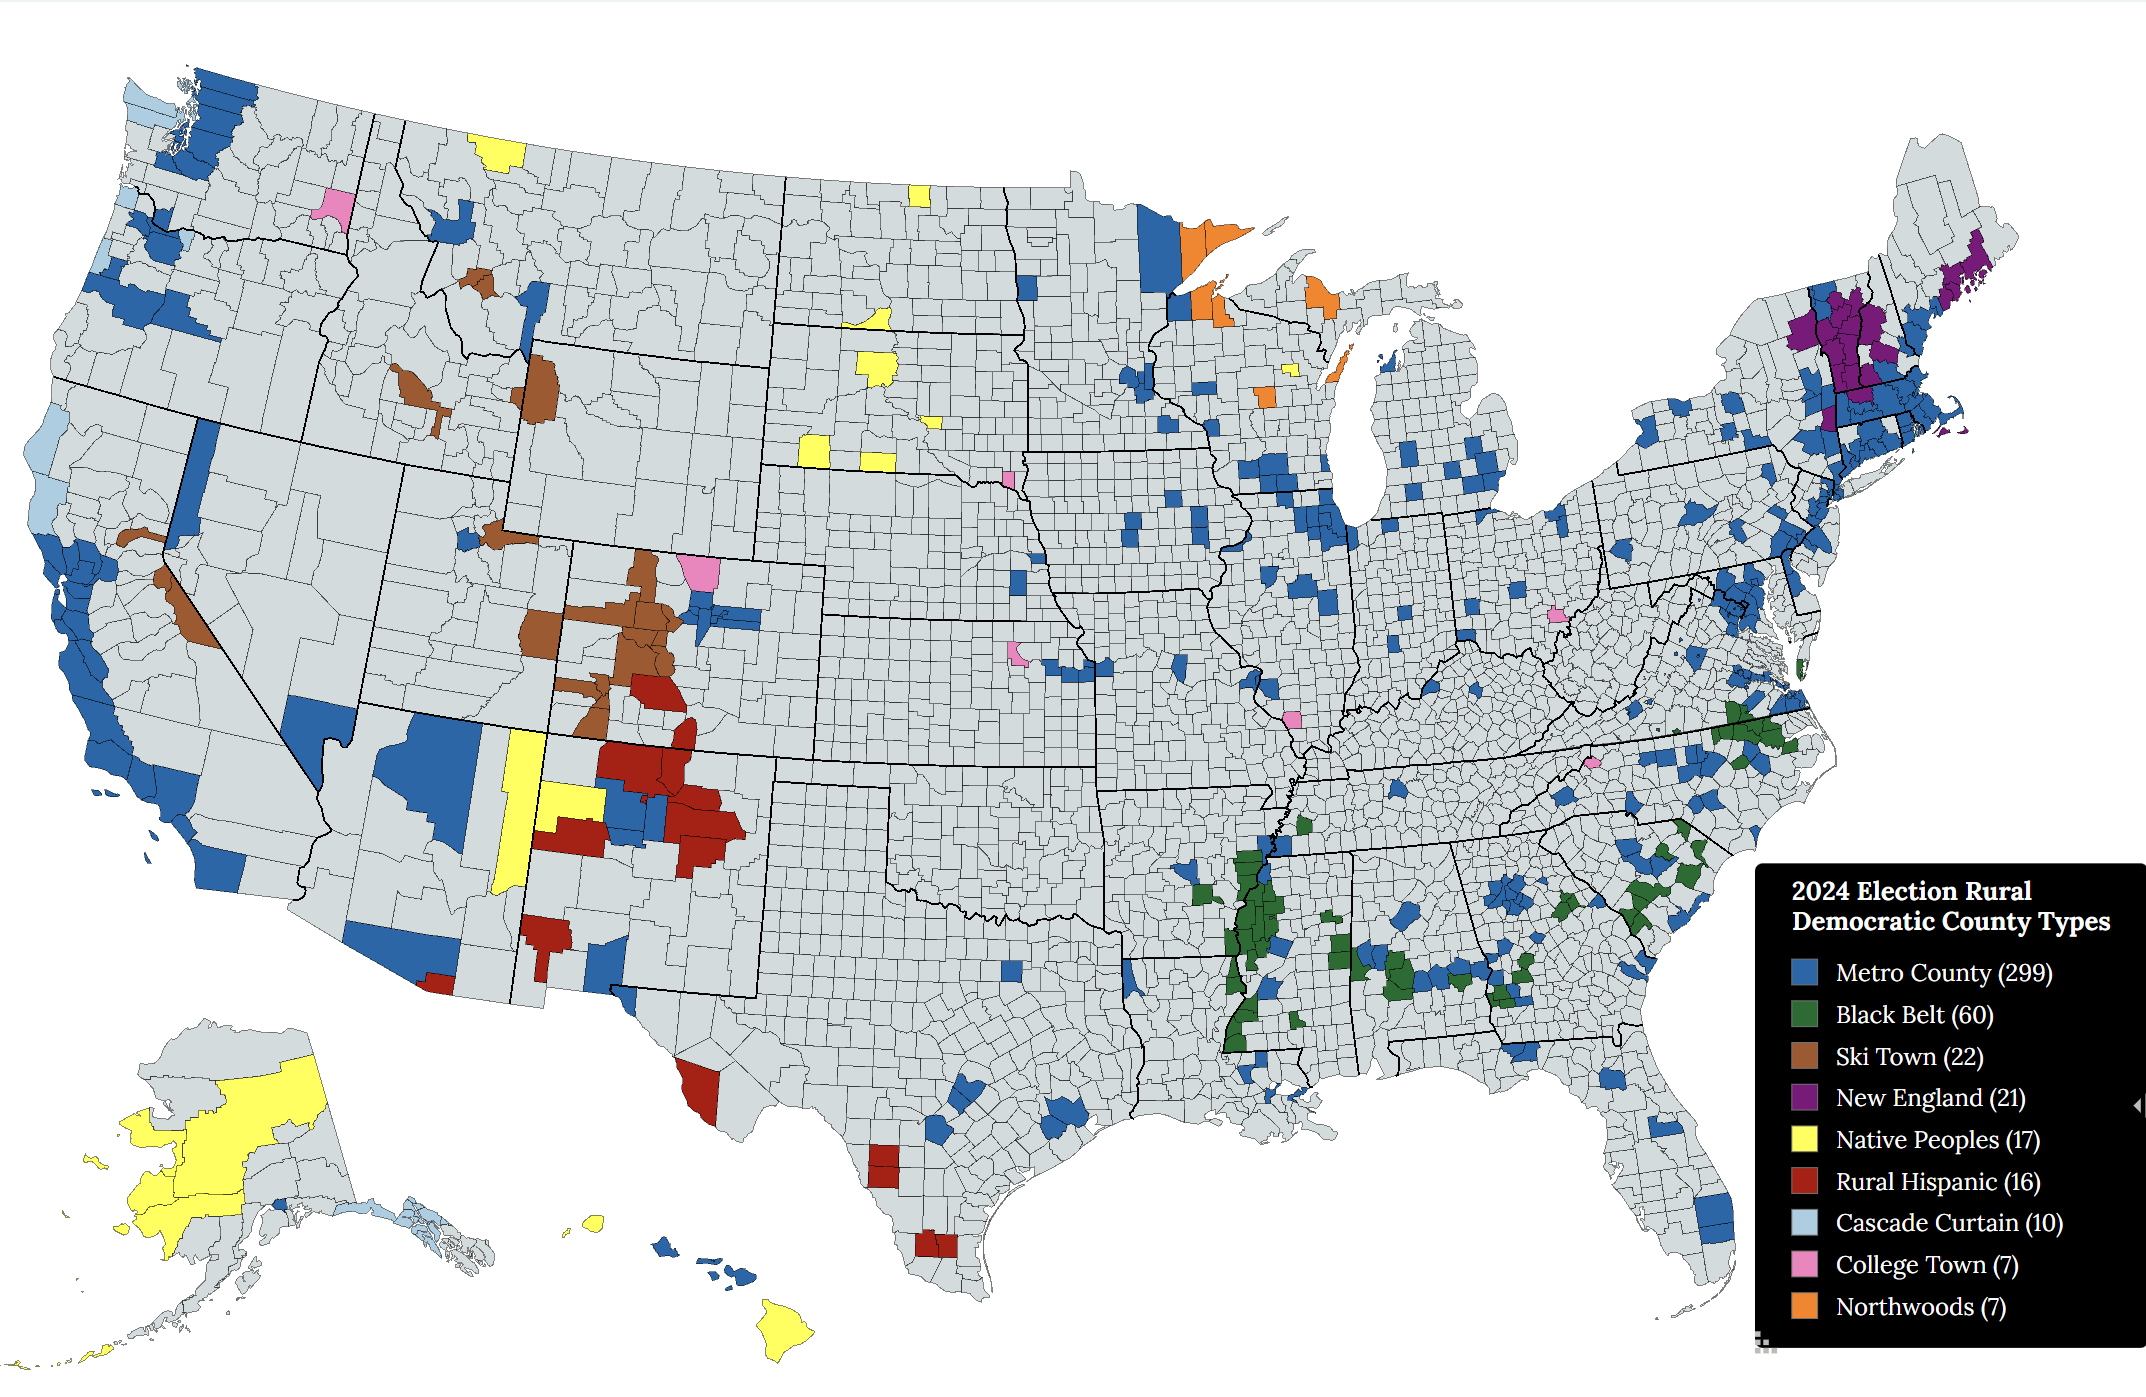
Rural Democratic Voting County Types Map
The "Rural Democratic Voting County Types of the 2024 U.S. Presidential Election" map provides a visual representation o...
👁 72📅 9/4/2025