Demographics and Population Map of America 1939

Alex Cartwright
Senior Cartographer & GIS Specialist
Alex Cartwright is a renowned cartographer and geographic information systems specialist with over 15 years of experience in spatial analysis and data...
Geographic Analysis
What This Map Shows
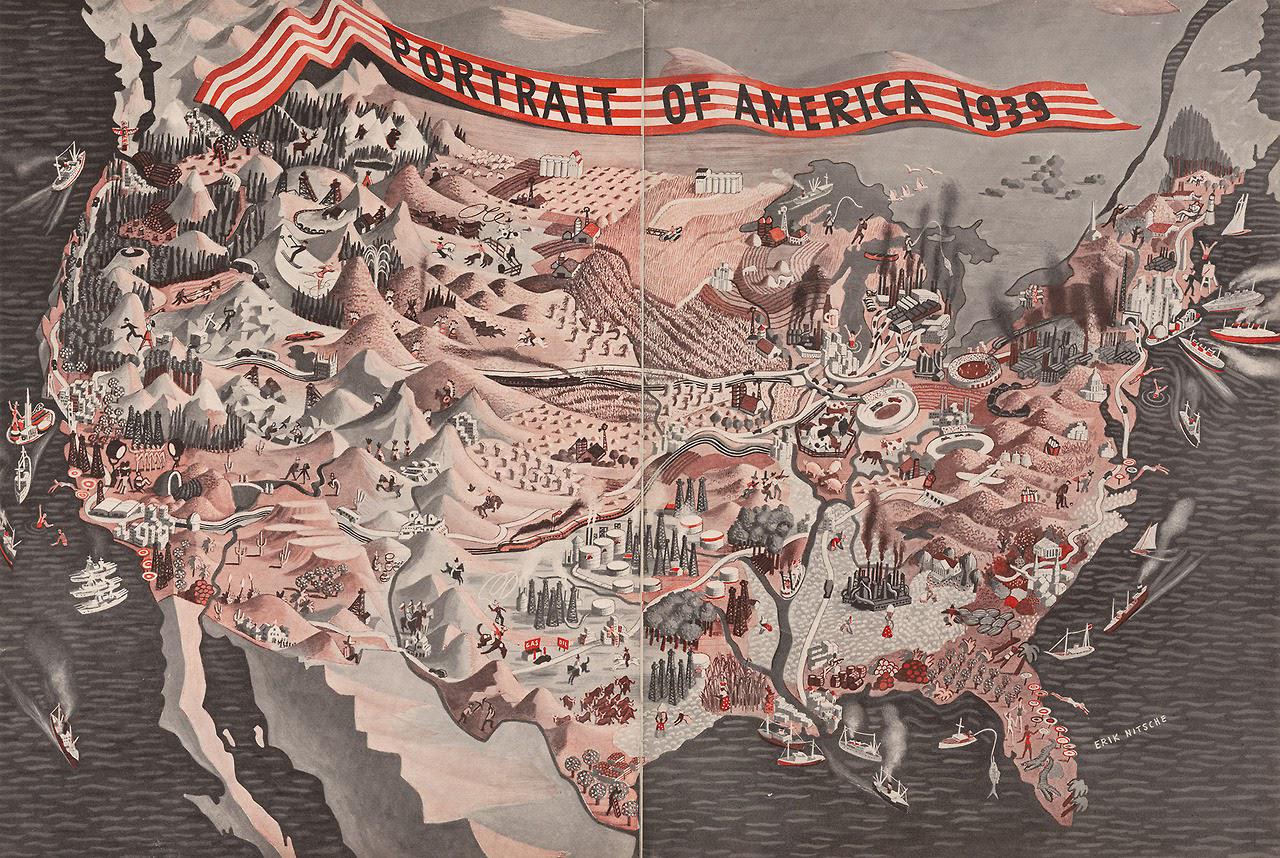
The "Portrait of America (1939)" map provides a rich visual representation of the demographic landscape of the United States at a pivotal moment in history. This map highlights population distribution patterns, urban centers, and regional demographics with striking clarity. By examining this visualization, we can gain insights into how the population dynamics of America were shaped by various factors such as migration, industrialization, and economic conditions during the late 1930s.
Deep Dive into Population Dynamics in 1939
As we delve into the topic of demographics in America during 1939, it’s important to note that this period was marked by significant changes. The Great Depression had a profound impact on the population distribution, influencing where people lived and worked. Economic opportunities, particularly in urban areas, drew people from rural regions, reshaping the landscape of American demographics.
Interestingly, the 1930s saw a migration trend towards cities. The industrial boom, despite the economic downturn, created jobs in manufacturing, drawing individuals and families away from agrarian lifestyles. For instance, cities like Detroit, Chicago, and New York became melting pots of culture and diversity, with populations swelling as people sought employment. In 1939, New York City alone was home to over 7 million residents, making it the most populous city in the United States.
The map also reveals the stark contrast between urban and rural populations. While cities were experiencing rapid growth, many rural areas faced decline. In fact, the agricultural sector was struggling, leading to the infamous Dust Bowl, which displaced thousands of families from the Great Plains. This environmental disaster forced many to migrate westward, particularly to California in search of better living conditions and opportunities.
Demographic data from the late 1930s indicates that the U.S. population was approximately 130 million, with a significant portion living in the Midwest and Northeast where industrial jobs were concentrated. The African American population was also on the move during this time, participating in what is known as the Great Migration. This movement saw thousands relocate from the rural South to cities in the North, fundamentally altering the social fabric of urban America.
Regional Analysis
Examining the map, we can break down the demographic trends by region. The Northeast, known for its industrial cities, was densely populated, showcasing the highest urbanization rates. Here, cities like Philadelphia and Boston played critical roles in manufacturing and commerce, drawing in workers from various backgrounds.
In contrast, the South experienced a different demographic landscape. Here, economic opportunities were limited, and many areas remained predominantly rural. The African American population was largely confined to this region, facing systemic poverty and limited prospects. However, the seeds of change were being sown, as the Great Migration began to reshape urban areas beyond the South.
The Midwest also displayed unique characteristics. States like Ohio and Illinois were hubs of industry, with cities like Chicago experiencing significant growth. However, these regions were also witnessing out-migration as economic opportunities fluctuated, leaving some areas struggling with population decline.
On the West Coast, California was on the brink of transformation. The influx of displaced families from the Dust Bowl, alongside a growing population drawn by the promise of prosperity, set the stage for rapid changes in the demographic landscape. By the end of the 1930s, California would emerge as a key player in the American economy.
Significance and Impact
Understanding the demographics of America in 1939 is crucial for several reasons. Firstly, it provides insight into the socio-economic conditions that shaped the nation’s trajectory. The shifts in population not only influenced urban development but also laid the groundwork for future civil rights movements as marginalized populations began to seek equality and opportunity in urban settings.
Moreover, the trends observed in this map serve as a historical lens through which we can analyze contemporary population dynamics. Today, issues such as urbanization, migration, and demographic shifts continue to impact society. Have you noticed how cities are once again becoming focal points for economic opportunity? The lessons from 1939 resonate as we examine current trends, such as the movement of people towards tech hubs and urban centers.
In conclusion, the "Portrait of America (1939)" map serves as a powerful reminder of the complexities of demographic changes in the United States. By studying these historical patterns, we can better understand the ongoing evolution of American society and its implications for the future.
Visualization Details
- Published
- October 2, 2025
- Views
- 12
Comments
Loading comments...