U.S. House of Representatives Congressional District Map of Texas

David Chen
Data Visualization Specialist
David Chen is an expert in transforming complex geographic datasets into compelling visual narratives. He combines his background in computer science ...
Geographic Analysis
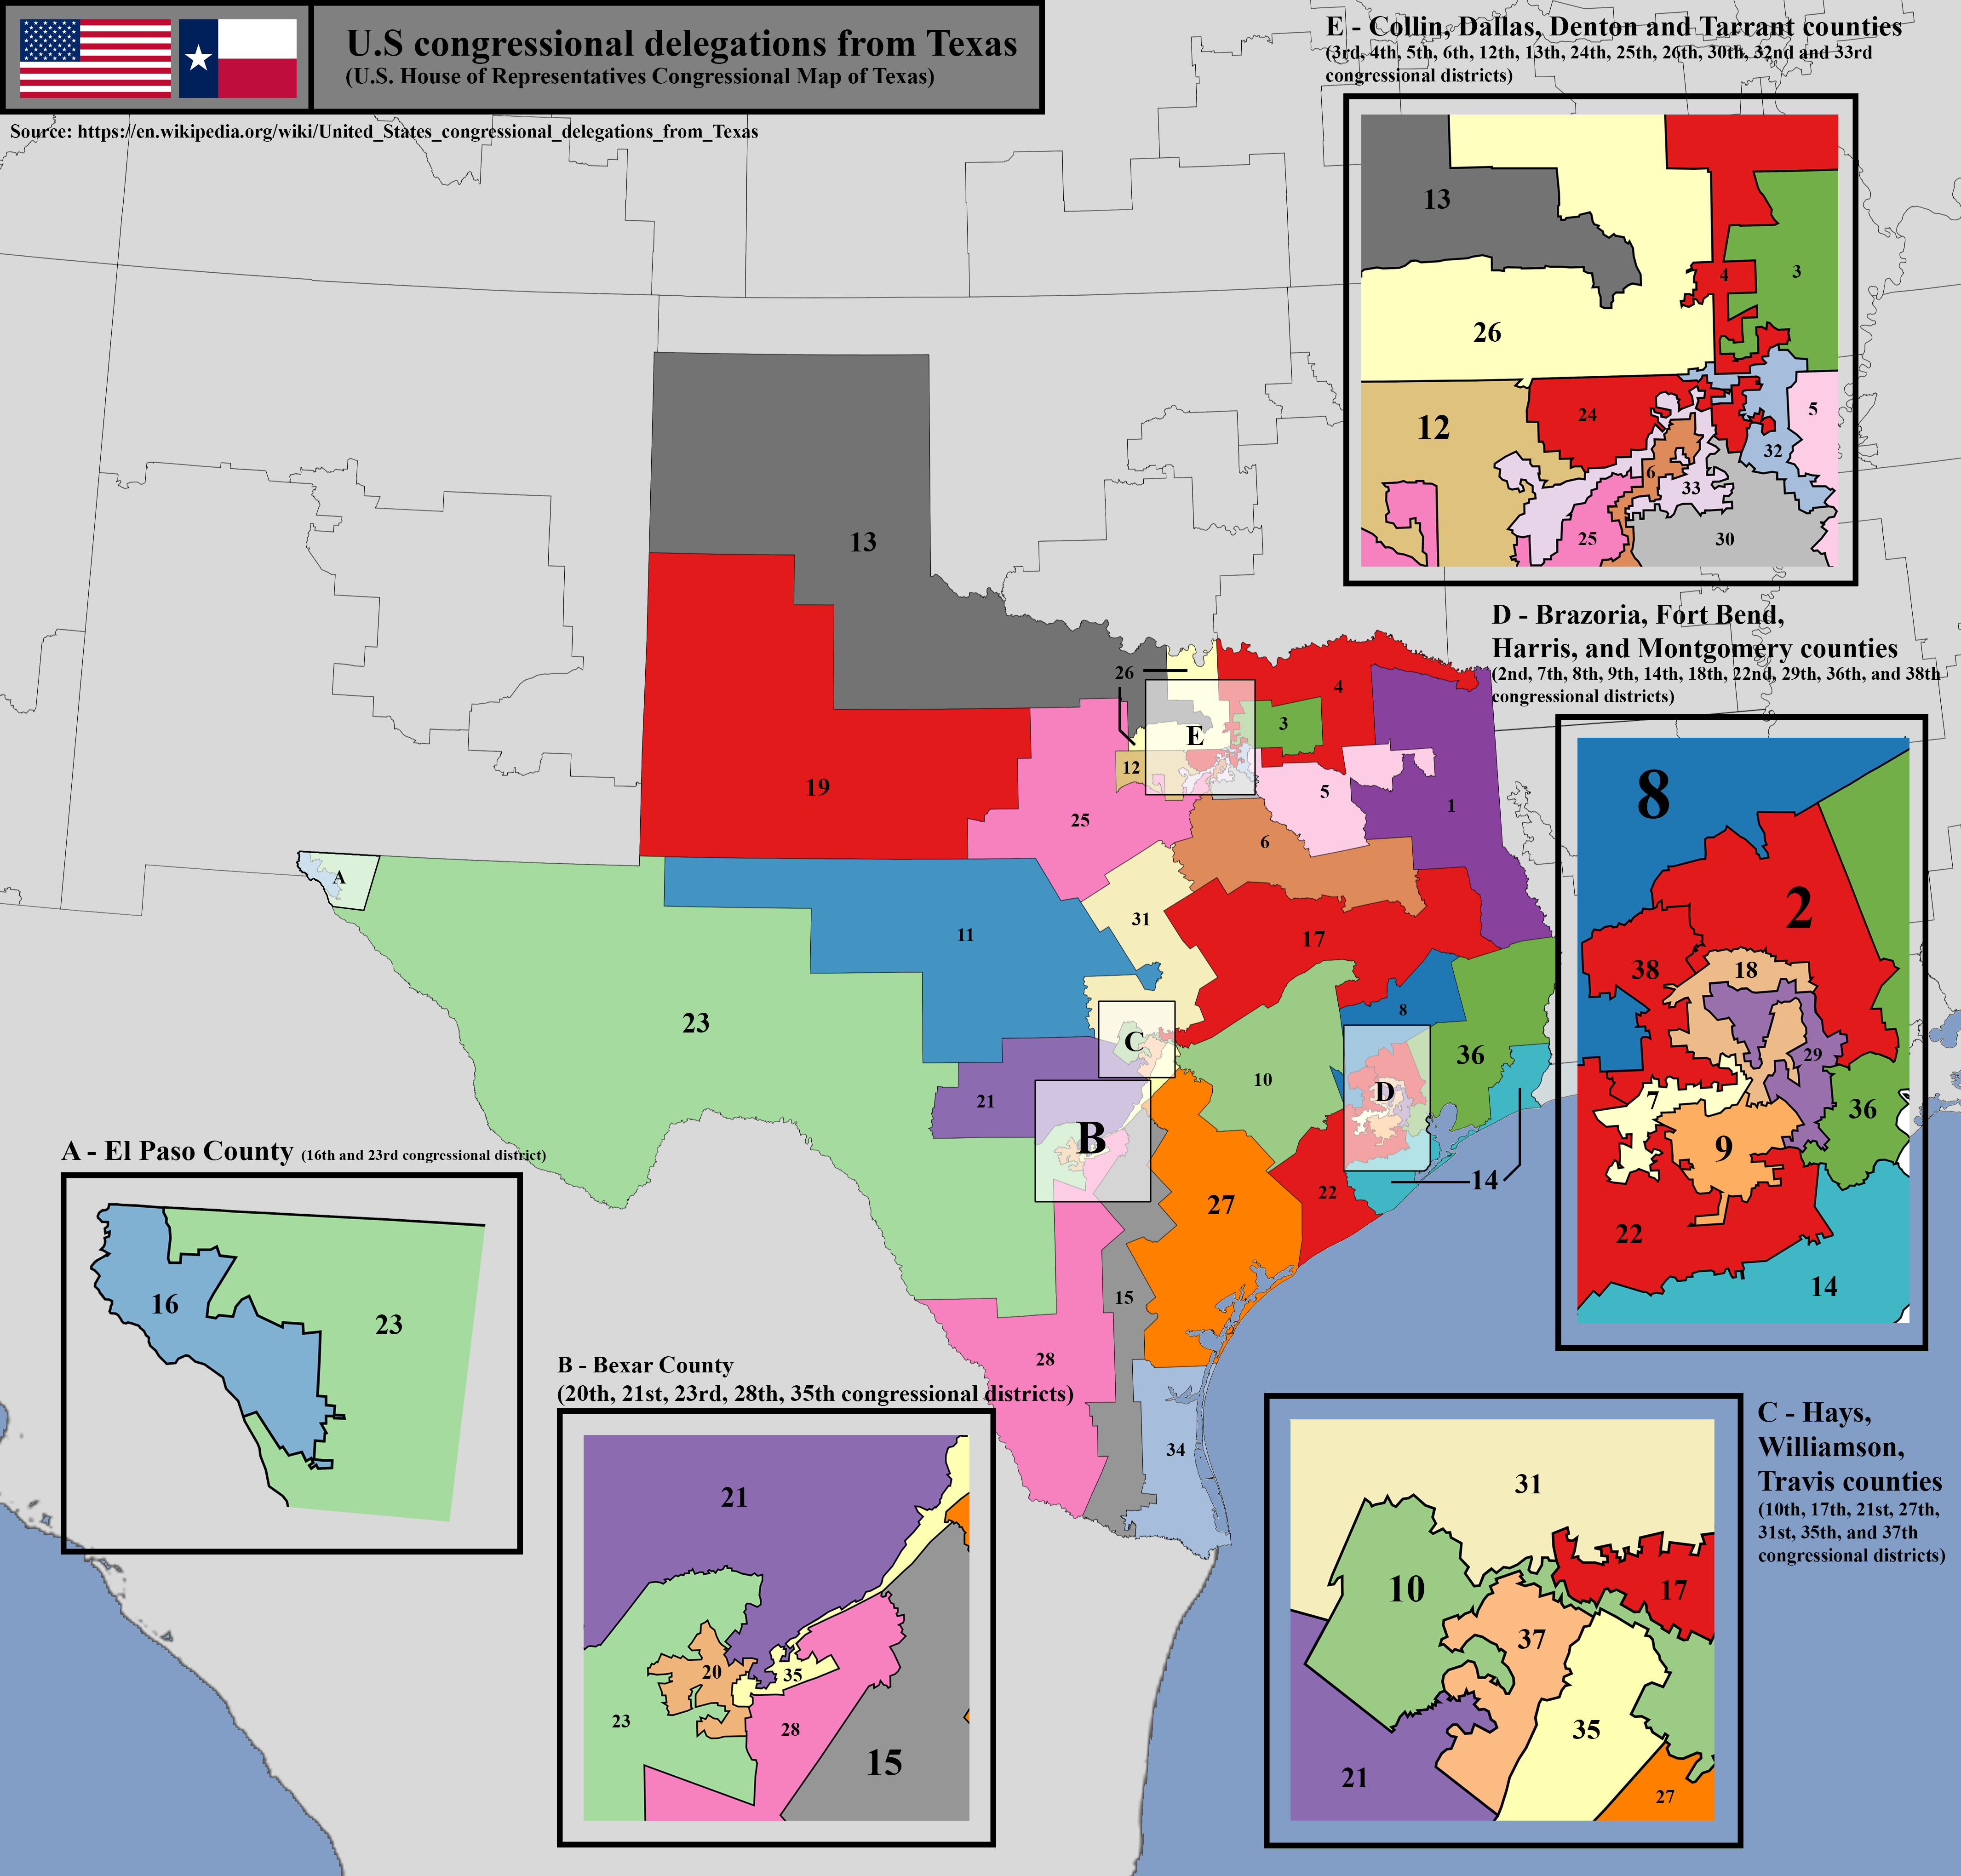
What This Map Shows
The U.S. House of Representatives congressional district map of Texas visually represents the boundaries of each congressional district in the state. This map is crucial for understanding how political representation is distributed across Texas, which is the second-largest state in the United States both in area and population. Each district elects one representative to the House of Representatives, and the configuration of these districts can significantly influence electoral outcomes and policy-making.
Deep Dive into Congressional Districts in Texas
Texas has 36 congressional districts, making it the state with the highest number of districts in the nation. This number reflects Texas's substantial population, which, as of the latest census, is over 29 million residents. Interestingly, Texas's population growth has been dramatic in recent years, driven by factors such as a robust economy, job opportunities, and an influx of new residents from other states and countries.
Each district is drawn to include roughly equal populations, which is mandated by the principle of "one person, one vote." However, the way these districts are drawn—known as gerrymandering—can lead to varied political representation. For instance, districts may be shaped in a way to favor a particular political party or demographic group, which can skew representation in Congress. What's fascinating is that the process of redistricting occurs every ten years following the census, and the next round will likely reflect the continuing demographic shifts in Texas, especially with growing urban populations in cities like Austin, Dallas, and Houston.
Demographically, Texas is incredibly diverse, with significant Hispanic, African American, and Asian American populations. This diversity is reflected in the congressional districts, where some districts are predominantly represented by Hispanic or African American communities. However, the challenges of representation persist, particularly in districts where populations are rapidly changing. For example, in the urban areas, we see a younger, more diverse electorate, while rural districts may have older, predominantly white populations. Understanding these dynamics is vital for grasping the political landscape of Texas.
Regional Analysis
Looking at the congressional districts on the map reveals distinct regional variations in Texas. For instance, the urban districts in and around Houston and Dallas tend to lean Democratic, while rural areas in West Texas generally favor Republican candidates. This contrast highlights the urban-rural divide in political preferences, which is a common trend in states across the nation. Interestingly, the 7th District in Houston, known for its affluent neighborhoods, has been a battleground district that has seen significant campaigning from both major parties in recent elections.
In contrast, districts in the Panhandle, such as the 13th District, are characterized by their conservative leanings and agricultural economies. The 14th District, which includes parts of Galveston County, showcases a coastal community that grapples with unique issues related to hurricane preparedness and environmental concerns. These regional differences not only inform the political climate but also the types of policies that representatives prioritize, from environmental regulations to healthcare access.
Significance and Impact
Understanding the congressional district map of Texas is not just an exercise in geography; it has real-world implications for governance and policy decisions. The way districts are drawn can influence voter turnout, party strength, and the types of legislation that are prioritized. For example, districts that encompass urban areas with high concentrations of young voters may push for progressive policies on issues like climate change and healthcare, while rural districts may prioritize agricultural interests and conservative values.
As we move towards the next round of redistricting following the upcoming census, the implications of demographic changes will be profound. Texas is expected to continue its growth trajectory, which will further complicate the political landscape. Future projections suggest that as urban areas expand, the political influence of these regions will likely increase, potentially reshaping Texas's role in national politics. Have you noticed how demographic shifts can alter the balance of power in the House of Representatives? It's a critical aspect of understanding American democracy today.
In conclusion, the U.S. House of Representatives congressional district map of Texas is more than just a depiction of political boundaries. It tells a story of a state in transition, reflecting the diverse voices and interests that make up its population. As voters become more engaged and the state's demographics continue to evolve, the importance of this map will only grow in the years to come.
Visualization Details
- Published
- August 13, 2025
- Views
- 92
Comments
Loading comments...