sustainable development Maps
9 geographic visualizations tagged with "sustainable development"
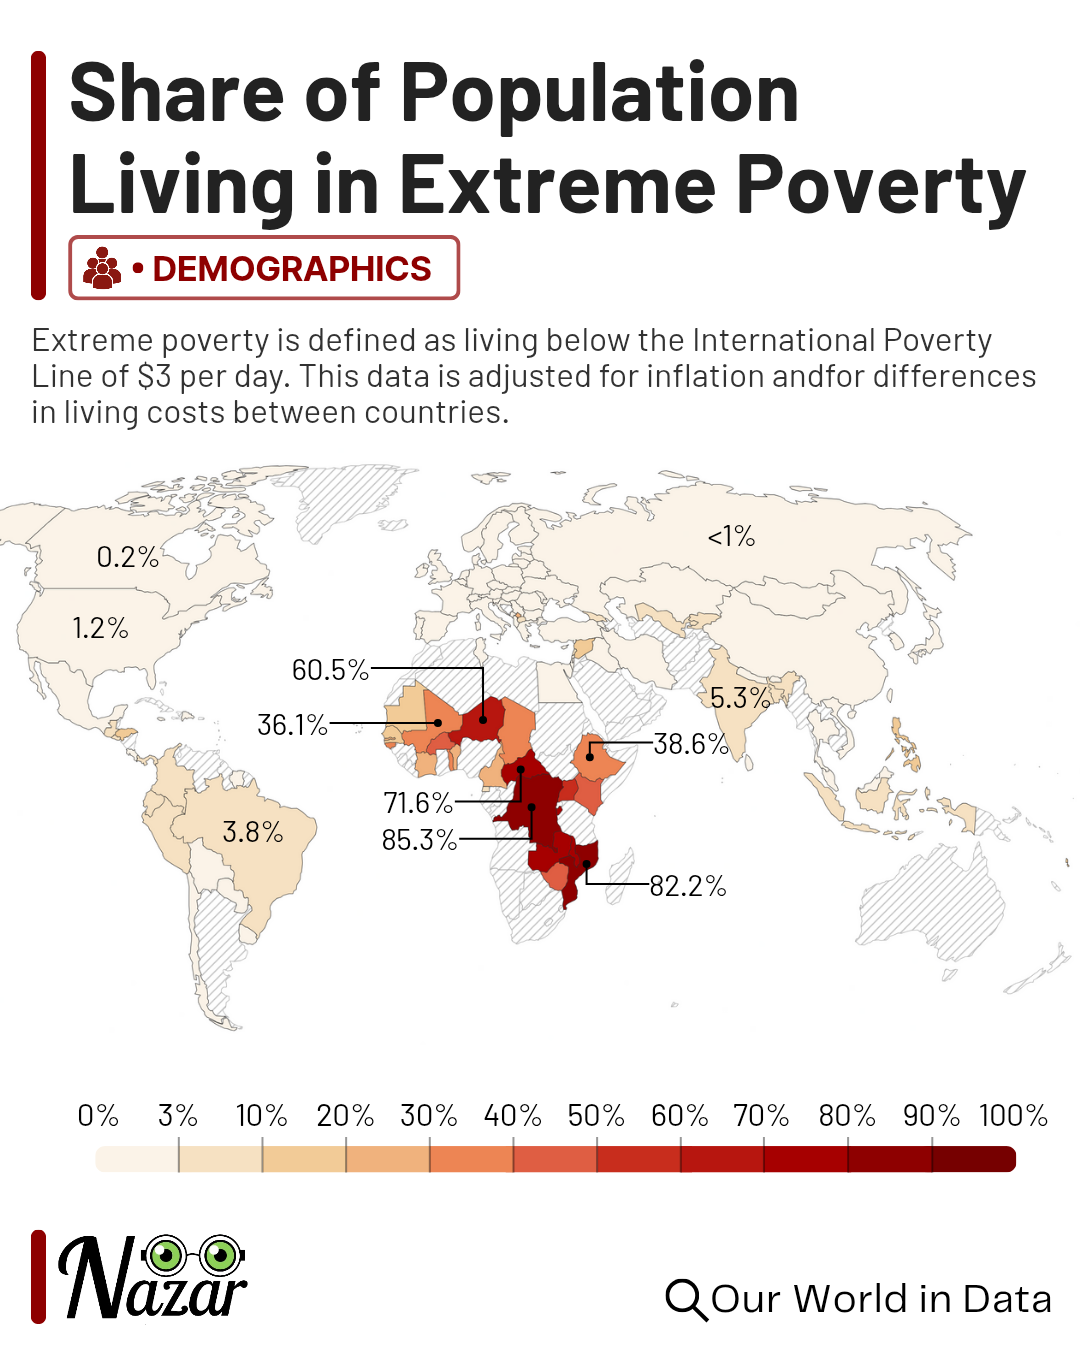
Extreme Poverty Rate by Country Map
The "Share of People Living in Extreme Poverty" map provides a stark visual representation of the percentage of individu...
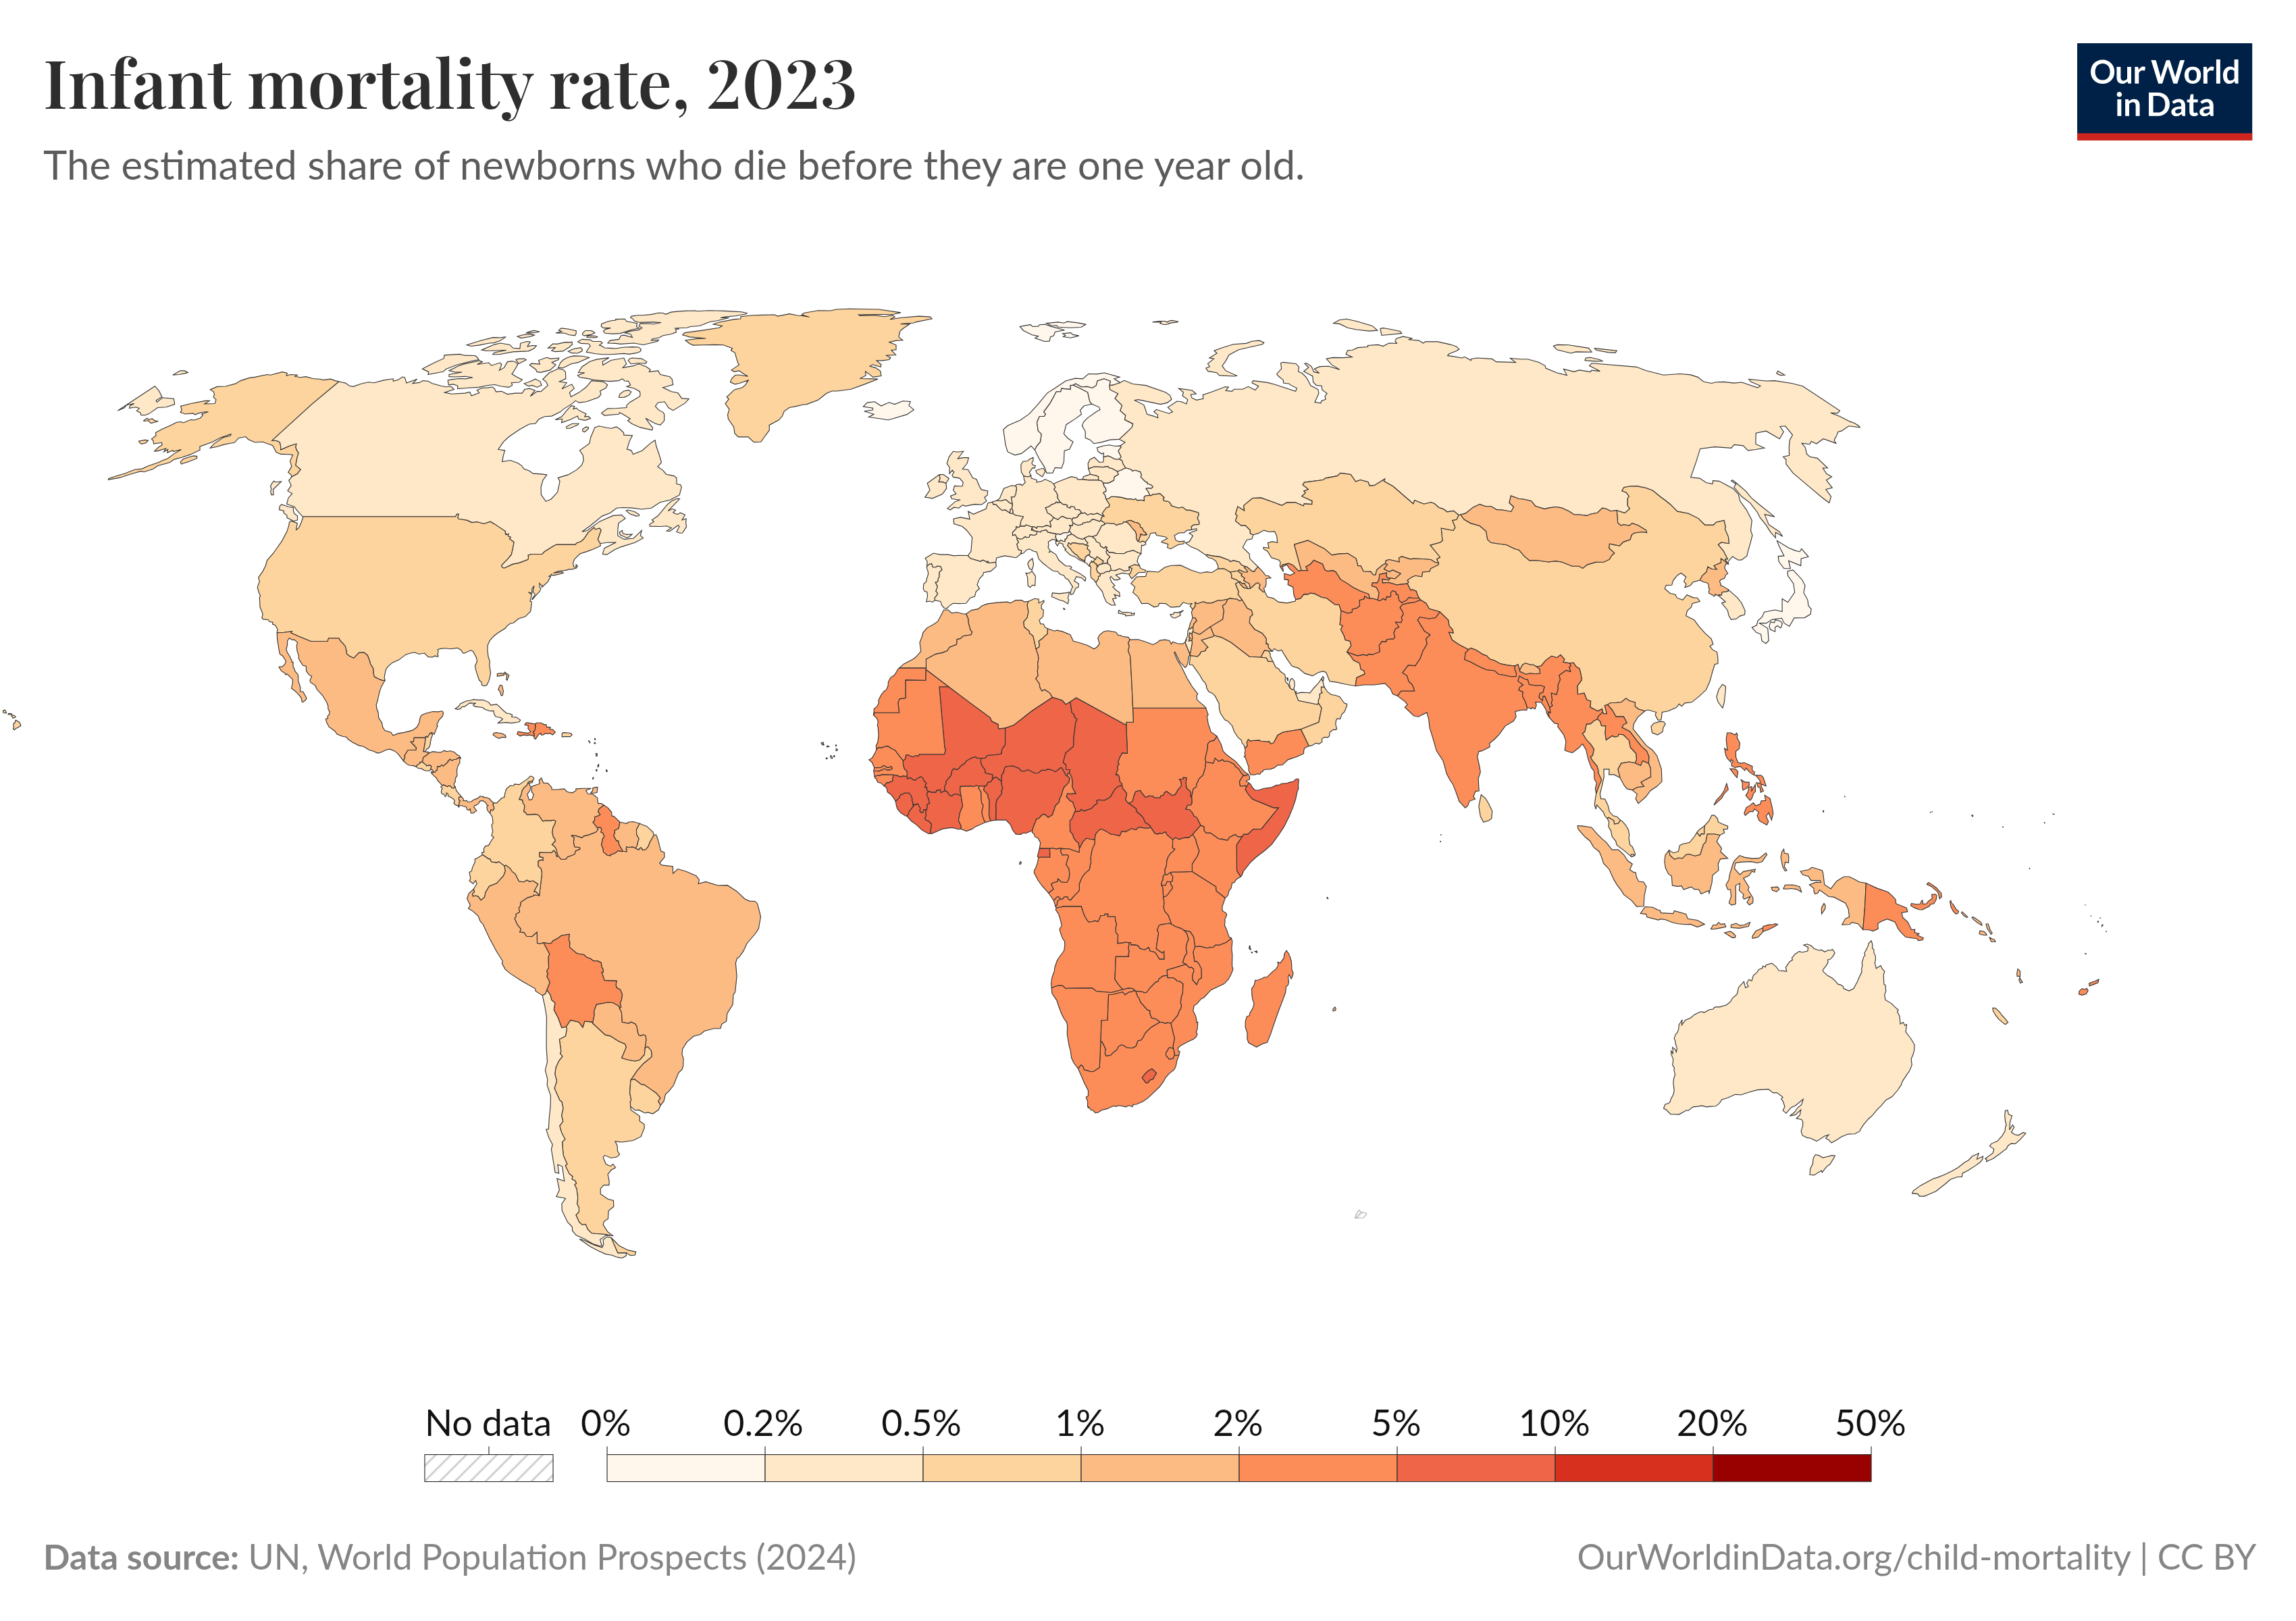
Infant Mortality Rate Map 2023
The "Infant Mortality Rate Map 2023" provides a comprehensive visual representation of the rates of infant deaths per 1,...
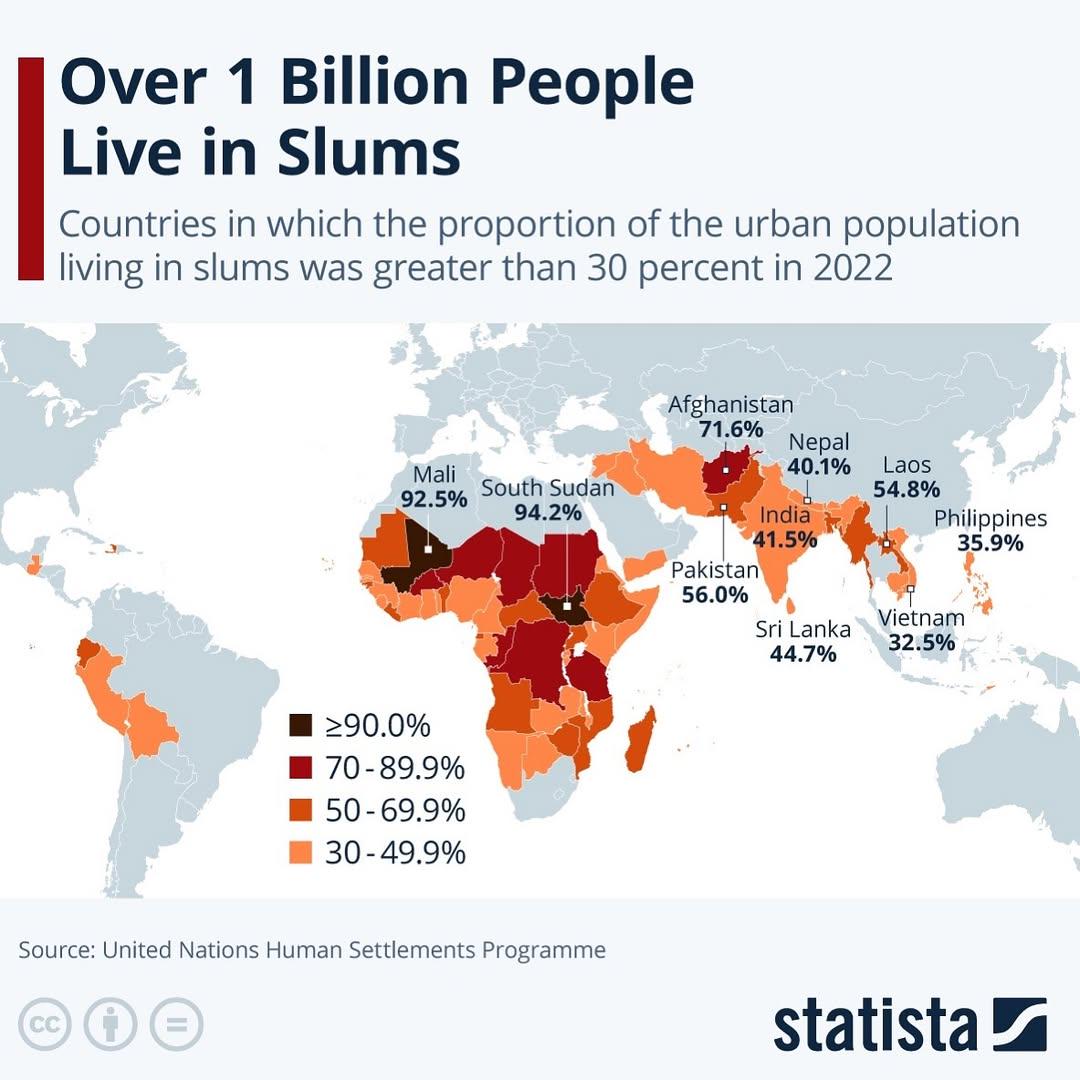
Slum Population Distribution Map
The map titled "Over 1 billion people live in slums" provides a stark visual representation of the global distribution o...
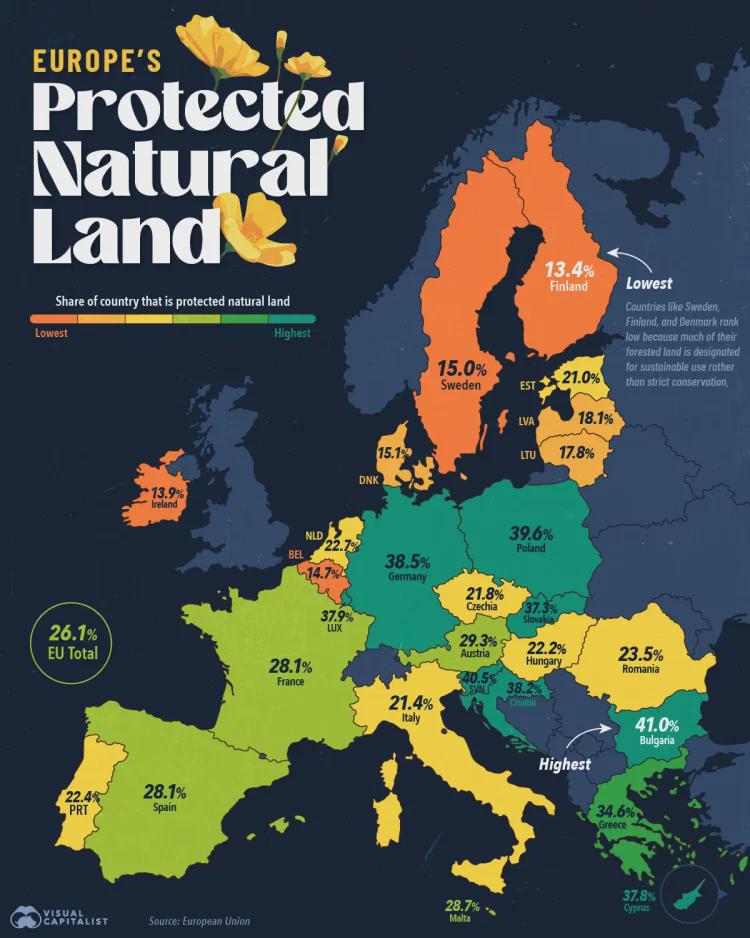
Map of European Union's Protected Natural Land
This visualization illustrates the extent of protected natural land across the European Union. It highlights regions des...
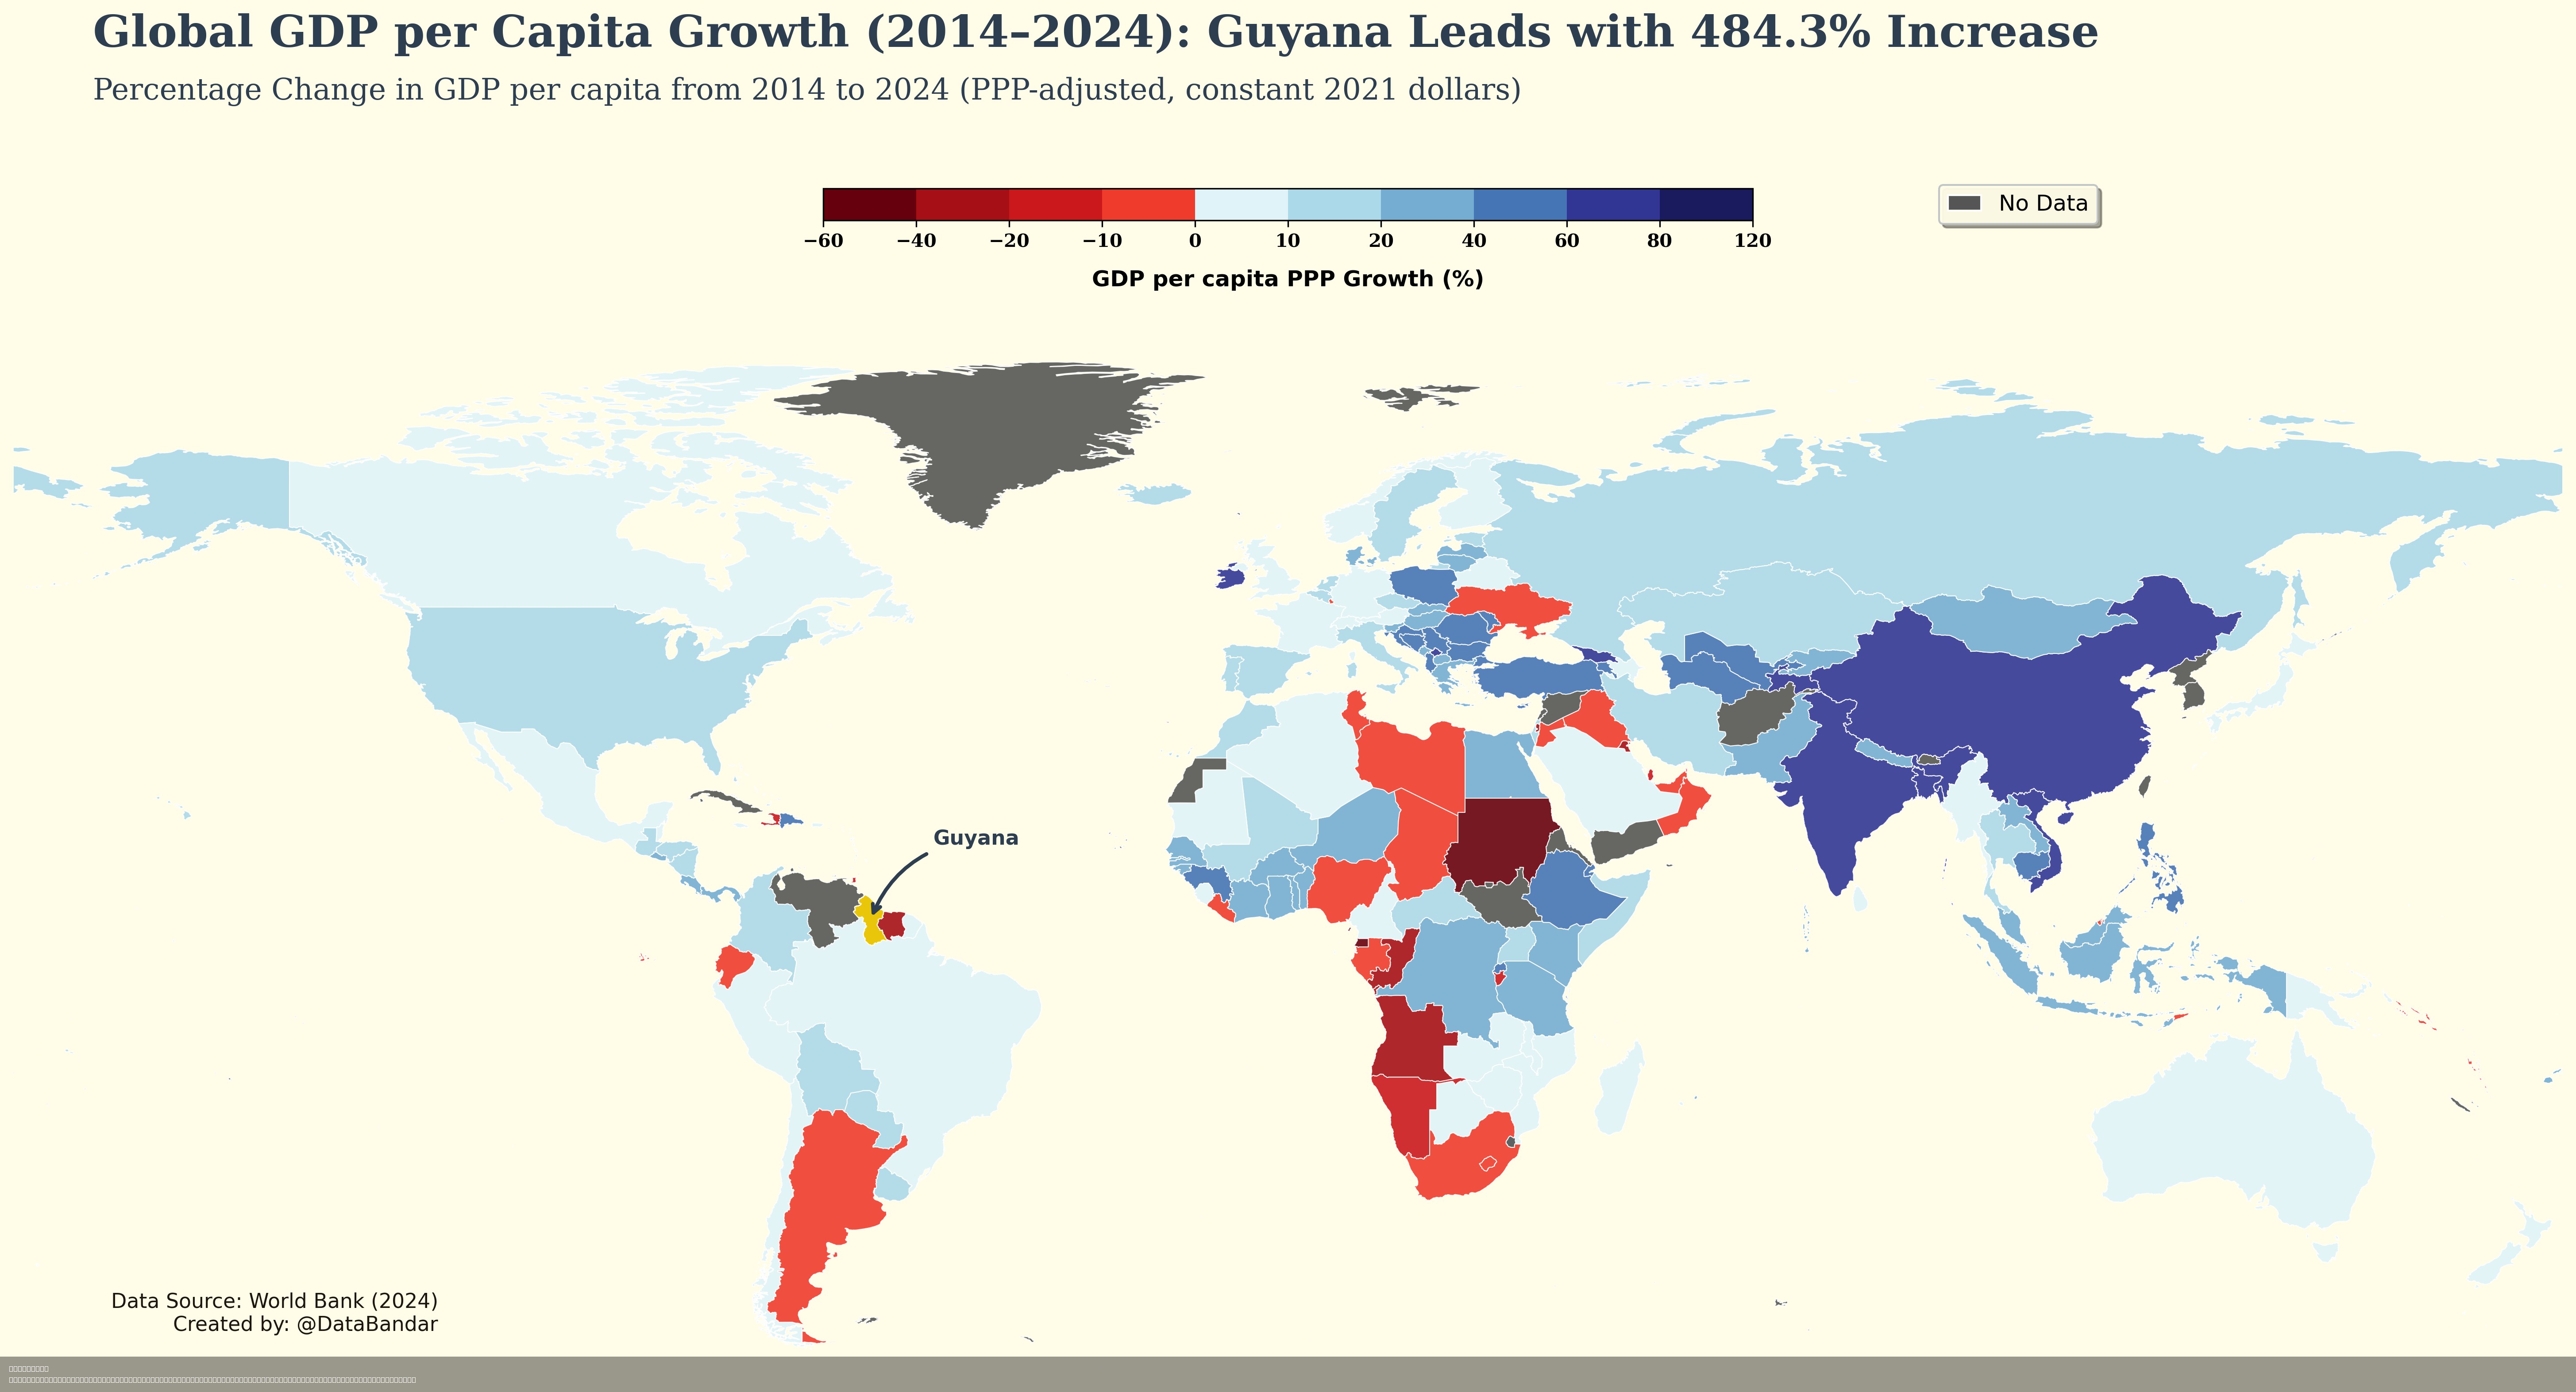
GDP Per Capita Growth Map of Guyana
The visualization titled "Guyana's GDP per capita grew 484% from 2014-2024, leading the world by a massive margin" provi...
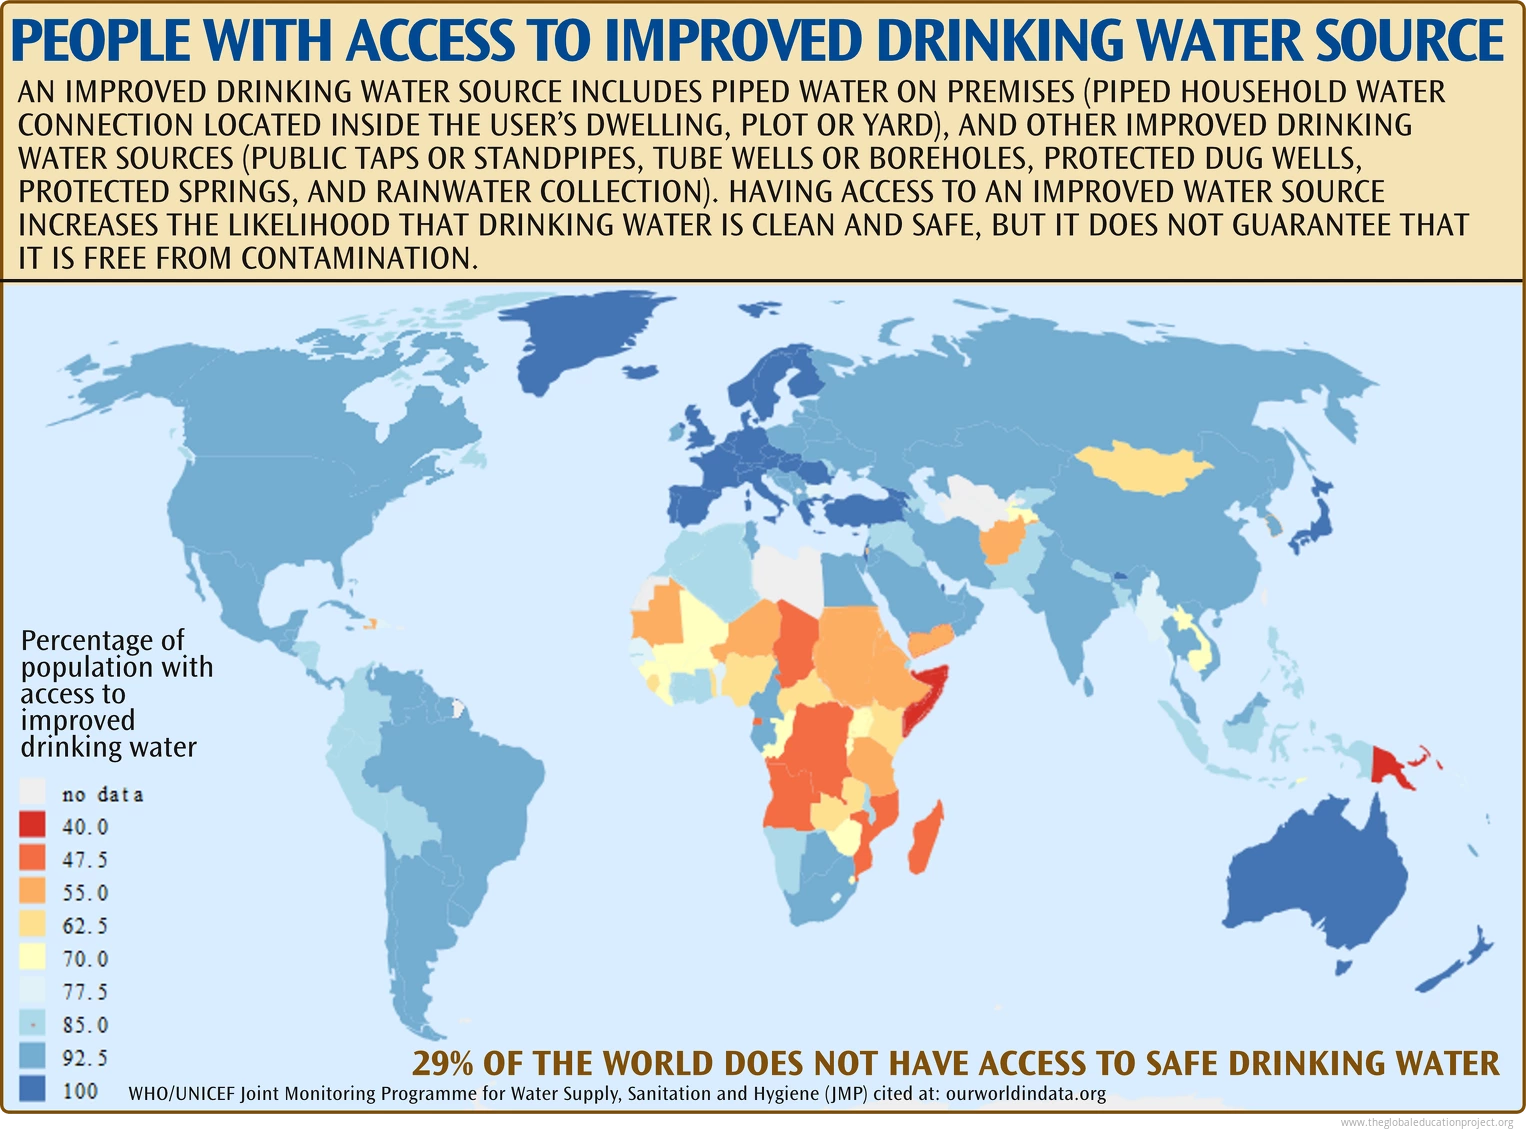
Improved Drinking Water Source Population Map 2025
The "Percentage of Population with Improved Drinking Water Source [2025]" map provides a clear and comprehensive visuali...
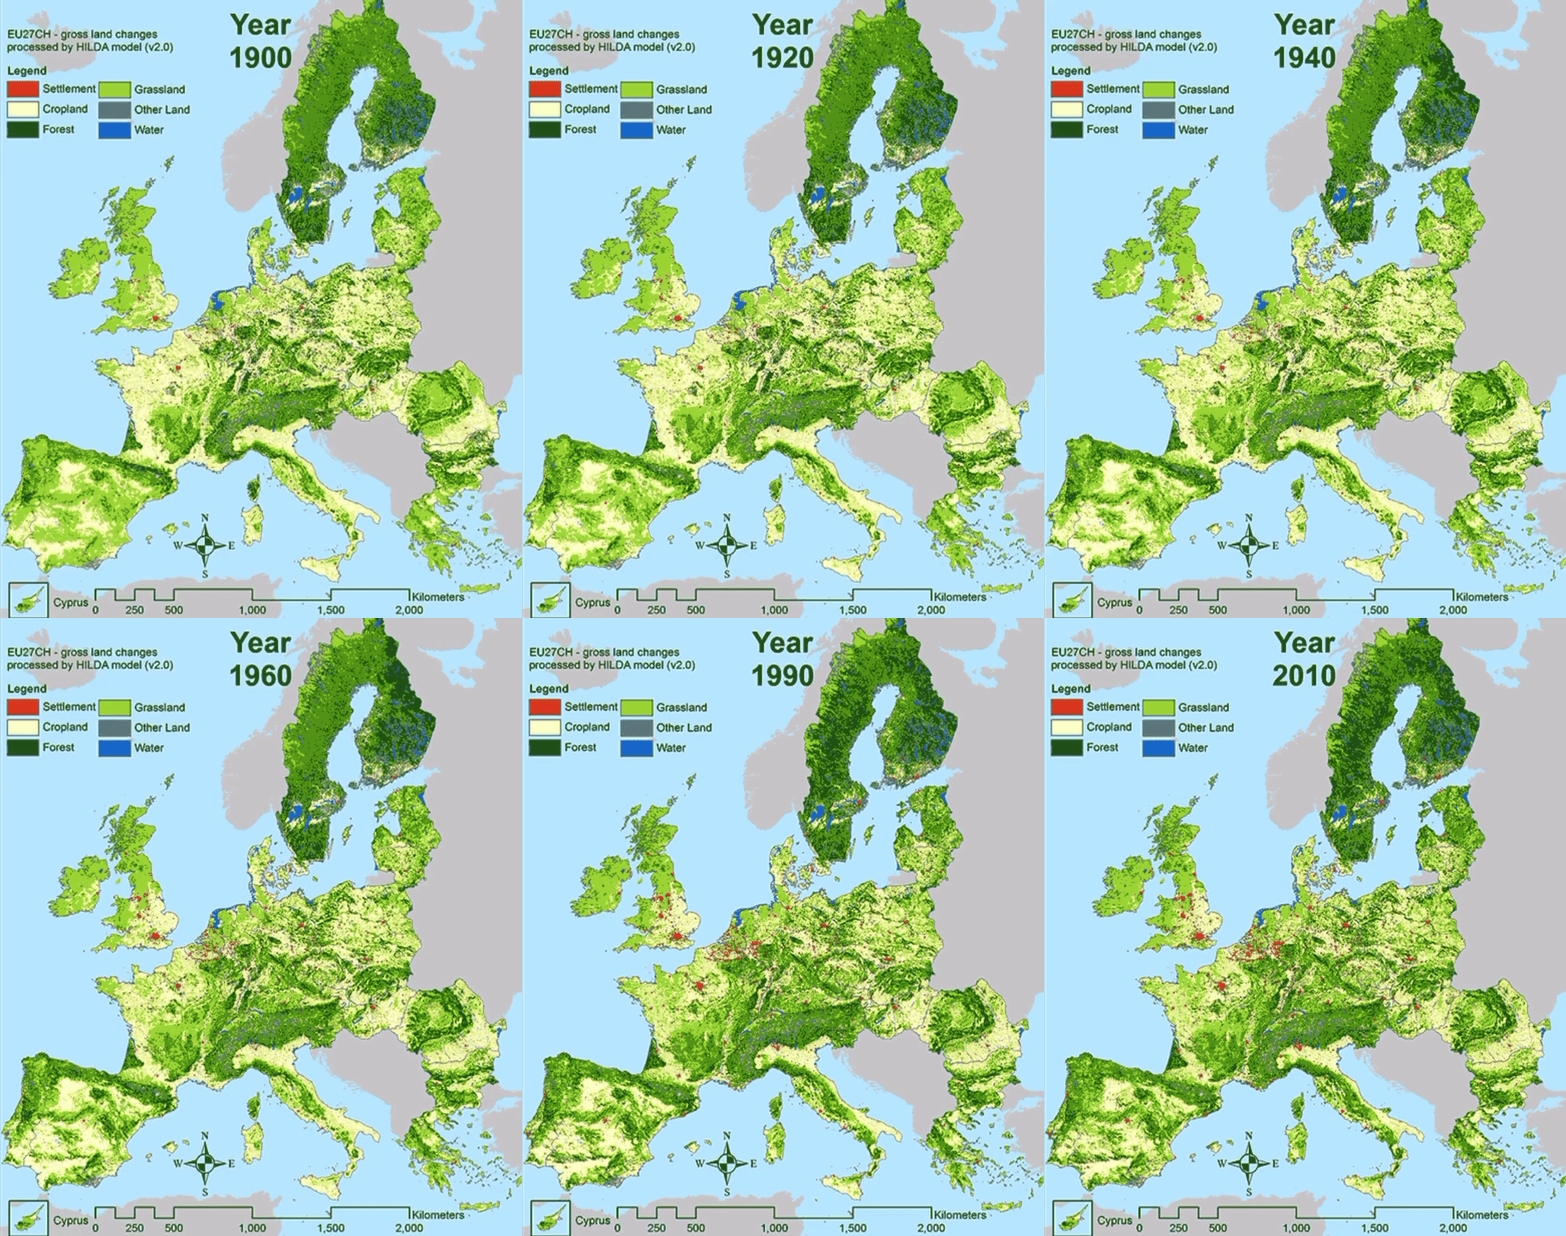
Forest Rebirth Map: Global Reforestation Trends
...
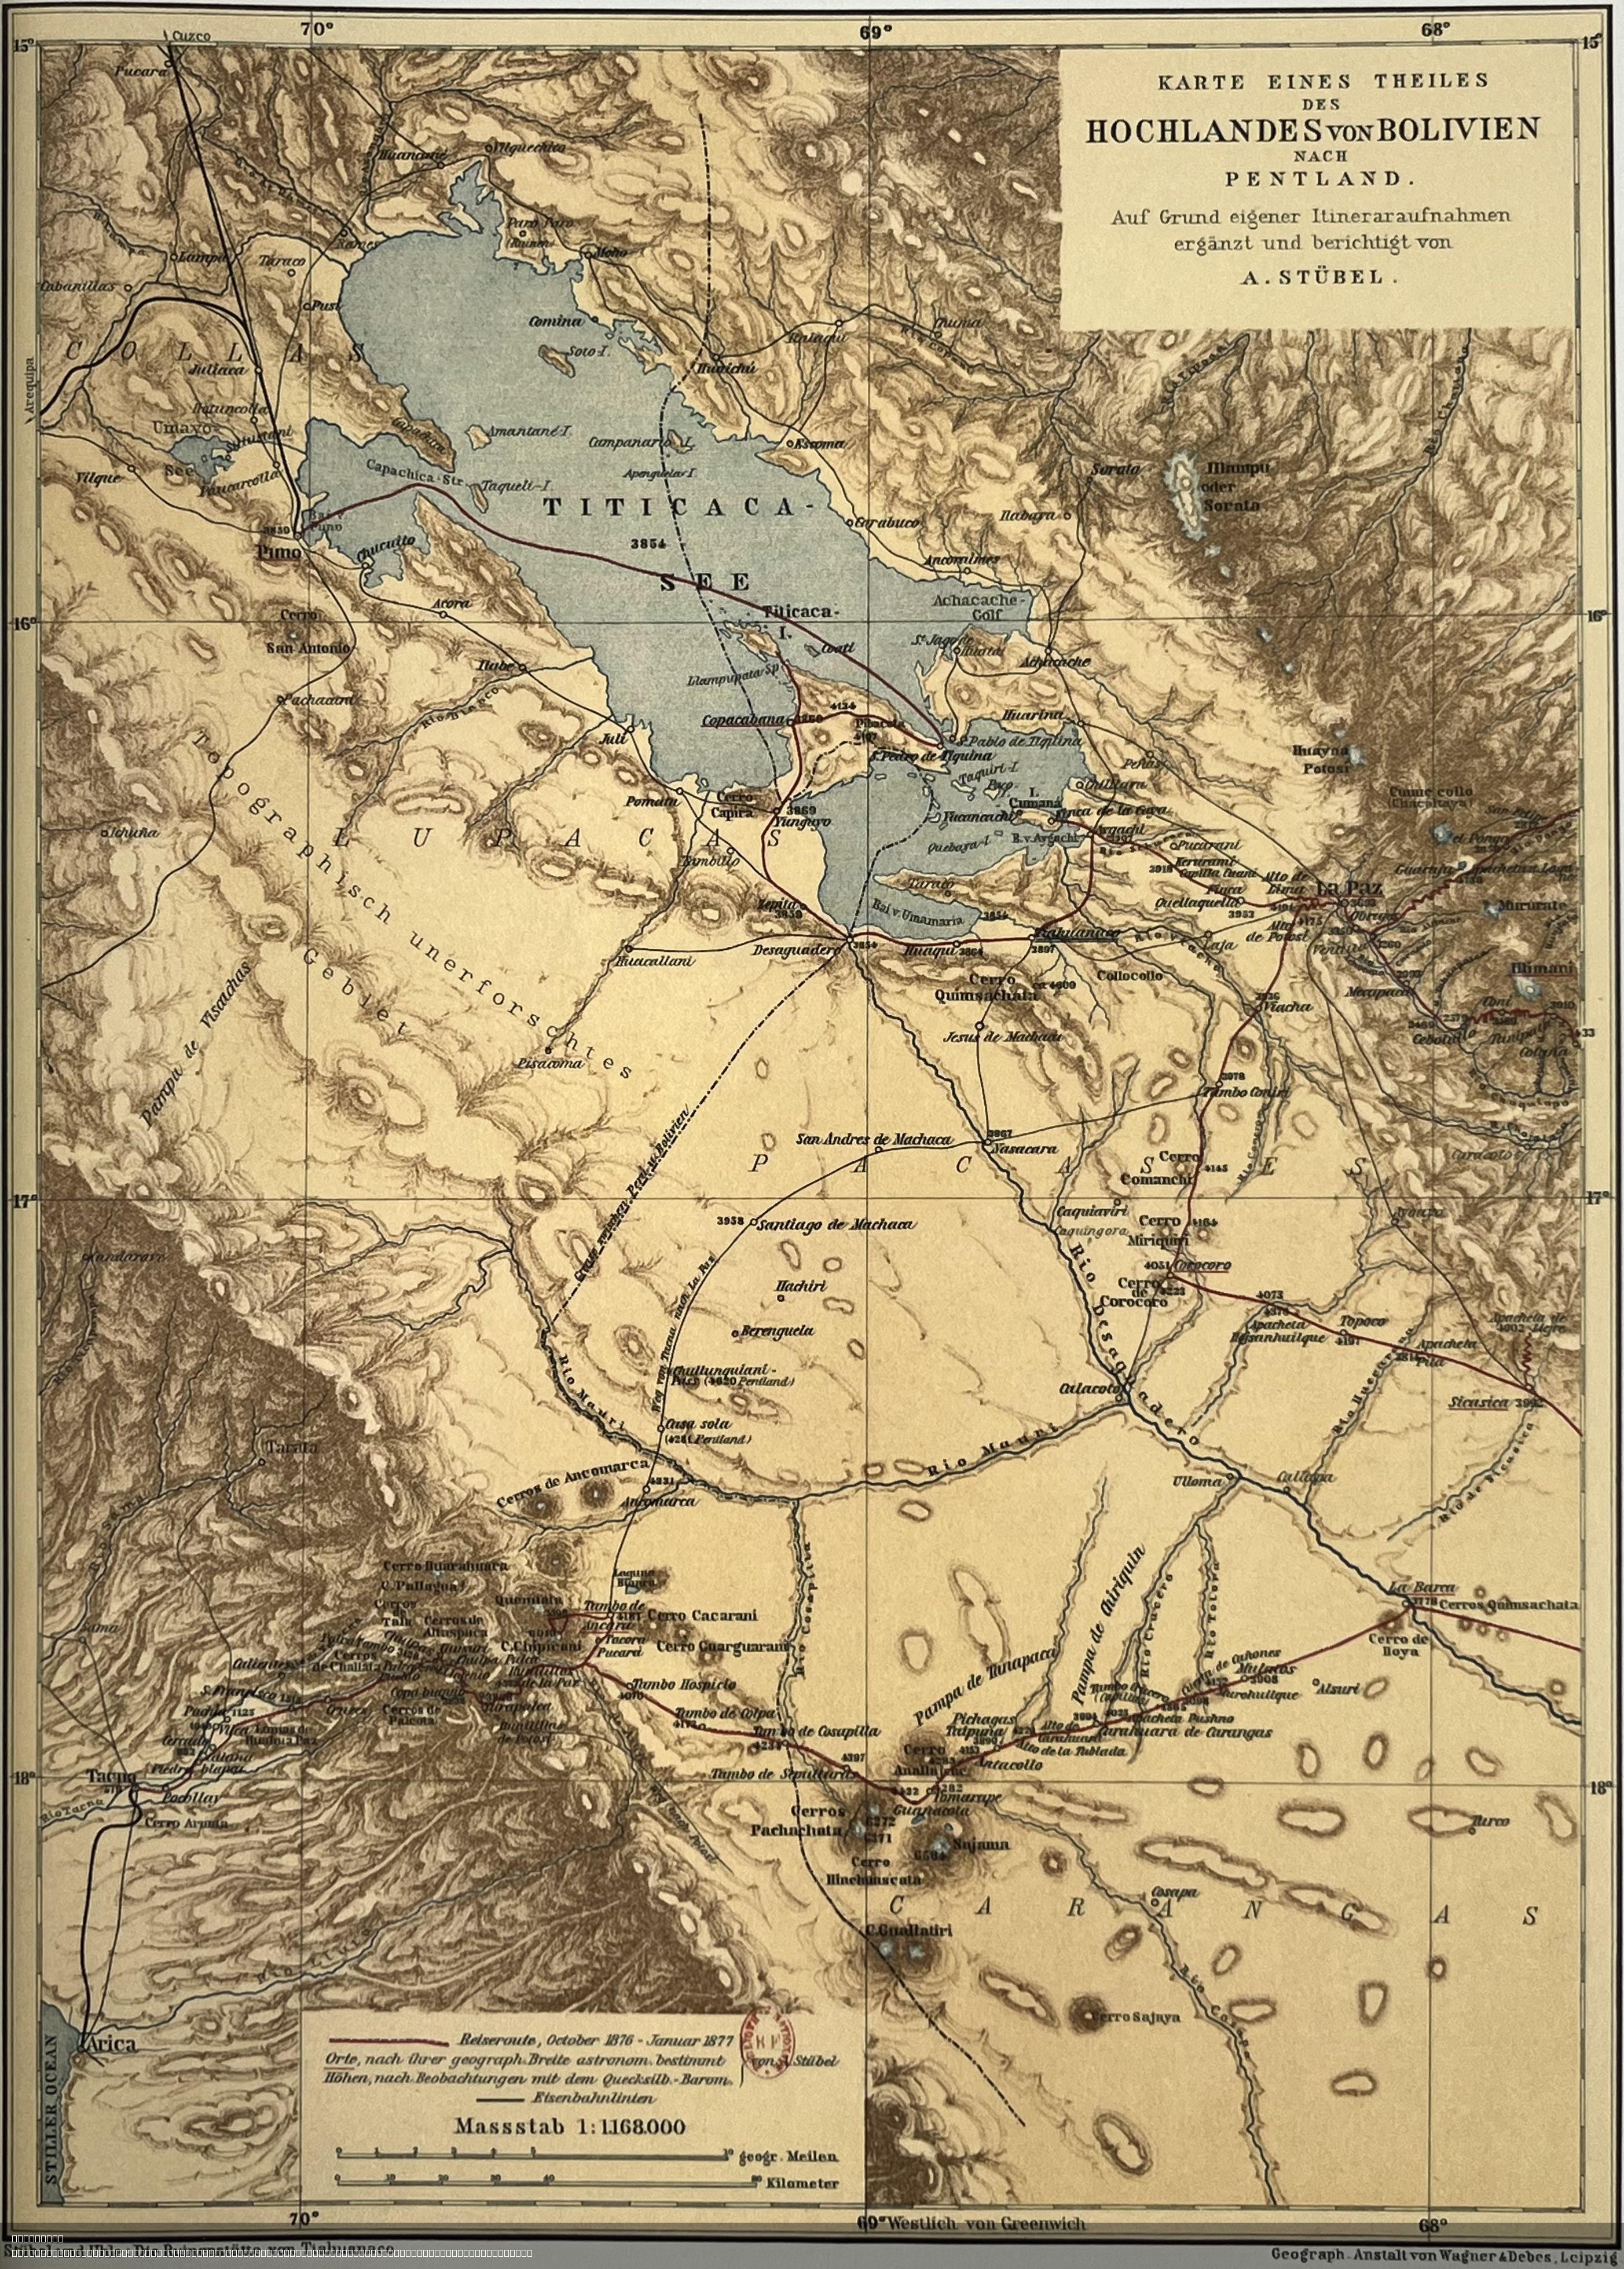
1876 Historical Map of Bolivian Highlands and Lake Titicaca
The 'German Historical Map of the Bolivian Highlands and Lake Titicaca Region (circa 1876–1877)' provides a detailed rep...
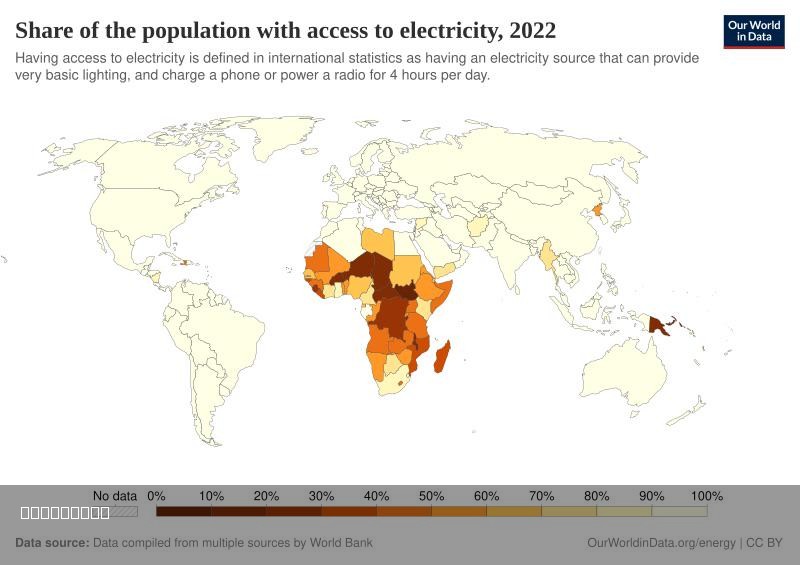
Access to Electricity in 2022 Map
The "Access to Electricity in 2022 Map" provides a clear visual representation of the global landscape regarding electri...