Improved Drinking Water Source Population Map 2025

Marcus Rodriguez
Historical Geography Expert
Marcus Rodriguez specializes in historical cartography and geographic data analysis. With a background in both history and geography, he brings unique...
Geographic Analysis
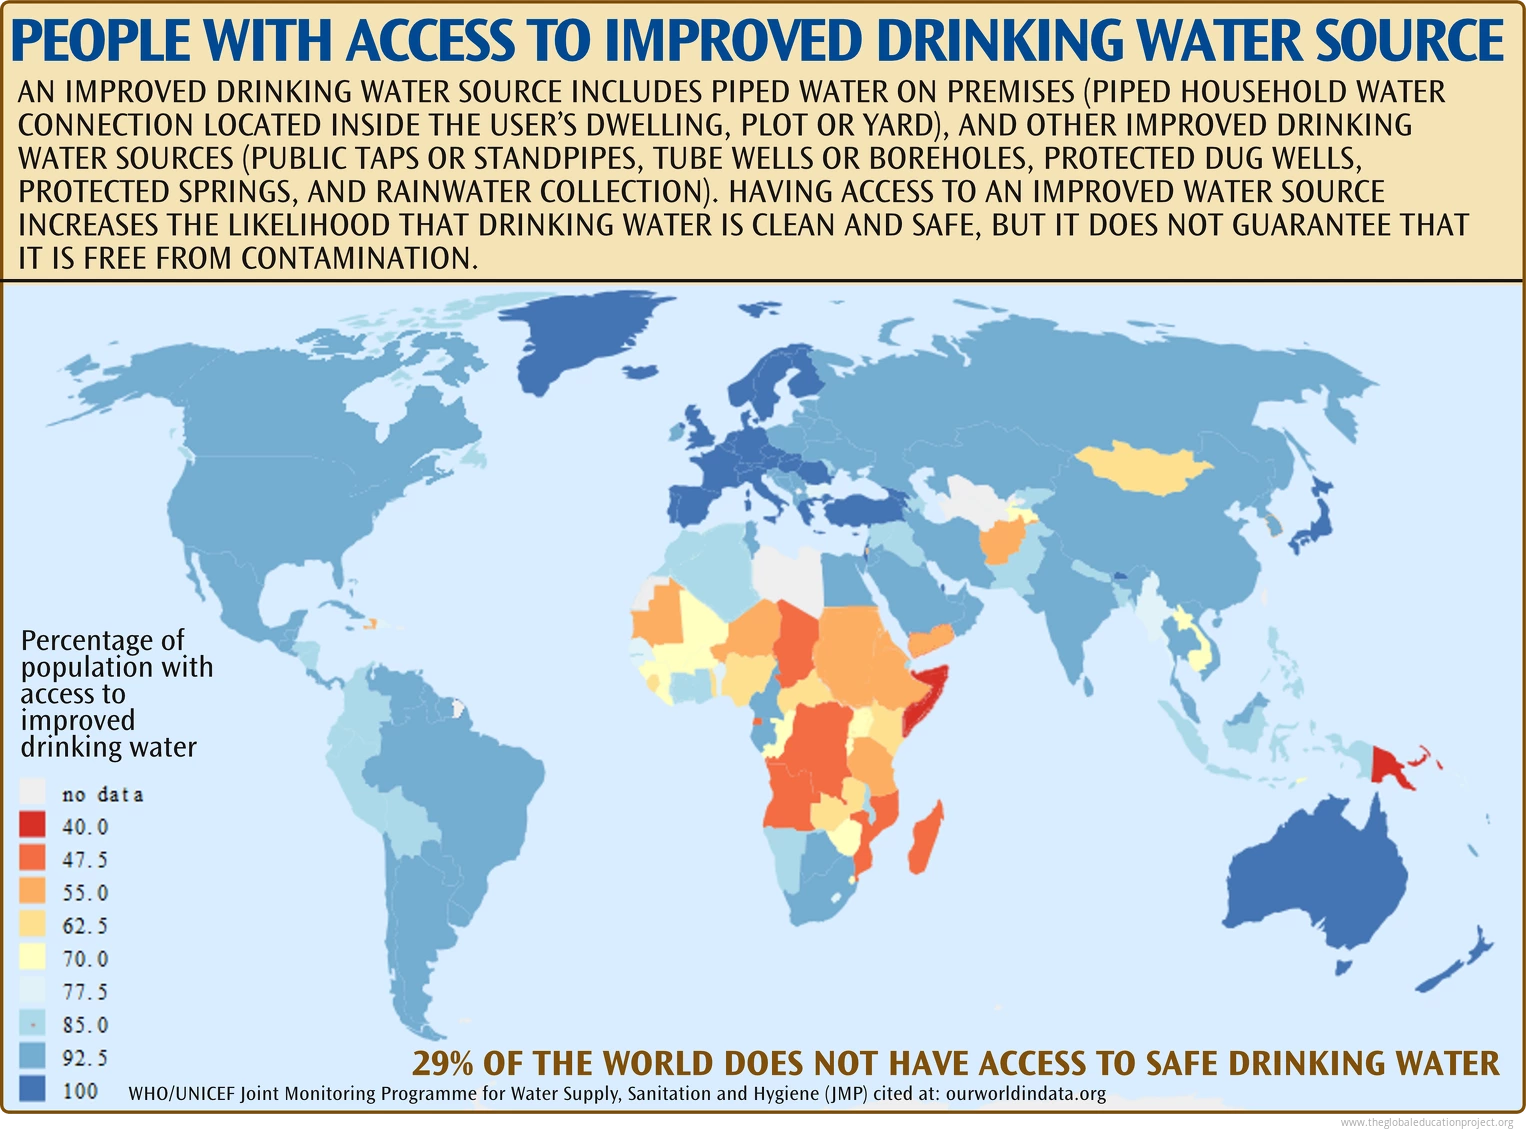
What This Map Shows
The "Percentage of Population with Improved Drinking Water Source [2025]" map provides a clear and comprehensive visualization of global access to improved drinking water sources. This crucial map highlights the disparities in access to clean water across different countries and regions. Improved drinking water sources are defined as those that are likely to provide safe drinking water, including piped water, boreholes, and protected springs. Understanding where these services are available is vital for addressing global health and development issues.
Deep Dive into Access to Improved Drinking Water
Access to clean drinking water is a fundamental human right and essential for health, development, and overall quality of life. The significance of improved drinking water sources cannot be overstated; they play a crucial role in preventing waterborne diseases, promoting economic growth, and enhancing educational opportunities. However, as we delve deeper into this topic, it is important to consider the factors that contribute to the availability of safe drinking water.
Globally, nearly 2 billion people still lack access to improved drinking water sources, primarily in developing nations. These figures highlight stark inequalities and the urgent need for targeted interventions. For example, in sub-Saharan Africa, only about 60% of the population has access to improved drinking water, with rural areas often facing the greatest challenges. In contrast, regions like Europe and North America boast nearly universal access.
What’s fascinating is the connection between socio-economic factors and access to clean water. Wealthier nations typically invest more in infrastructure, education, and technology, resulting in better water supply systems. Conversely, poorer countries often struggle with political instability, lack of resources, and inadequate infrastructure, which severely limits their ability to provide safe drinking water.
Moreover, climate change poses a significant threat to water availability. Changes in precipitation patterns, increased frequency of droughts, and pollution are all impacting the quality and quantity of water sources. For instance, in regions experiencing prolonged drought, the deterioration of water quality can lead to a dependence on unsafe sources, exacerbating health issues.
Regional Analysis
Regional disparities in access to improved drinking water sources are glaring. In regions like East Asia and the Pacific, over 80% of the population enjoys access to safe drinking water. Countries like China and Japan have made significant advancements in water management and infrastructure. However, in South Asia, the story is different. Despite some improvements, countries like India and Bangladesh still face significant challenges, particularly in rural areas where access can be limited.
In Africa, the map reveals alarming statistics. Countries such as Chad and South Sudan have some of the lowest percentages of populations with access to improved drinking water sources, often below 50%. The reasons for these stark differences are multifaceted, involving factors such as economic constraints, inadequate governmental policies, and ongoing conflicts that disrupt water supply systems.
Interestingly, even within countries, the disparities can be pronounced. Urban areas often have better access due to concentrated infrastructure investments, while rural communities may rely on unsafe sources. For instance, in Nigeria, urban centers like Lagos have relatively good water access, while northern regions struggle significantly.
Significance and Impact
Understanding access to improved drinking water sources is critical for public health, economic development, and environmental sustainability. The implications of this topic extend far beyond the map itself; they connect to global efforts aimed at achieving the Sustainable Development Goals (SDGs), specifically Goal 6, which aims to ensure availability and sustainable management of water and sanitation for all.
As we look toward the future, the trends indicate an urgent need for action. Water scarcity is projected to worsen, particularly in areas already vulnerable to climate change. By 2025, the demand for water is expected to exceed supply in many parts of the world, making it crucial for policymakers and communities to prioritize investments in water infrastructure and sustainable management practices.
In conclusion, the "Percentage of Population with Improved Drinking Water Source [2025]" map not only highlights the current state of global access to clean drinking water but also serves as a call to action. Addressing these disparities is essential for fostering health, equality, and sustainable development worldwide. Have you noticed how interconnected water access is with other pressing global issues? It's a reminder that solutions often require a collaborative approach, transcending borders and sectors.
Visualization Details
- Published
- September 30, 2025
- Views
- 30
Comments
Loading comments...