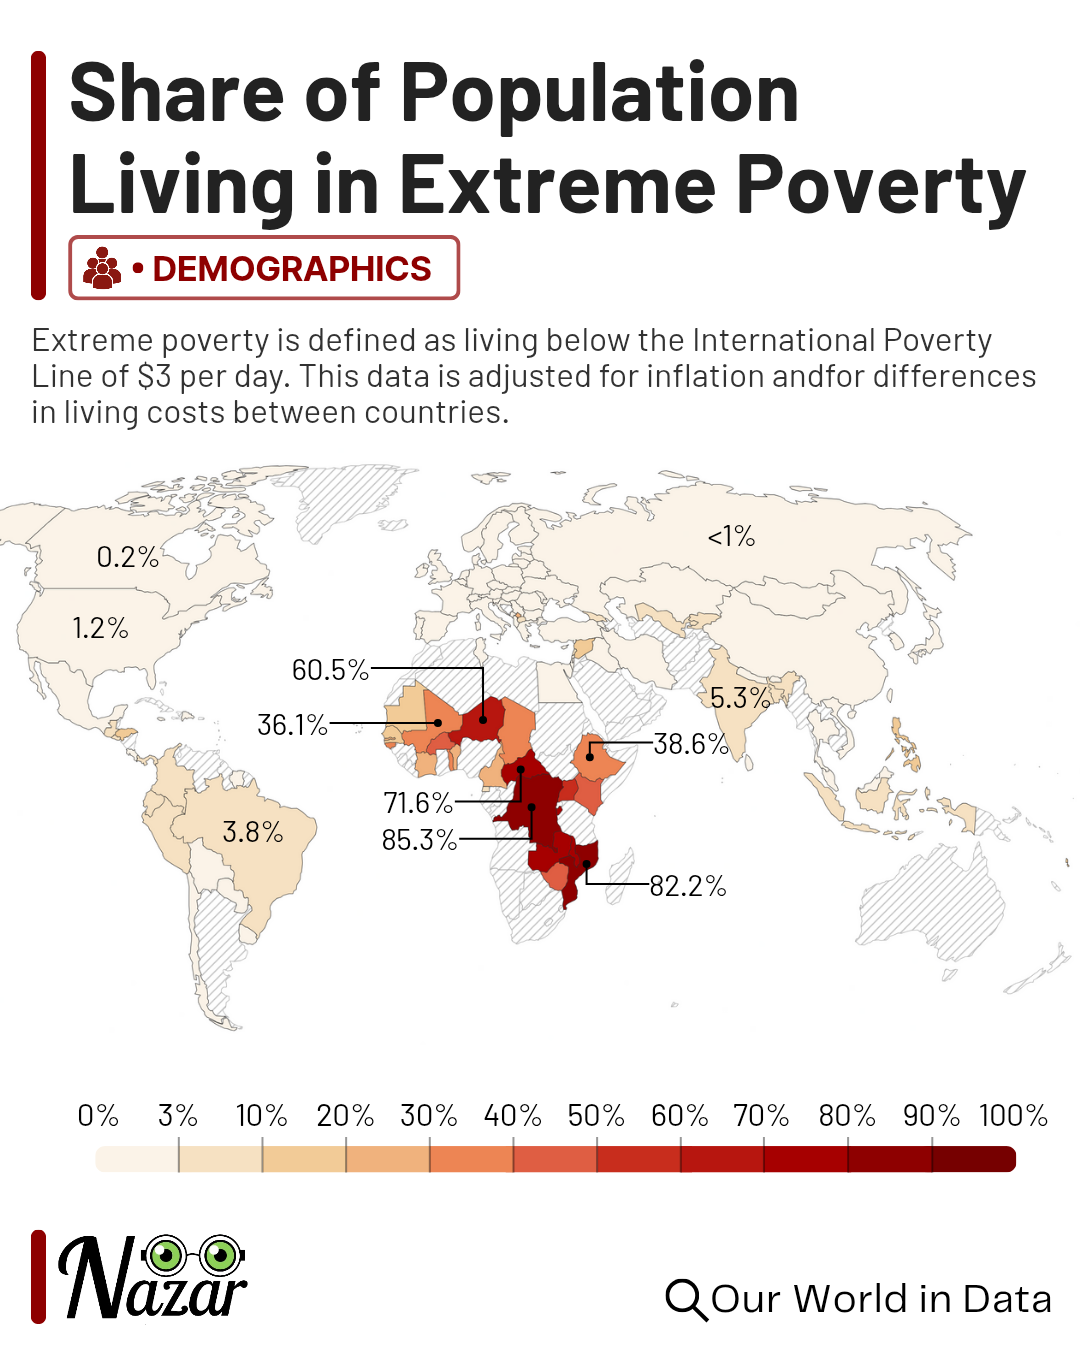
Extreme Poverty Rate by Country Map


Alex Cartwright
Senior Cartographer & GIS Specialist
Alex Cartwright is a renowned cartographer and geographic information systems specialist with over 15 years of experience in spatial analysis and data...
Geographic Analysis
What This Map Shows
The "Share of People Living in Extreme Poverty" map provides a stark visual representation of the percentage of individuals living on less than $1.90 a day, which is the international poverty line established by the World Bank. This visualization highlights the global distribution of extreme poverty, illustrating the regions where the struggle for basic necessities is most pronounced. The data presented reveals alarming disparities across continents, showcasing the areas where significant interventions and support are urgently needed.
Deep Dive into Extreme Poverty
Extreme poverty is not merely a statistic; it represents the harsh realities faced by millions of individuals and families around the world. The World Bank defines extreme poverty as living on less than $1.90 per day, which is insufficient to meet basic needs such as food, shelter, and healthcare. This poverty threshold is critical as it serves as a benchmark for measuring poverty levels across different countries and regions.
Interestingly, the factors contributing to extreme poverty are multifaceted. They can include economic instability, lack of access to education, gender inequality, and environmental challenges. For instance, in sub-Saharan Africa, issues like drought, political instability, and conflict exacerbate poverty levels, making it one of the most affected regions globally. What's fascinating is how interconnected these factors are; improving one area, such as education, can have a ripple effect on economic stability and health outcomes.
According to the latest statistics, as of 2023, nearly 700 million people—or around 9% of the world's population—live in extreme poverty. However, this figure is not uniformly distributed; while some regions have made significant strides in reducing poverty rates, others continue to struggle. For example, in East Asia and the Pacific, the extreme poverty rate has dropped significantly over the past few decades, largely due to rapid economic growth and effective poverty alleviation programs. In contrast, South Asia still grapples with high poverty rates, with many countries facing setbacks due to recent economic challenges and the COVID-19 pandemic.
The implications of extreme poverty extend beyond individual suffering. Communities trapped in poverty often experience higher levels of crime, lower educational attainment, and poorer health outcomes, creating a cycle that is difficult to break. Addressing extreme poverty is essential for achieving several of the United Nations Sustainable Development Goals (SDGs), particularly Goal 1, which aims to end poverty in all its forms everywhere.
Regional Analysis
Examining the map more closely reveals stark contrasts between regions. For example, sub-Saharan Africa is home to a significant proportion of the world's extreme poor, with countries like Nigeria and the Democratic Republic of the Congo exhibiting some of the highest rates. In Nigeria alone, approximately 40% of the population lives in extreme poverty, driven by factors such as economic mismanagement, widespread corruption, and ongoing conflicts in the northern regions.
In contrast, regions like Latin America and the Caribbean have seen a notable decline in poverty rates over the past two decades. Countries such as Brazil and Chile have implemented effective social safety nets and economic reforms, which have contributed to lifting millions out of poverty. However, the COVID-19 pandemic posed a setback, with many households falling back into poverty due to job losses and economic downturns.
Interestingly, the map also highlights the relative success of several Asian nations. Countries like China and Vietnam have made remarkable progress in poverty reduction, showcasing how targeted policies, economic growth, and international aid can lead to transformative change. China's approach, in particular, has been noted for its aggressive poverty alleviation strategies, lifting over 800 million people out of poverty since the late 1970s.
Significance and Impact
Understanding the distribution of extreme poverty is crucial for policymakers, NGOs, and international organizations working to alleviate poverty. The disparities highlighted in this map serve as a call to action, emphasizing the need for targeted interventions tailored to the unique challenges faced by different regions. For instance, while economic growth is vital, it must be inclusive to ensure that marginalized populations are not left behind.
Moreover, addressing extreme poverty is not just a moral obligation; it has far-reaching implications for global stability and development. Countries with high poverty rates often face social unrest, which can lead to broader geopolitical instability. As we look towards the future, it is imperative to recognize the interconnectedness of poverty reduction with other global issues such as climate change, health crises, and education.
In conclusion, the "Share of People Living in Extreme Poverty" map serves as a poignant reminder of the work that lies ahead. The fight against extreme poverty is ongoing, and understanding its geographical manifestations is essential for crafting effective solutions. By focusing efforts on the regions most affected, we can collectively strive towards a world where extreme poverty is a relic of the past, not a present reality.
Visualization Details
- Published
- September 24, 2025
- Views
- 40
Comments
Loading comments...