economic inequality Maps
6 geographic visualizations tagged with "economic inequality"
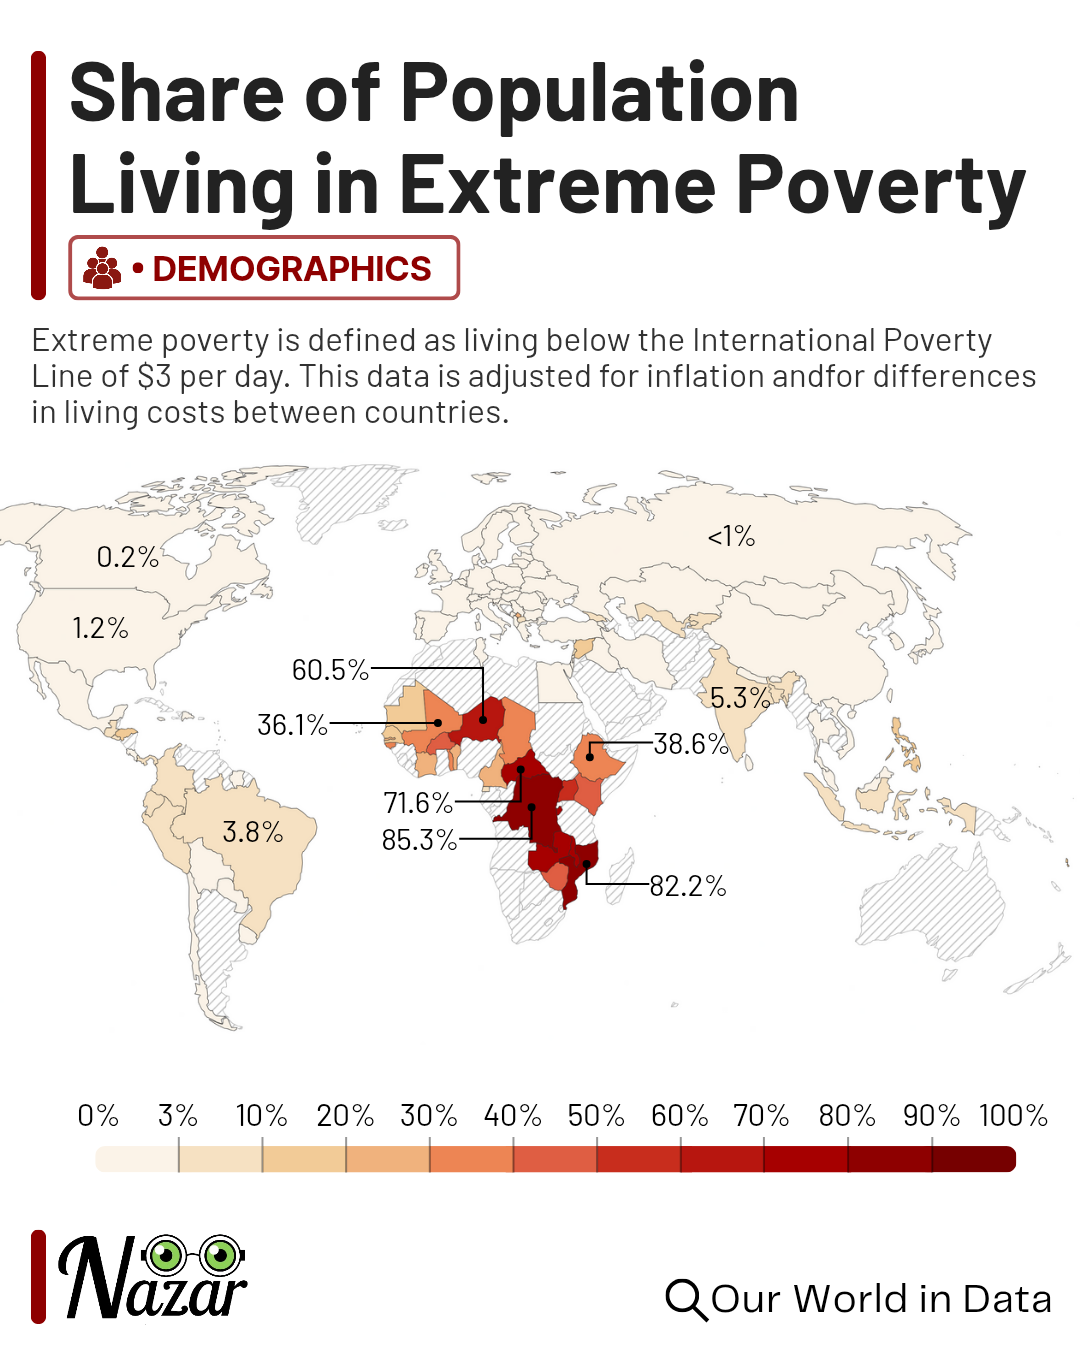
Extreme Poverty Rate by Country Map
The "Share of People Living in Extreme Poverty" map provides a stark visual representation of the percentage of individu...
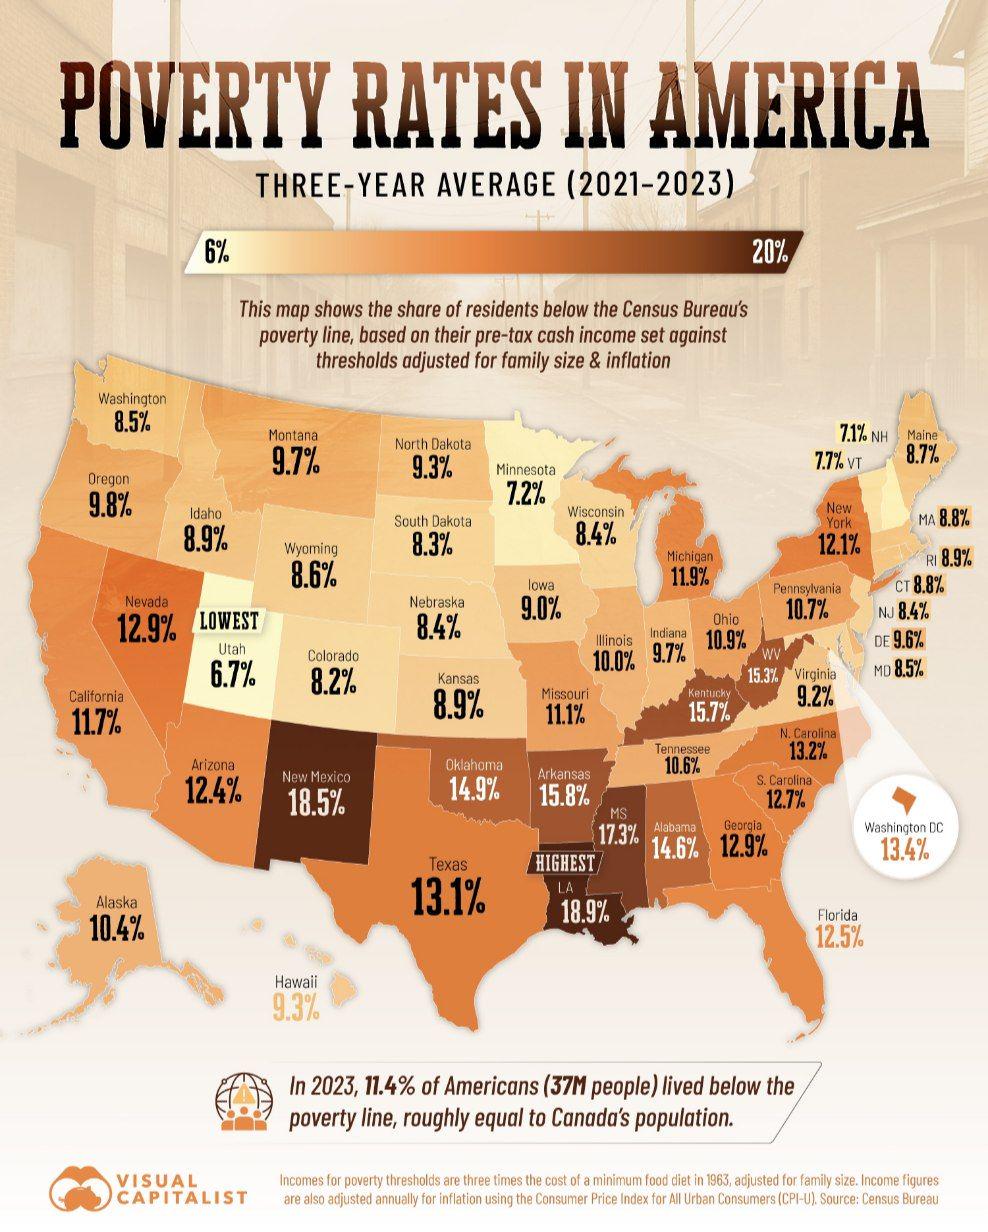
Poverty Rates in US Map
The "Poverty Rates in US Map" presents a visual representation of poverty levels across the United States, highlighting ...
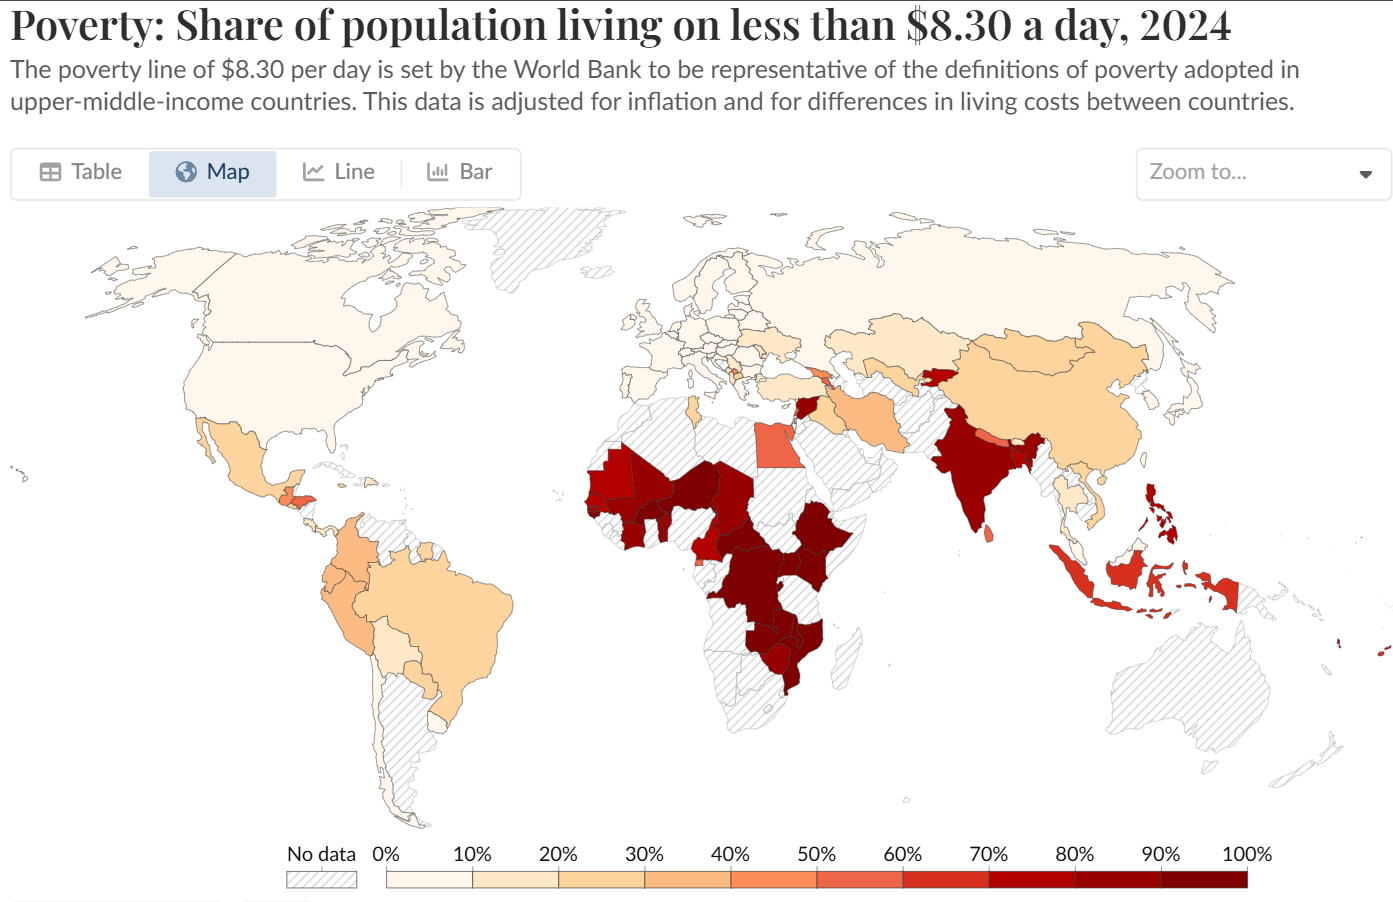
% of People Living Under $8.30 a Day Map
This map provides a visual representation of the percentage of people living on less than $8.30 per day across different...
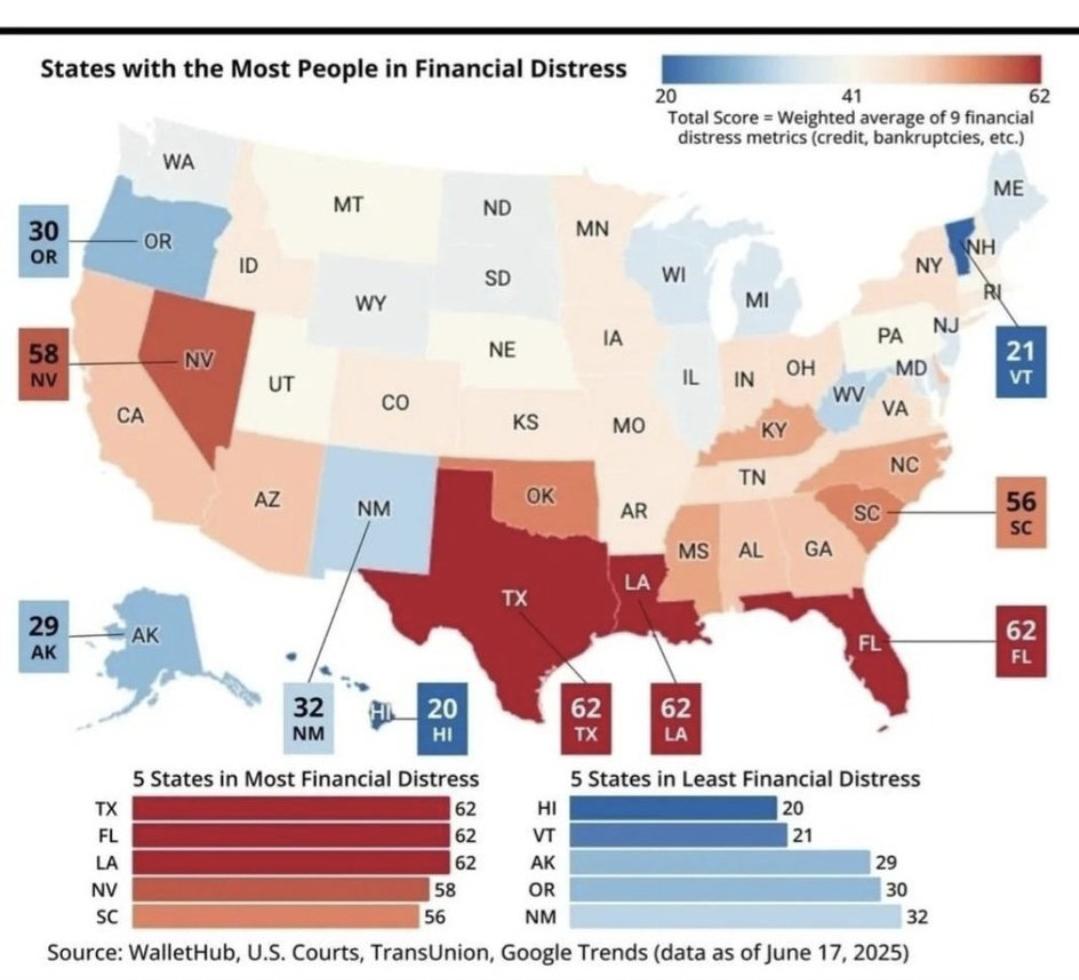
States with Most People in Financial Distress Map
This map illustrates the states with the highest numbers of individuals experiencing financial distress. It highlights t...
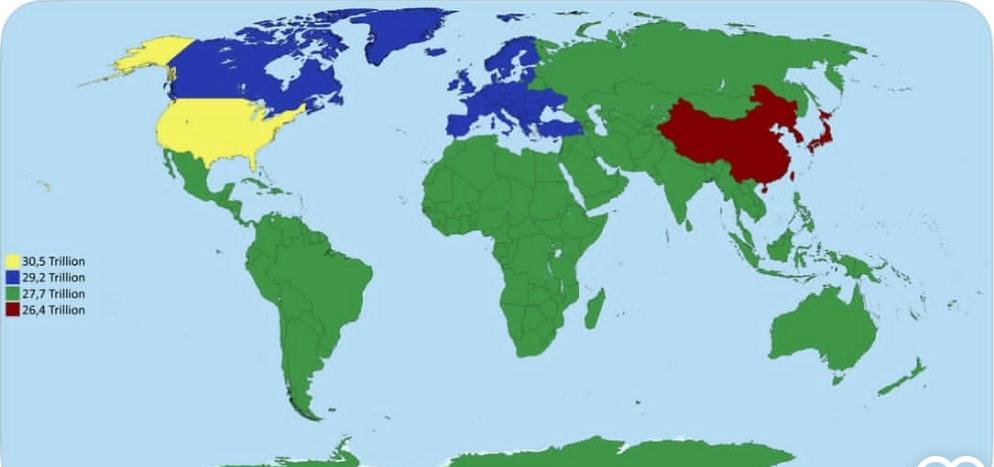
Equal GDP Distribution Map by Region
The visualization titled "Dividing the World into 4 Regions with Equal GDP" presents a unique perspective on the global ...
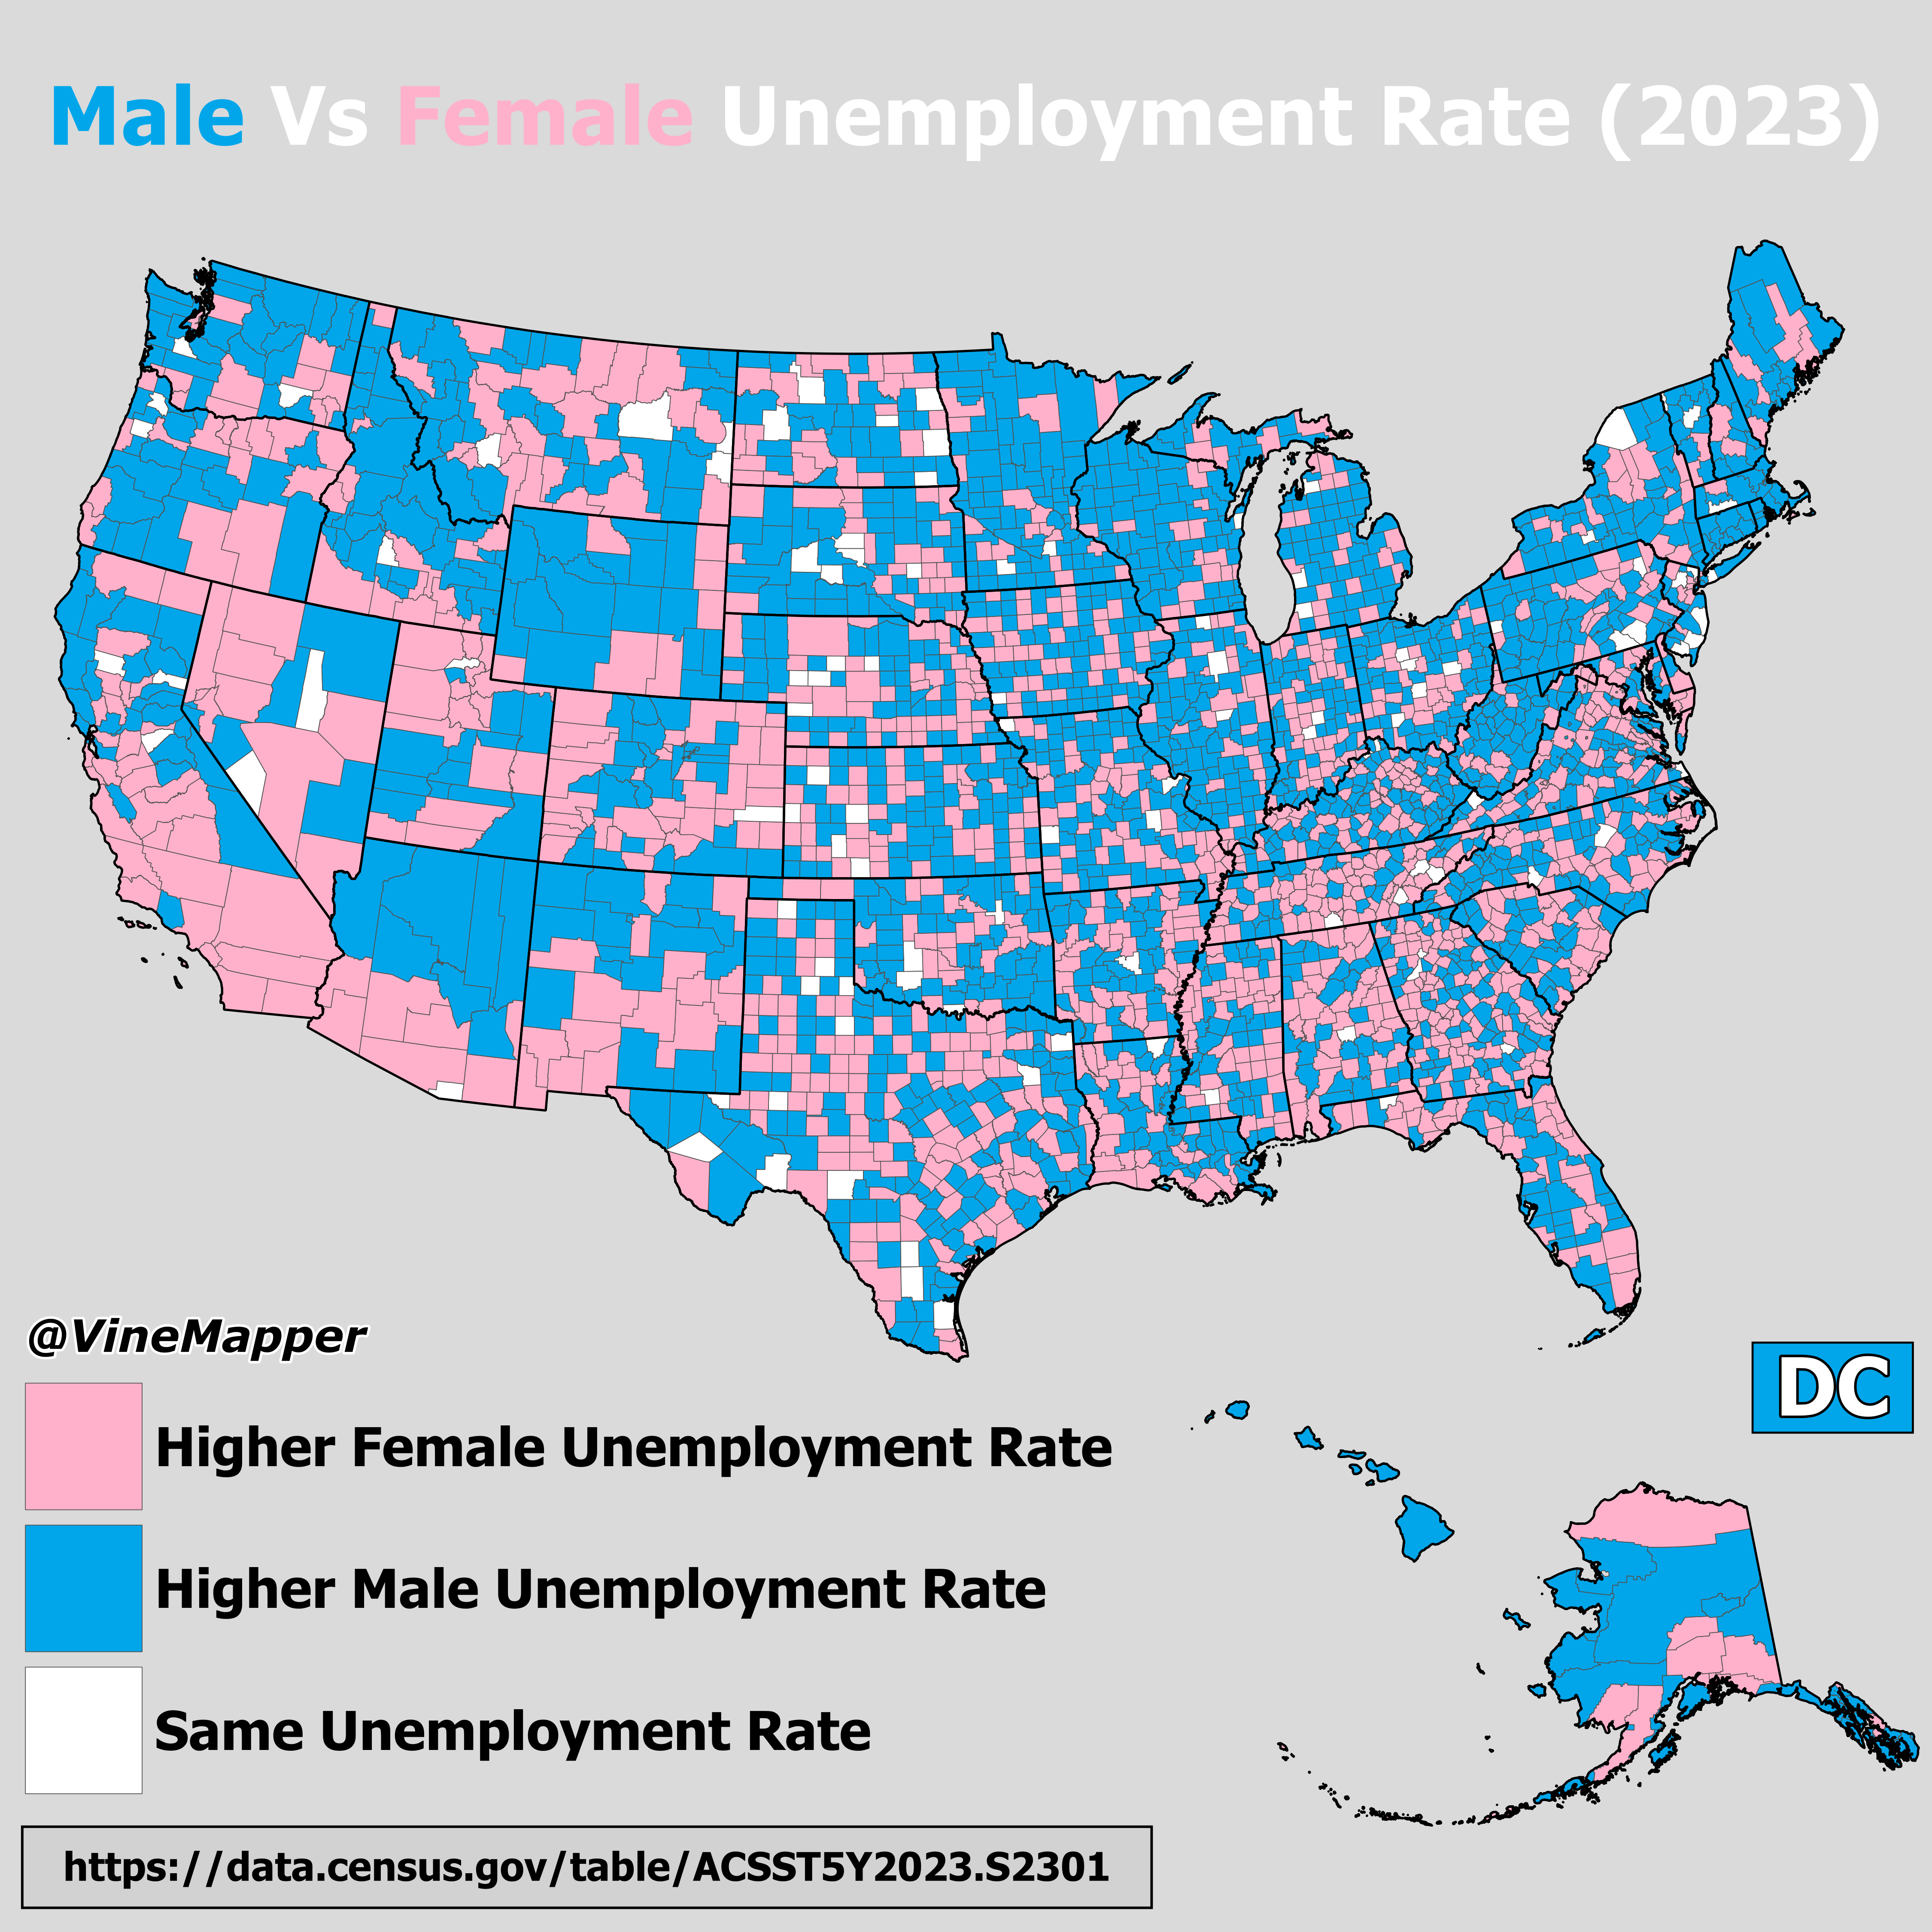
Male Vs Female Unemployment Rate Per County Map
The "Male Vs Female Unemployment Rate Per County (2023)" map provides a clear and informative snapshot of unemployment d...