Poverty Rates in US Map

Marcus Rodriguez
Historical Geography Expert
Marcus Rodriguez specializes in historical cartography and geographic data analysis. With a background in both history and geography, he brings unique...
Geographic Analysis
What This Map Shows
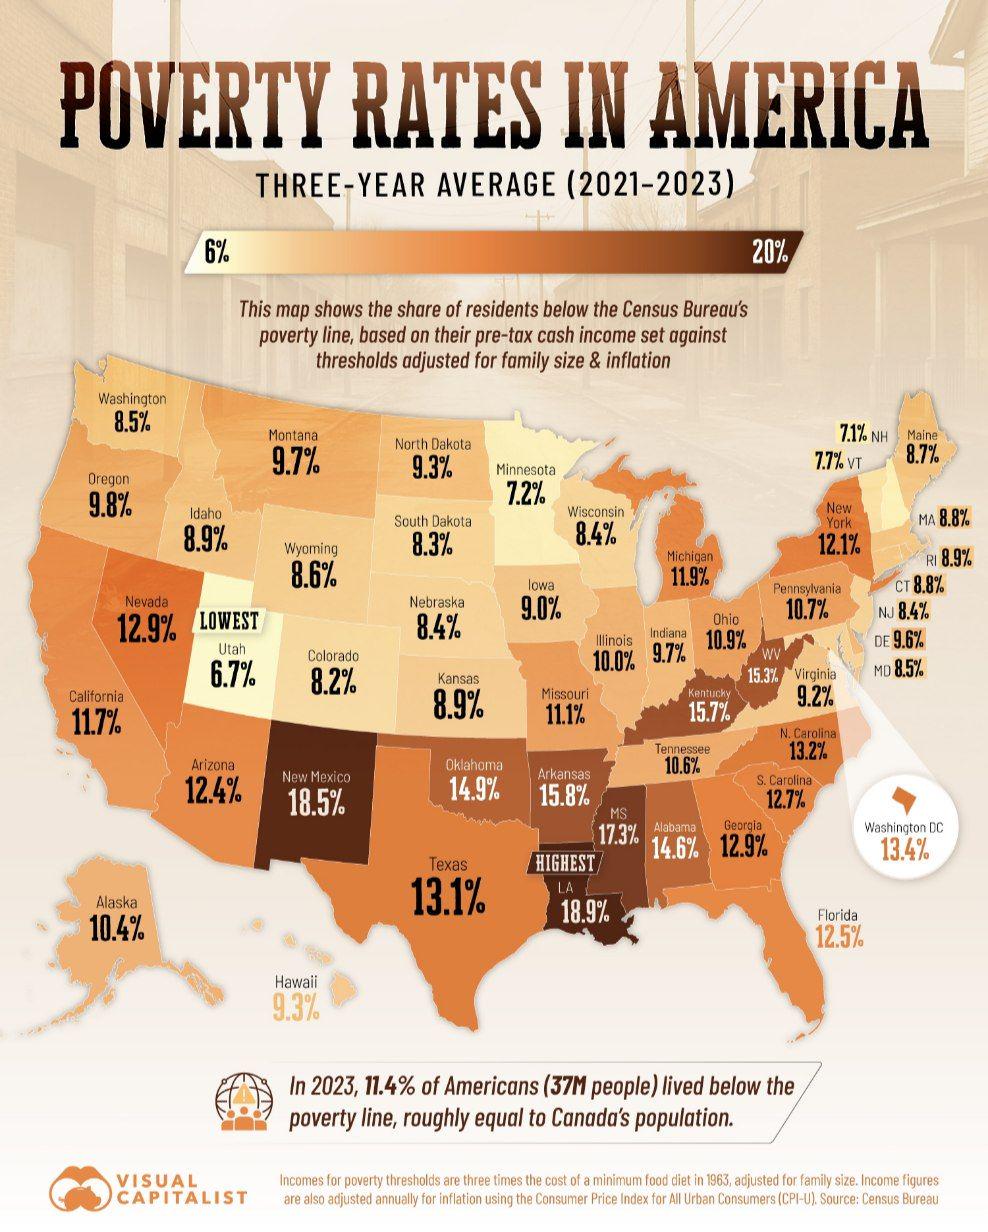
The "Poverty Rates in US Map" presents a visual representation of poverty levels across the United States, highlighting the percentage of individuals living below the federal poverty line in various states and regions. This visualization serves as a crucial tool for understanding socio-economic disparities and the geographic distribution of poverty, making it clear that this issue is not evenly spread across the country. As we delve deeper into the topic of poverty, it’s essential to recognize the complexities surrounding this pressing social challenge.
Deep Dive into Poverty in the United States
Poverty is a multifaceted issue that affects millions of Americans, shaping their access to basic necessities such as food, shelter, and healthcare. As of the latest statistics, approximately 11.4% of the U.S. population lives in poverty, according to the U.S. Census Bureau. This figure can vary significantly depending on location, demographic factors, and economic conditions.
Interestingly, poverty is often concentrated in specific geographic areas, particularly urban centers, rural regions, and certain demographic groups. For instance, children are disproportionately affected by poverty, with about 16% of American children living in poverty—this statistic raises alarms about future generations and the cycle of disadvantage.
One of the key factors contributing to poverty is education. Areas with lower educational attainment often see higher rates of poverty. According to the National Center for Education Statistics, individuals without a high school diploma are significantly more likely to experience poverty compared to those with higher education levels. This correlation underscores the importance of educational opportunities in breaking the cycle of poverty.
Moreover, employment plays a critical role in determining poverty levels. Regions with high unemployment rates, often influenced by the decline of manufacturing jobs or the lack of economic diversification, tend to show higher poverty rates. For example, parts of the Rust Belt, which have historically relied on manufacturing, have seen significant economic challenges and, consequently, elevated poverty levels.
Regional Analysis
When examining the map, distinct regional patterns emerge. The Southern states, particularly Mississippi, Louisiana, and Arkansas, consistently rank among the highest in poverty rates, often exceeding 18%. These states face unique challenges such as limited access to quality education, healthcare disparities, and historically entrenched economic issues that hinder growth.
In contrast, many Northeastern states, such as Maryland and New Hampshire, report considerably lower poverty rates, often below 8%. This disparity can be attributed to various factors, including higher average incomes, better access to education, and a more robust job market. However, even within these states, there are pockets of poverty that illustrate how localized challenges can exist even in wealthier regions.
Interestingly, urban areas often have both high poverty and high wealth concentrations. Cities like San Francisco and New York showcase extreme wealth disparities, with significant portions of their populations living in poverty despite the overall affluence of the area. This juxtaposition raises questions about the effectiveness of current policies aimed at alleviating poverty and whether they adequately address the needs of the most vulnerable populations.
Significance and Impact
Understanding poverty rates and their geographic distribution is vital for policymakers, social workers, and communities. Addressing poverty is not just a matter of charity; it has profound implications for social stability, public health, and economic growth. The consequences of poverty extend beyond the individual, affecting entire communities and leading to increased healthcare costs, lower educational attainment, and higher crime rates.
Current trends show that poverty rates can be influenced by economic policies, social programs, and external factors such as the COVID-19 pandemic, which has exacerbated existing inequalities. As we look to the future, ongoing economic recovery efforts and targeted interventions will be necessary to address the root causes of poverty and to implement effective solutions. The disparities highlighted in the map remind us that poverty is a complex, systemic issue that requires a concerted effort from all sectors of society to resolve.
In conclusion, the "Poverty Rates in US Map" serves as a crucial reminder of the socio-economic challenges faced by many Americans. It encourages us to reflect on the policies and practices needed to create a more equitable society, ensuring that everyone has the opportunity to thrive.
Visualization Details
- Published
- August 30, 2025
- Views
- 72
Comments
Loading comments...