Median Age of Housing Units in USA Map

Alex Cartwright
Senior Cartographer & GIS Specialist
Alex Cartwright is a renowned cartographer and geographic information systems specialist with over 15 years of experience in spatial analysis and data...
Geographic Analysis
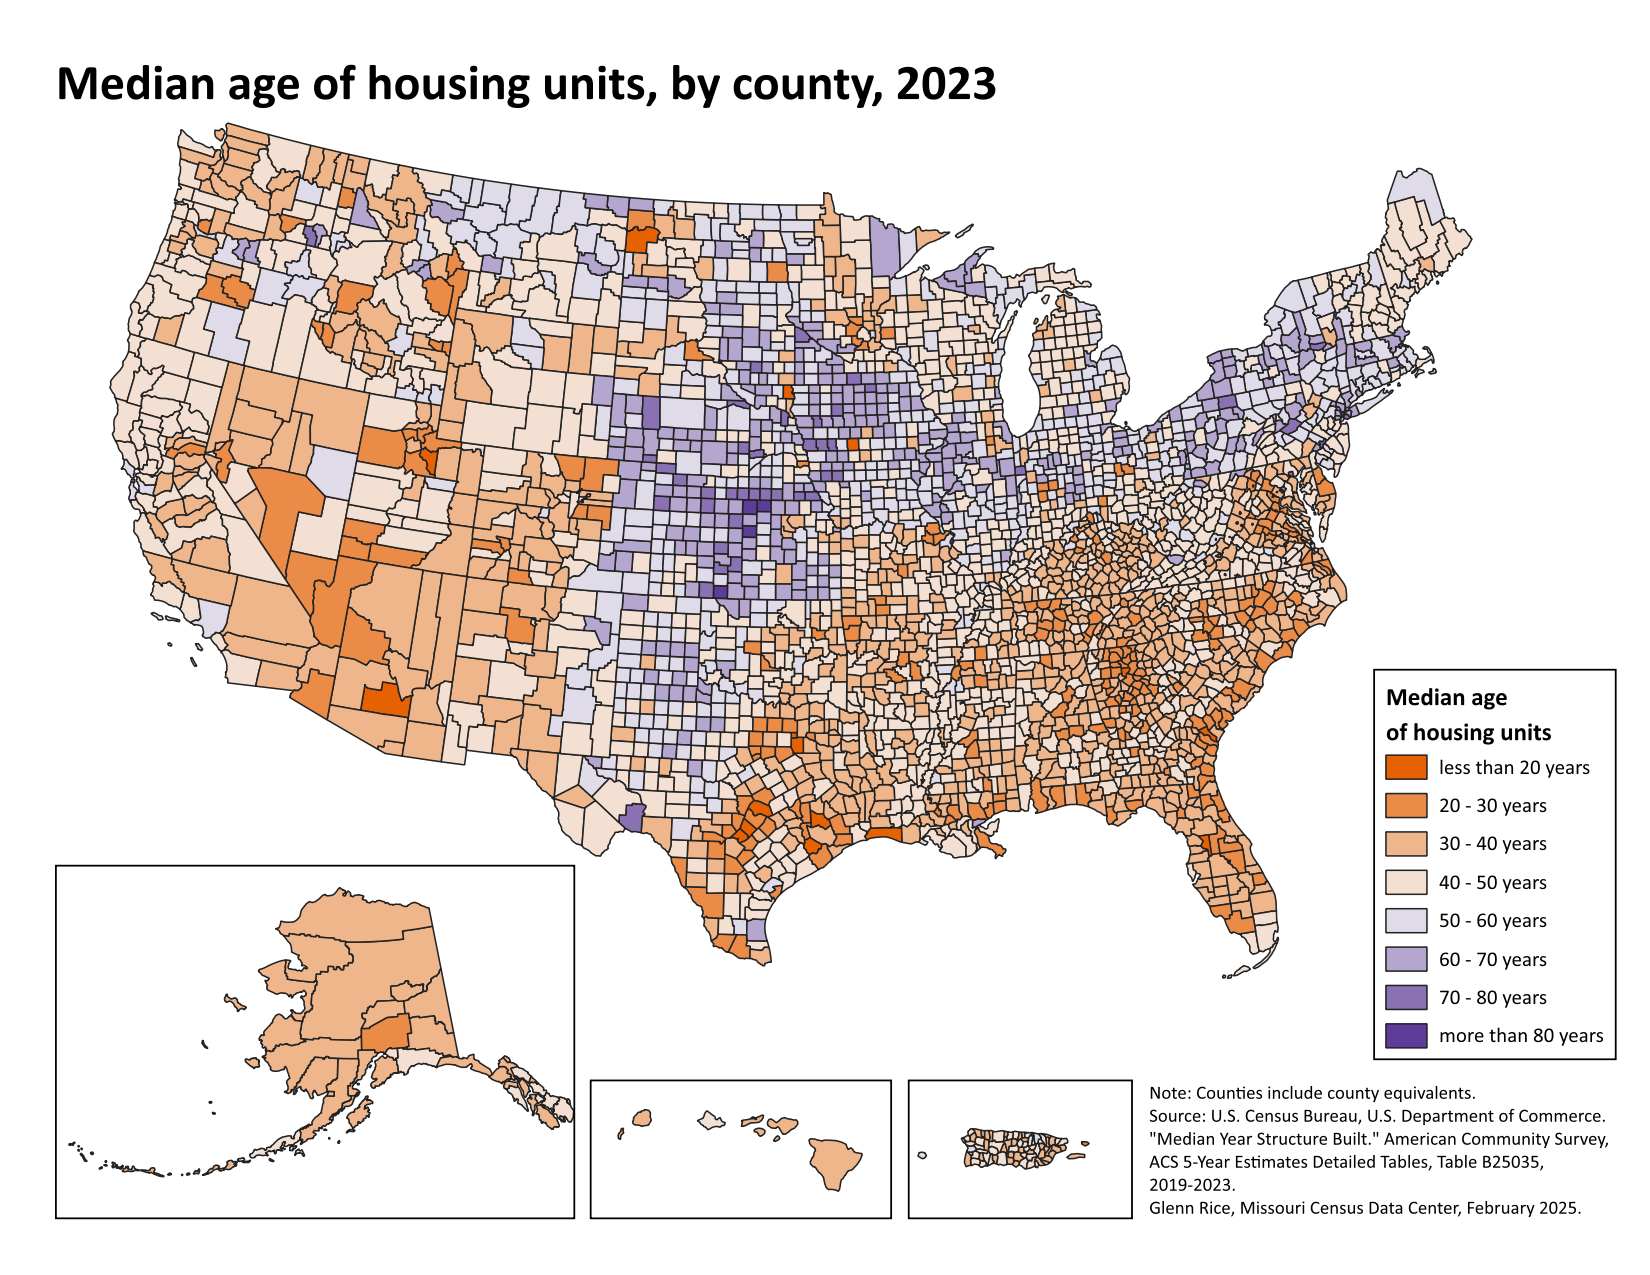
What This Map Shows
This map visualizes the median age of housing units across the United States by county in 2023. It provides a clear snapshot of how old or new the housing stock is in different regions, revealing patterns of urban development, economic prosperity, and demographic shifts. The darker areas on the map indicate older housing units, while lighter areas suggest newer constructions. This visualization not only highlights age disparities but also invites us to think about how these factors influence communities and their growth.
Deep Dive into Housing Units
The median age of housing units is a crucial metric that reflects the overall health of the housing market in any given area. It provides insights into the architectural trends of a region, the economic conditions surrounding housing development, and the lifestyle preferences of its inhabitants. For example, a county with a high median age of housing units may indicate that the area has not seen significant new construction in recent years. This could be due to various factors, including economic downturns, zoning laws, or even shifts in population demographics.
Interestingly, the median age of housing varies dramatically across the United States. In densely populated urban areas, such as New York City or San Francisco, you might find a mix of very old buildings and new high-rises. However, in suburban or rural areas, the median age may skew older as development began many decades ago and has not kept pace with urban growth. As of 2023, the national median age of housing units stands at about 40 years, but this figure masks considerable regional variation.
For instance, counties in the Northeast, such as Massachusetts or Pennsylvania, often feature a higher median age due to their historical significance and older population centers. In contrast, areas in the Southwest, like Arizona and Nevada, typically have newer housing stock as these states have experienced rapid growth and development over the last few decades. This kind of demographic analysis can reveal a lot about economic vitality and urban planning.
The implications of housing age extend beyond mere statistics. Older housing units may require more maintenance and renovation, impacting local economies and property values. They can also reflect a community’s social fabric, as older neighborhoods often have established cultural identities, whereas newer developments might cater to more transient populations.
Regional Analysis
When examining the map, you’ll notice distinct patterns that vary by region. For example, the South, particularly states like Texas and Florida, shows a lower median age of housing units, suggesting a trend towards new construction driven by an influx of residents seeking warmer climates and job opportunities. In contrast, states like New York or Illinois present a higher median age, indicative of long-established urban environments where preservation efforts are in place.
Moreover, the Midwest showcases a mix, with some counties exhibiting older homes, particularly in industrial cities like Detroit, while others near burgeoning tech hubs, such as in Minnesota, are seeing new developments. Coastal areas, often subject to climate change and natural disasters, face unique challenges as they balance maintaining older housing while developing resilient infrastructure.
Interestingly, some counties with a high median age are initiating revitalization projects to modernize older housing and attract new residents. For example, areas in Ohio and Michigan are seeing investments aimed at upgrading their aging housing stock to meet contemporary standards and preferences, which can help rejuvenate these communities.
Significance and Impact
Understanding the median age of housing units is vital for several reasons. It affects everything from local economies to social demographics. Areas with older housing often face different challenges, such as declining property values or increased maintenance costs, which can deter potential buyers and investors. Conversely, regions with newer housing units may attract younger families and professionals, contributing to a vibrant local economy.
The implications of these trends are broad. As cities evolve, planners and policymakers must consider the age of housing to address issues like affordable housing, urban sprawl, and infrastructure development. The current trend indicates a growing emphasis on sustainable and affordable housing solutions, especially in urban areas where space is limited, and demand is high.
In conclusion, the median age of housing units in the USA, as illustrated by this map, offers a window into the broader narrative of American life, highlighting the complex interplay between geography, history, and socio-economic factors. As these dynamics continue to evolve, they will undoubtedly shape the future of housing and communities across the nation.
Visualization Details
- Published
- October 30, 2025
- Views
- 2
Comments
Loading comments...