real estate Maps
16 geographic visualizations tagged with "real estate"
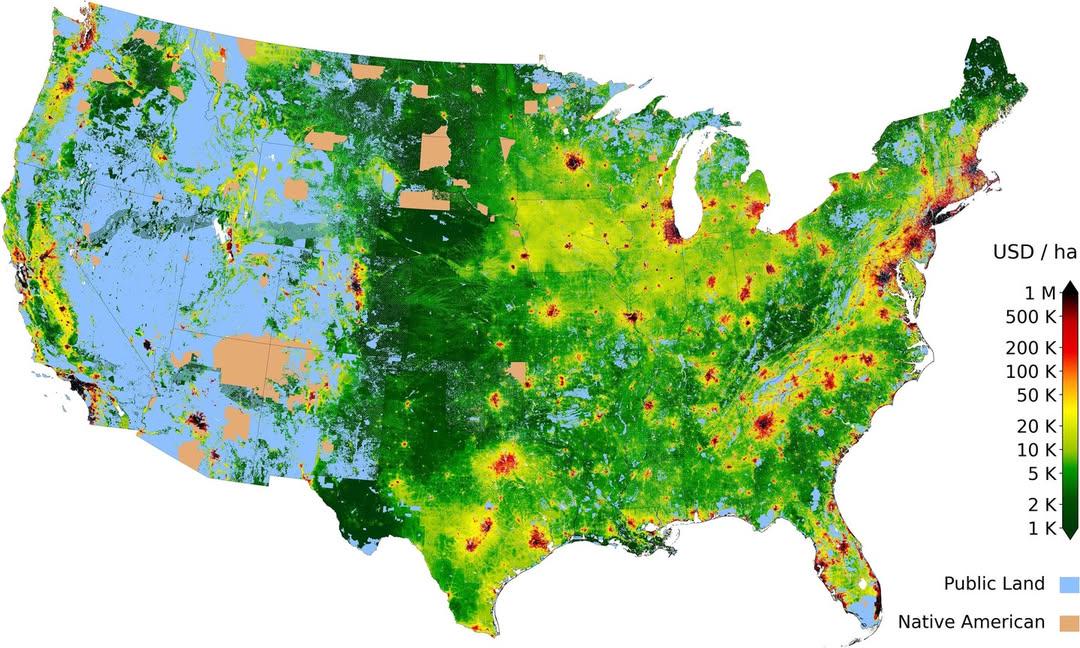
Land Prices Across America Map
The map titled "The Most and Least Expensive Land in America" provides a detailed overview of land prices across various...
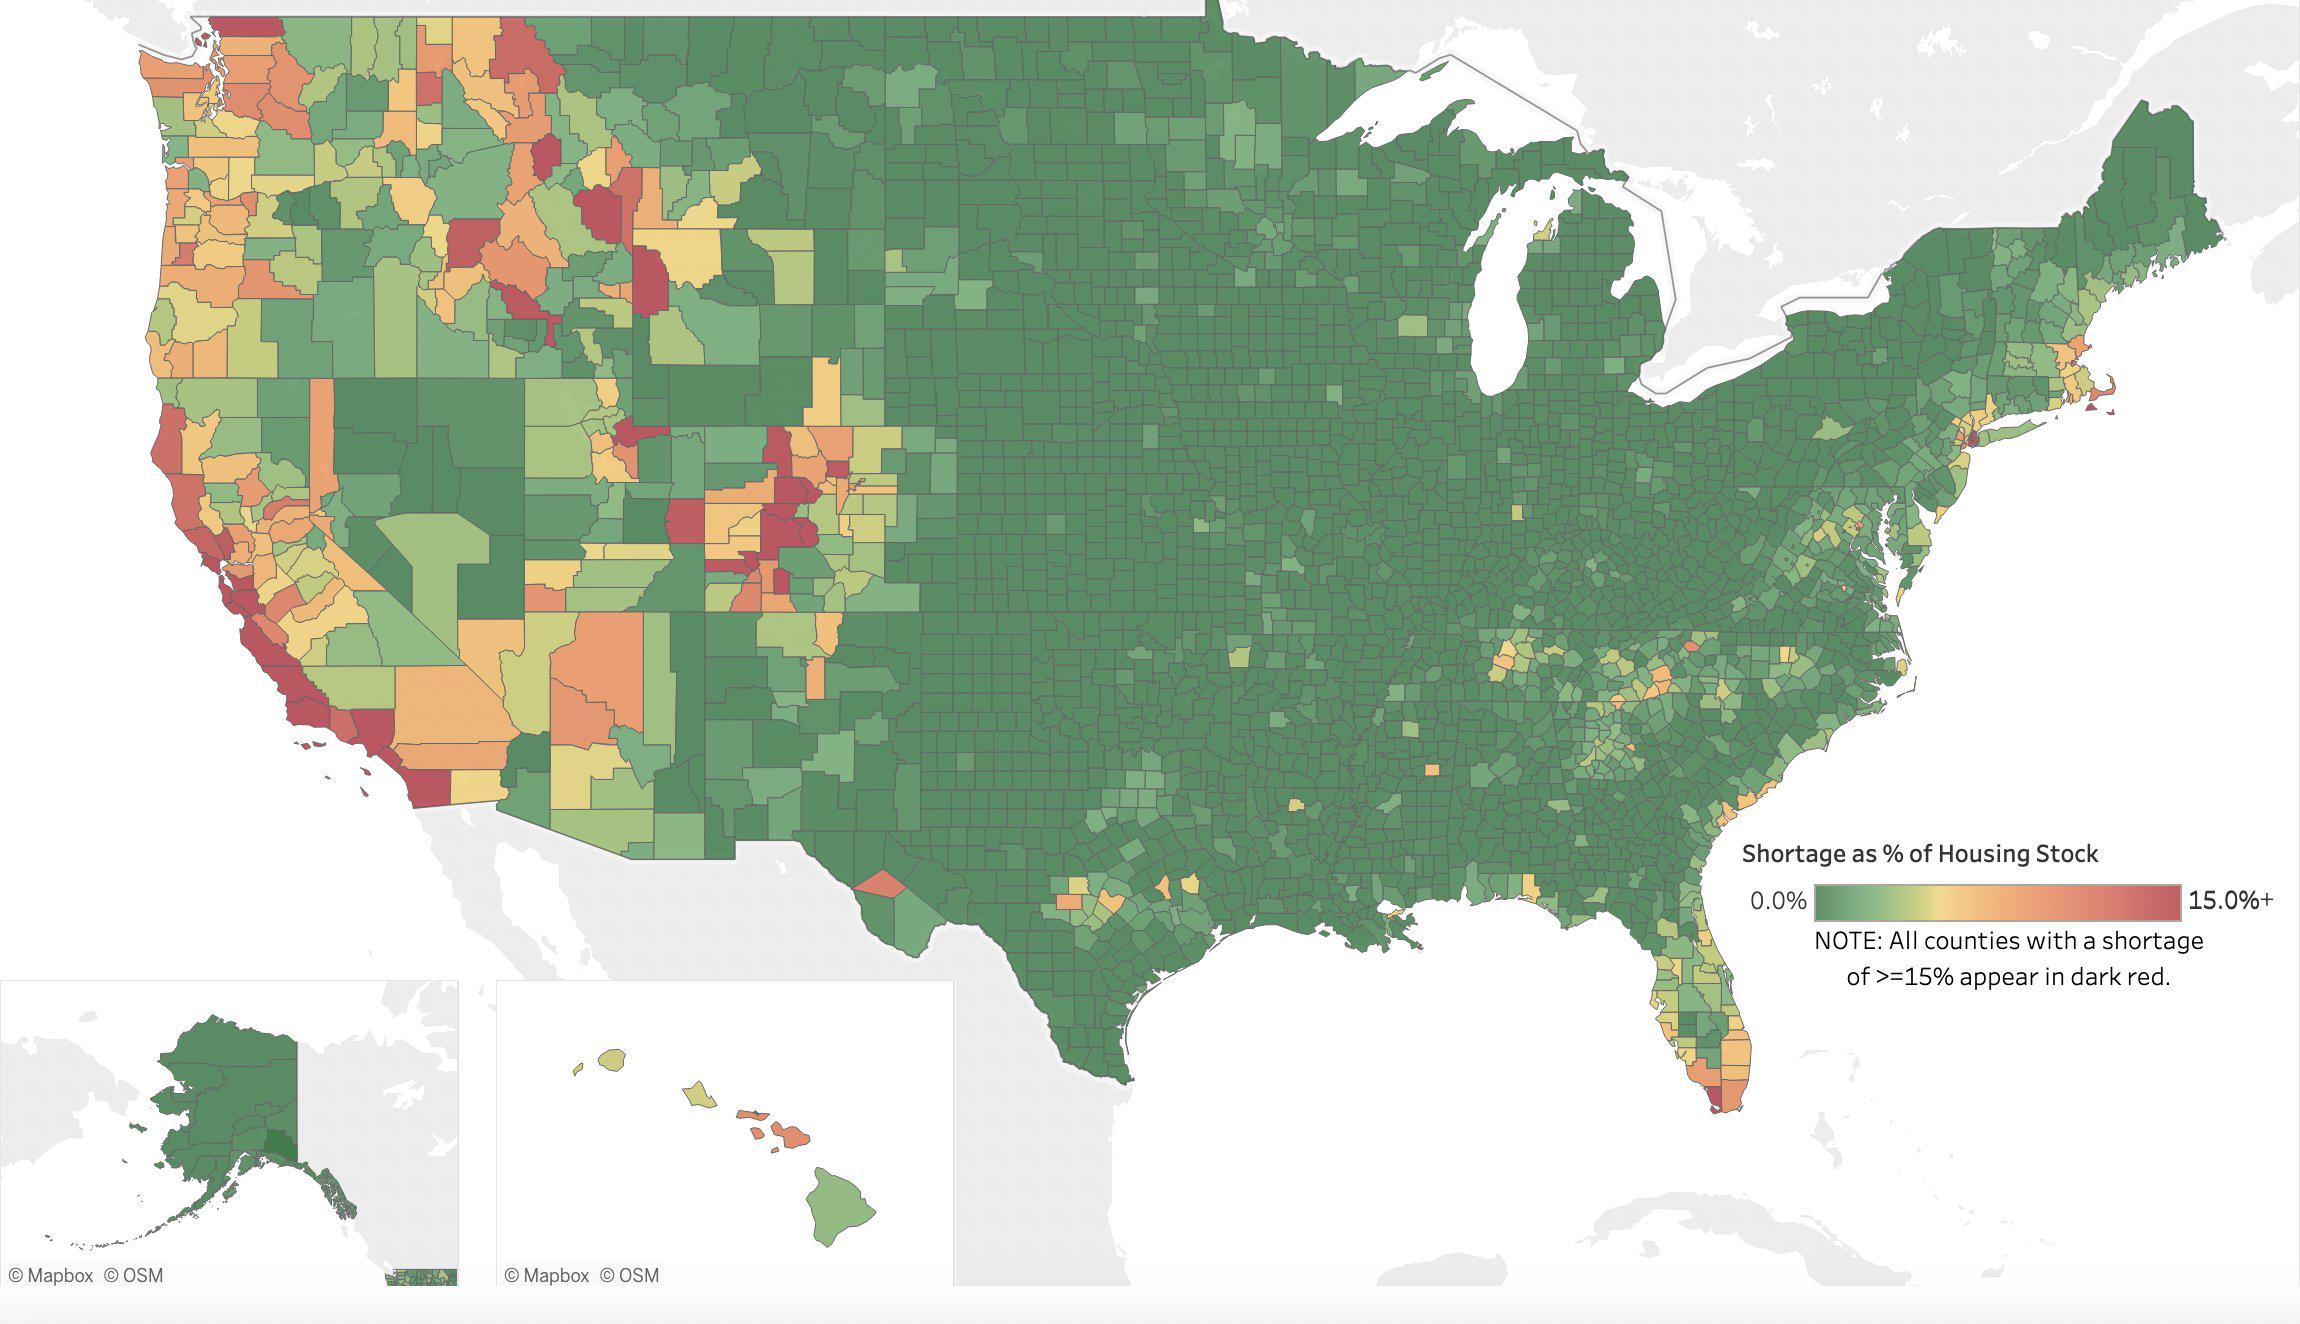
Housing Shortage as Percentage of Stock Map
The visualization titled "Shortage as % of Housing Stock in USA" provides a comprehensive overview of the housing landsc...
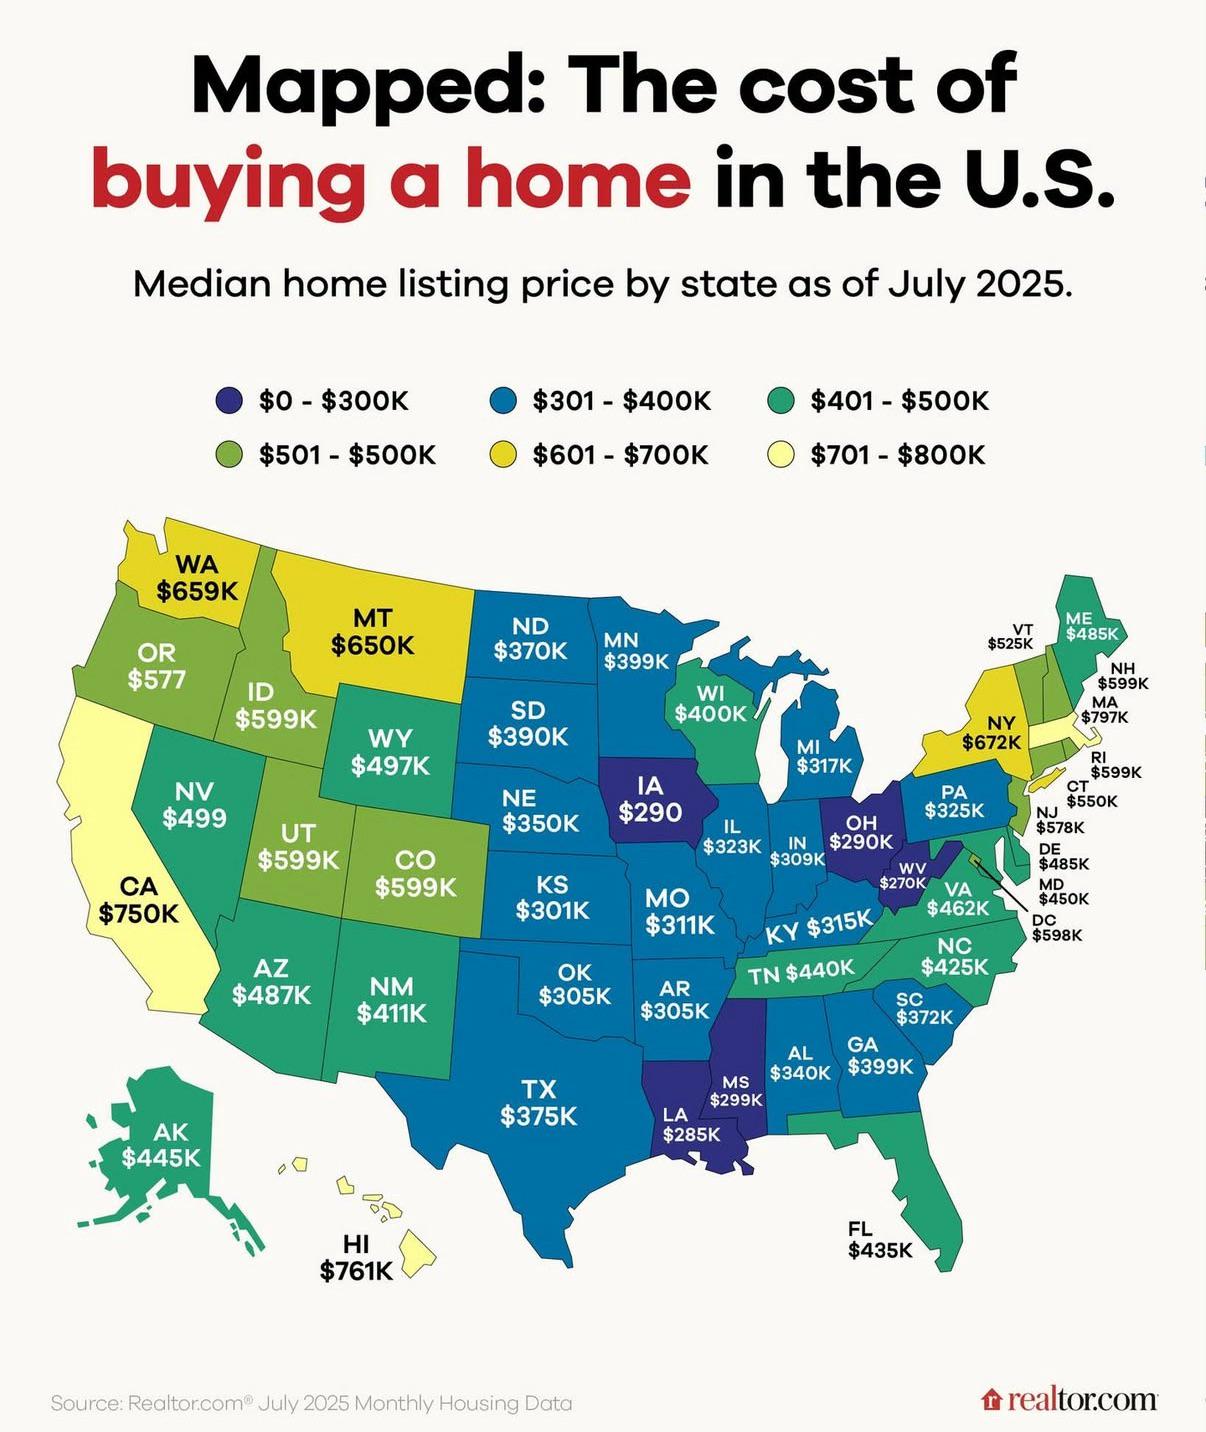
Median House Costs by US States Map
The "Median House Costs by US States as of July 2025" map provides a visual representation of the median housing prices ...
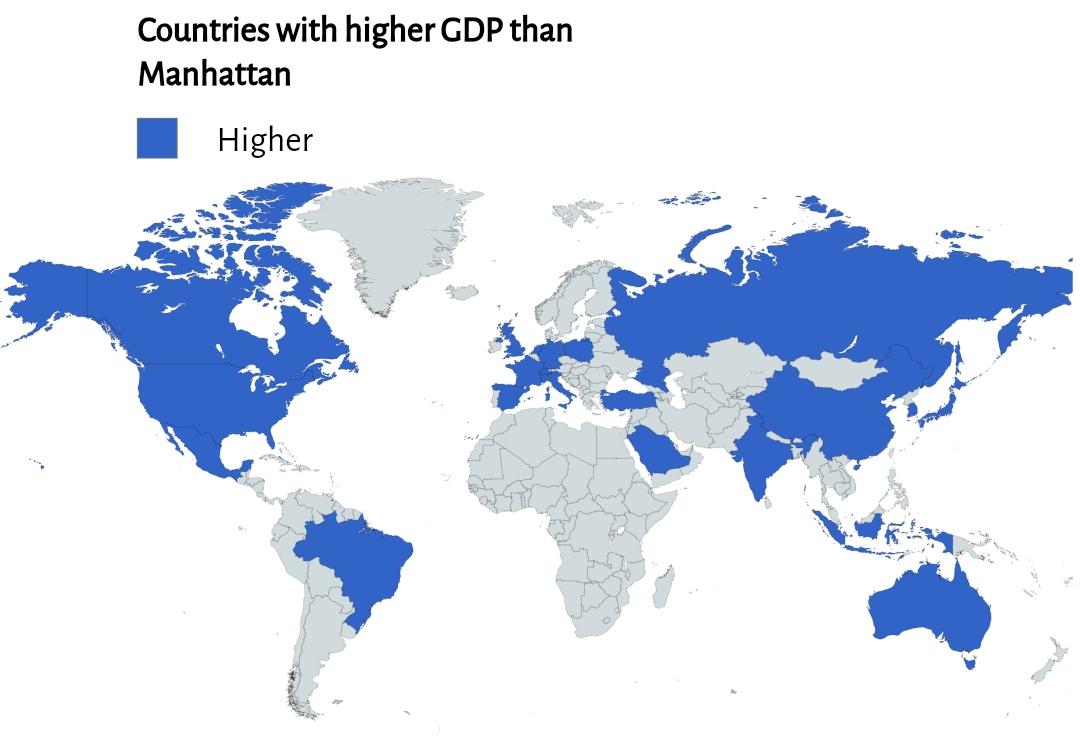
GDP Comparison Map of Manhattan County
This map provides a striking visualization of the economic power of Manhattan County by comparing its Gross Domestic Pro...
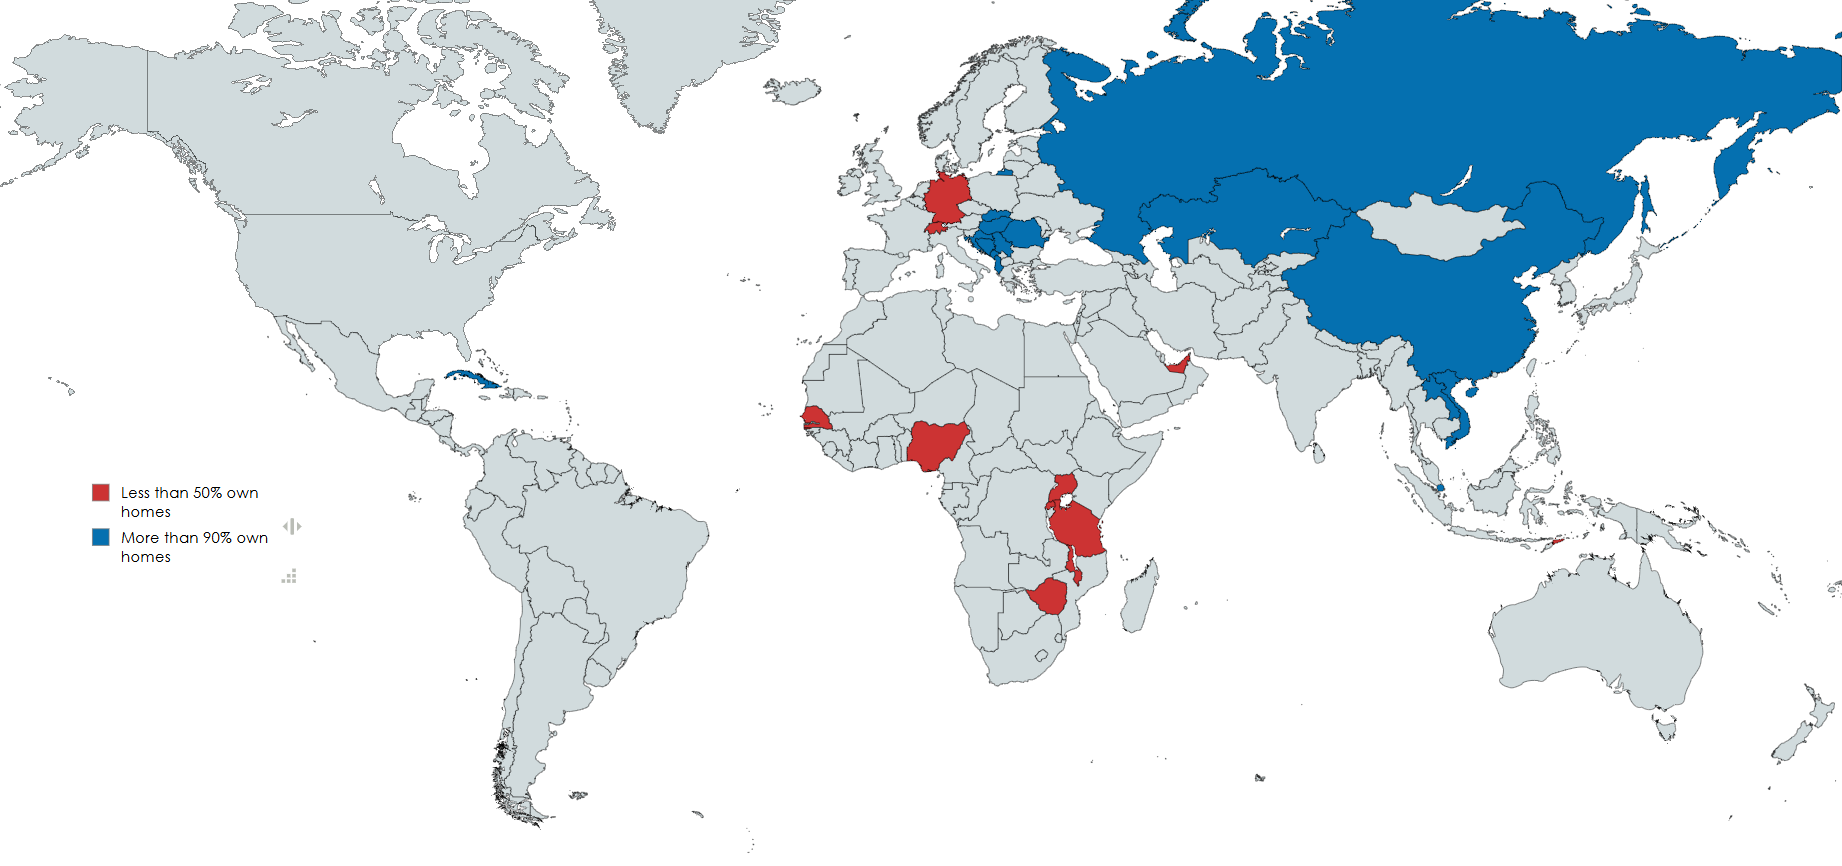
Home Ownership Rates by Country Map
This map highlights a striking contrast in home ownership rates across different countries, categorizing them into two d...

Islands Owned By Billionaires Map
This map provides a clear visualization of islands owned by billionaires around the globe. It highlights the remarkable ...
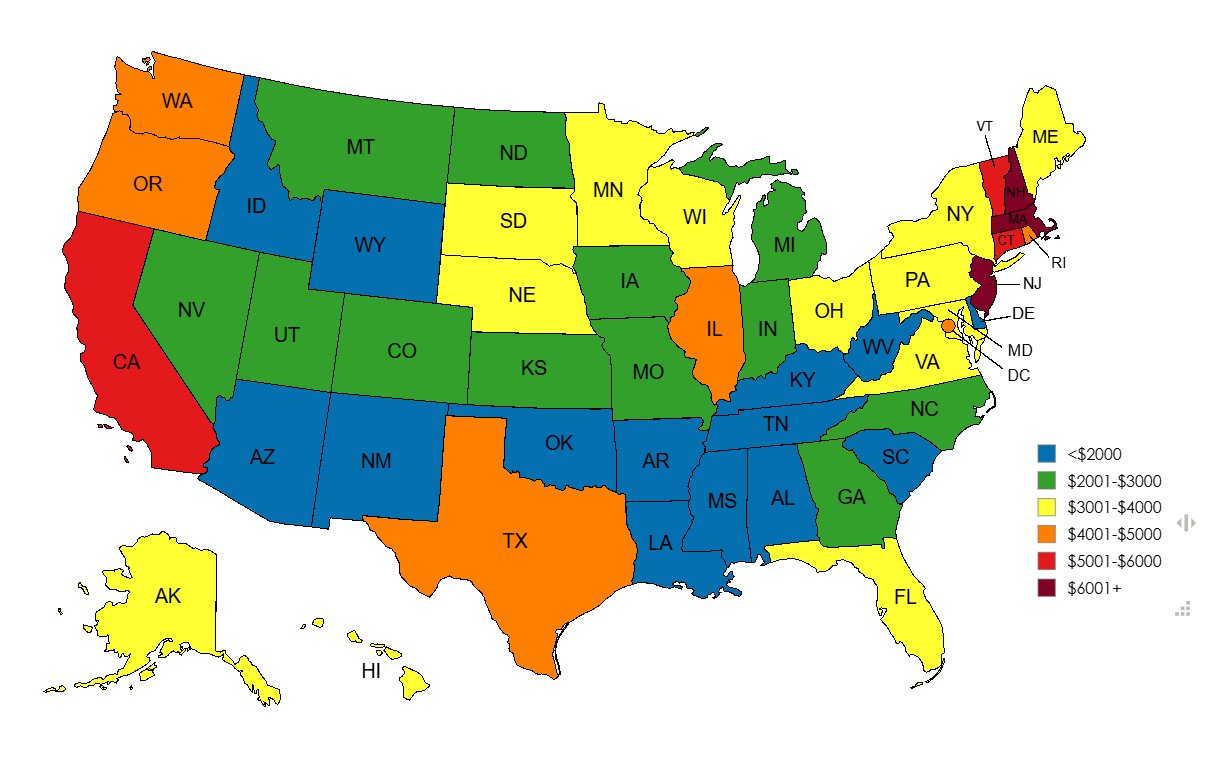
Map of Annual Property Tax Bill by State
The visualization titled \...
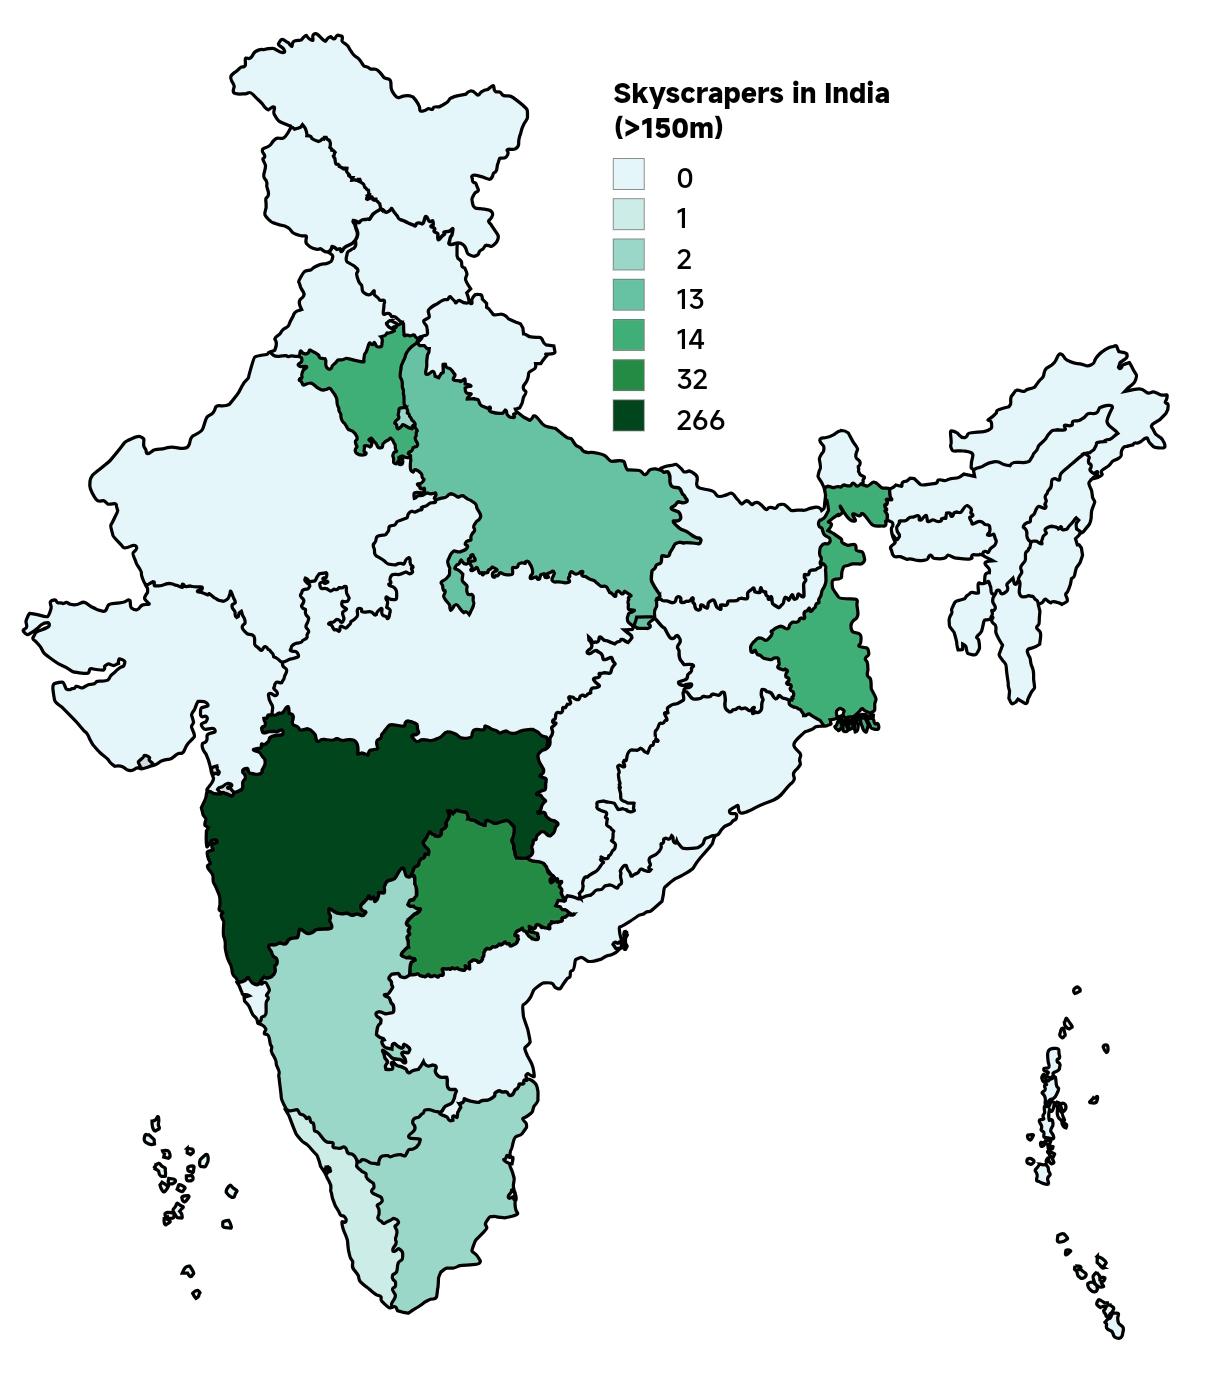
Skyscrapers in India Map 2025
The "Skyscrapers in India Map 2025" provides a comprehensive visualization of the country's towering architectural achie...
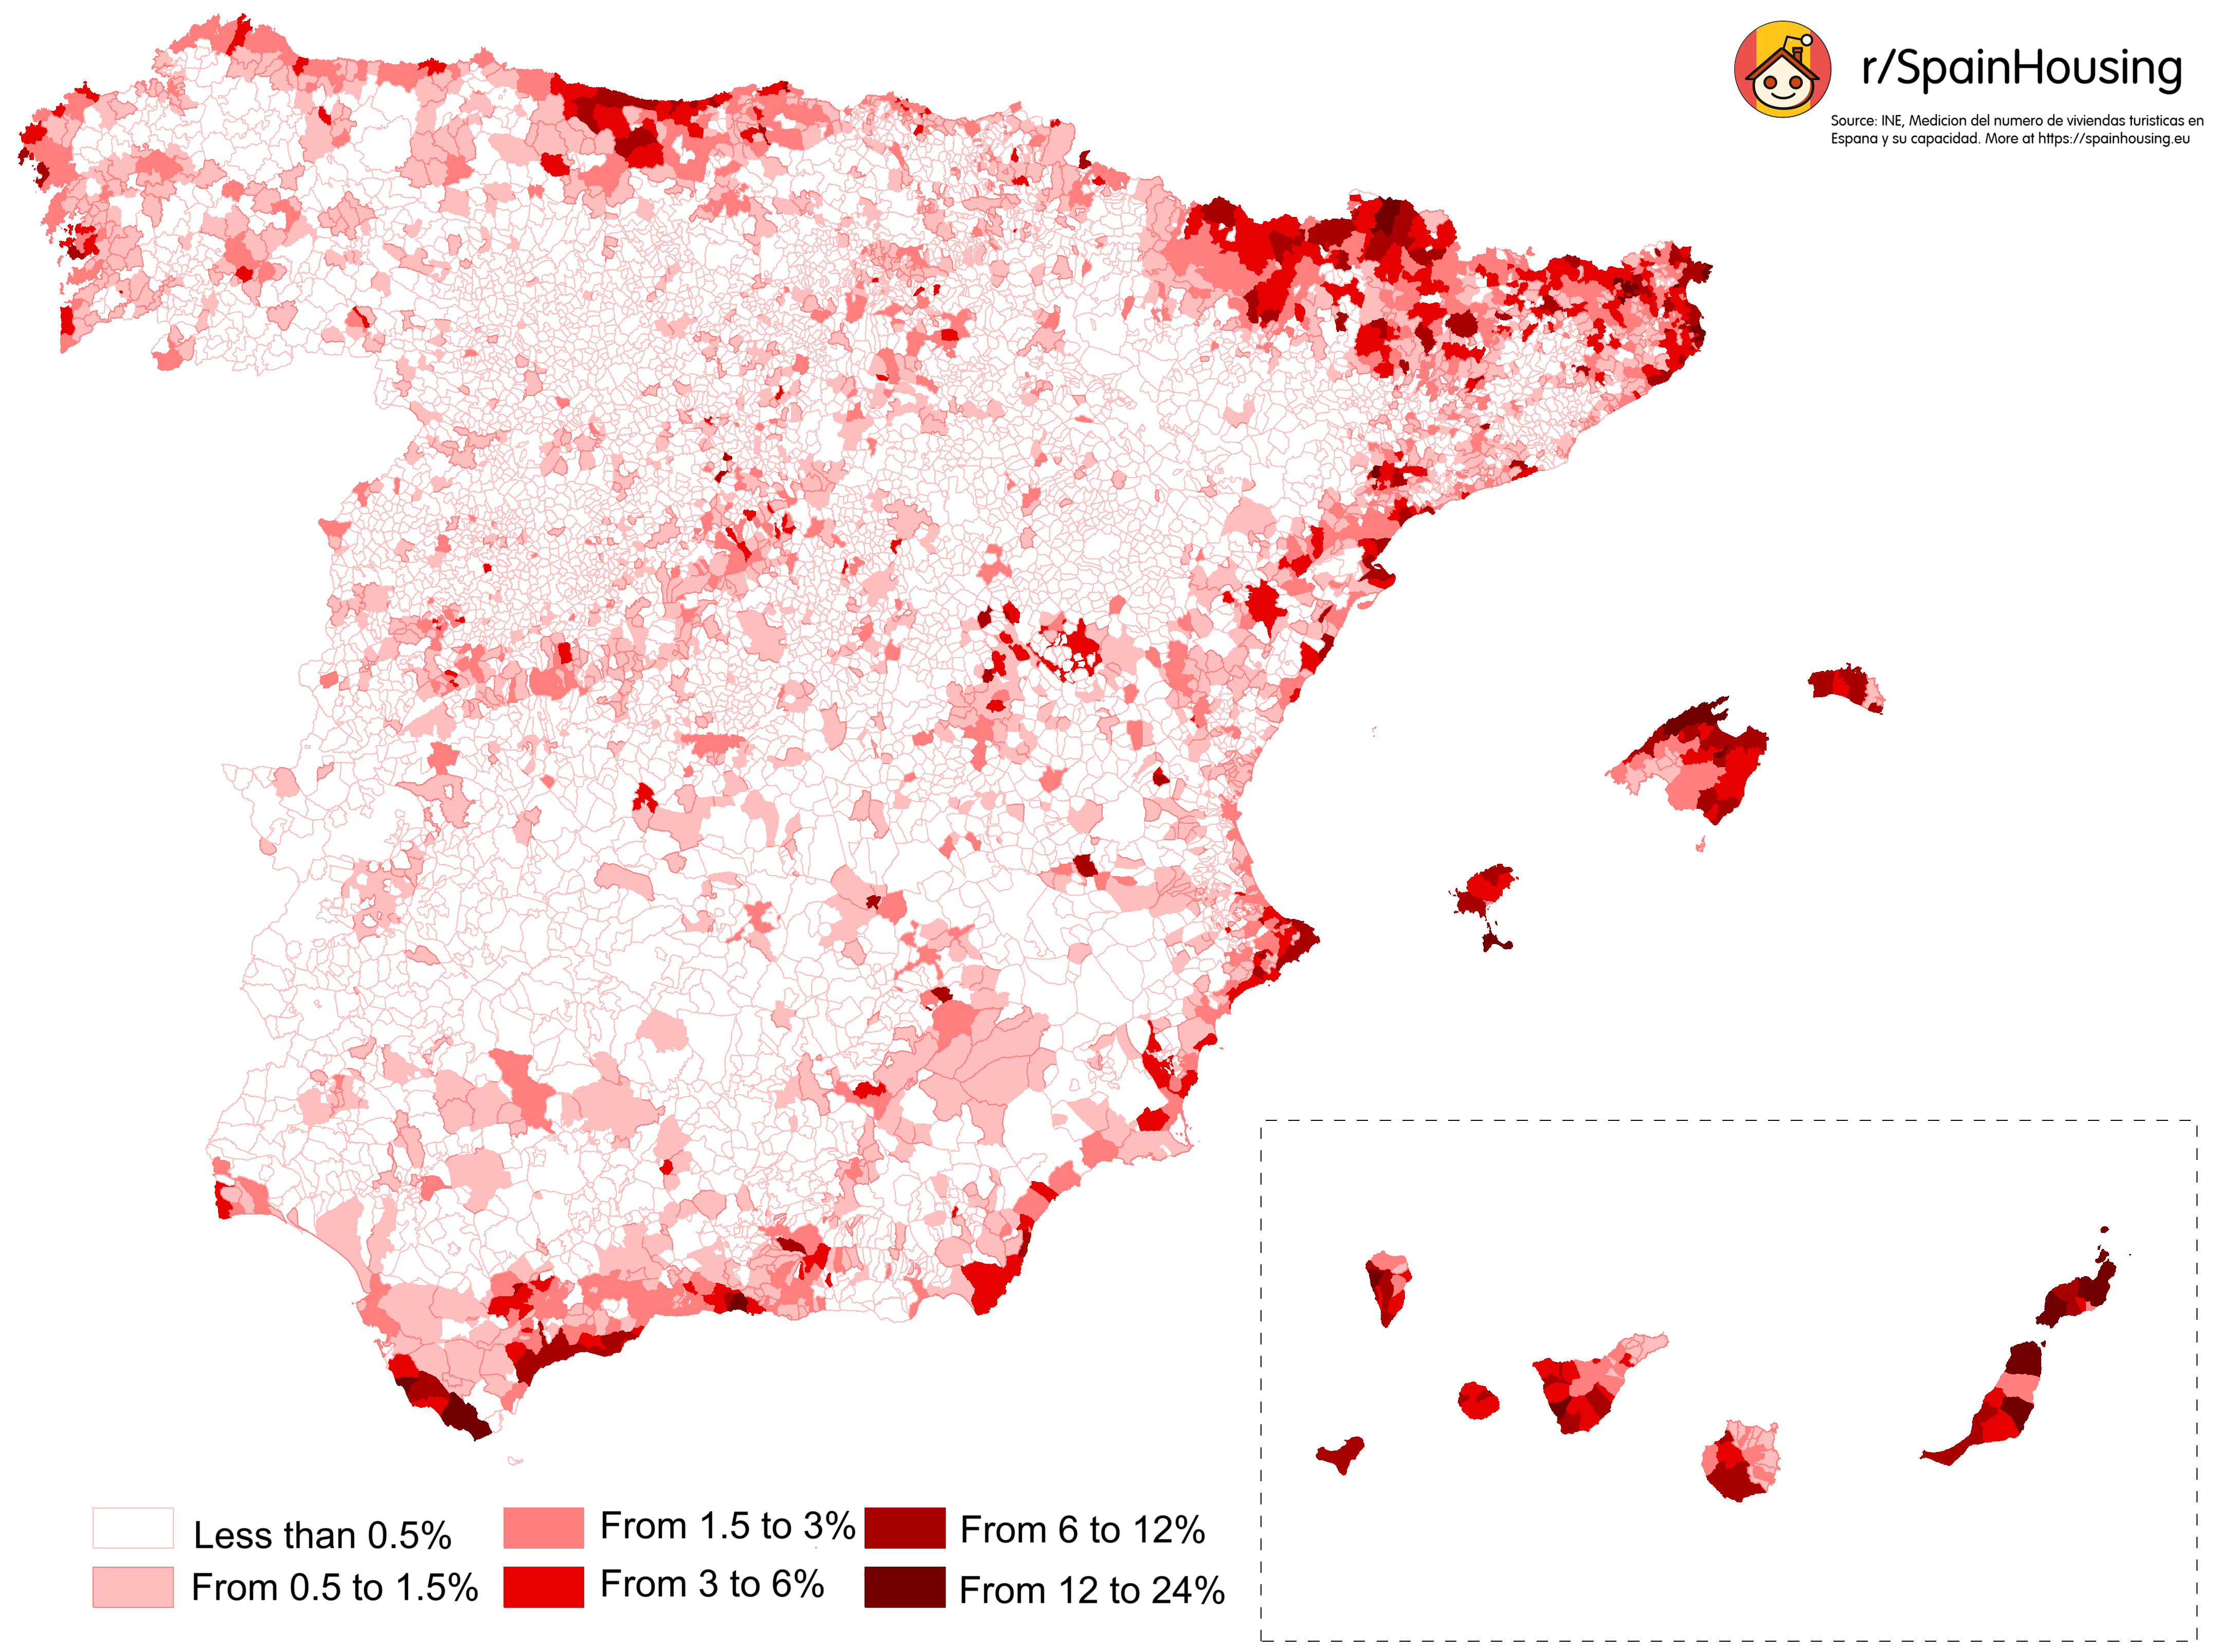
Map of Homes Used for Tourist Rentals in Spain
The map titled "Percentage of Homes Used for Tourist Rentals in Spain" provides a compelling visualization of how many r...
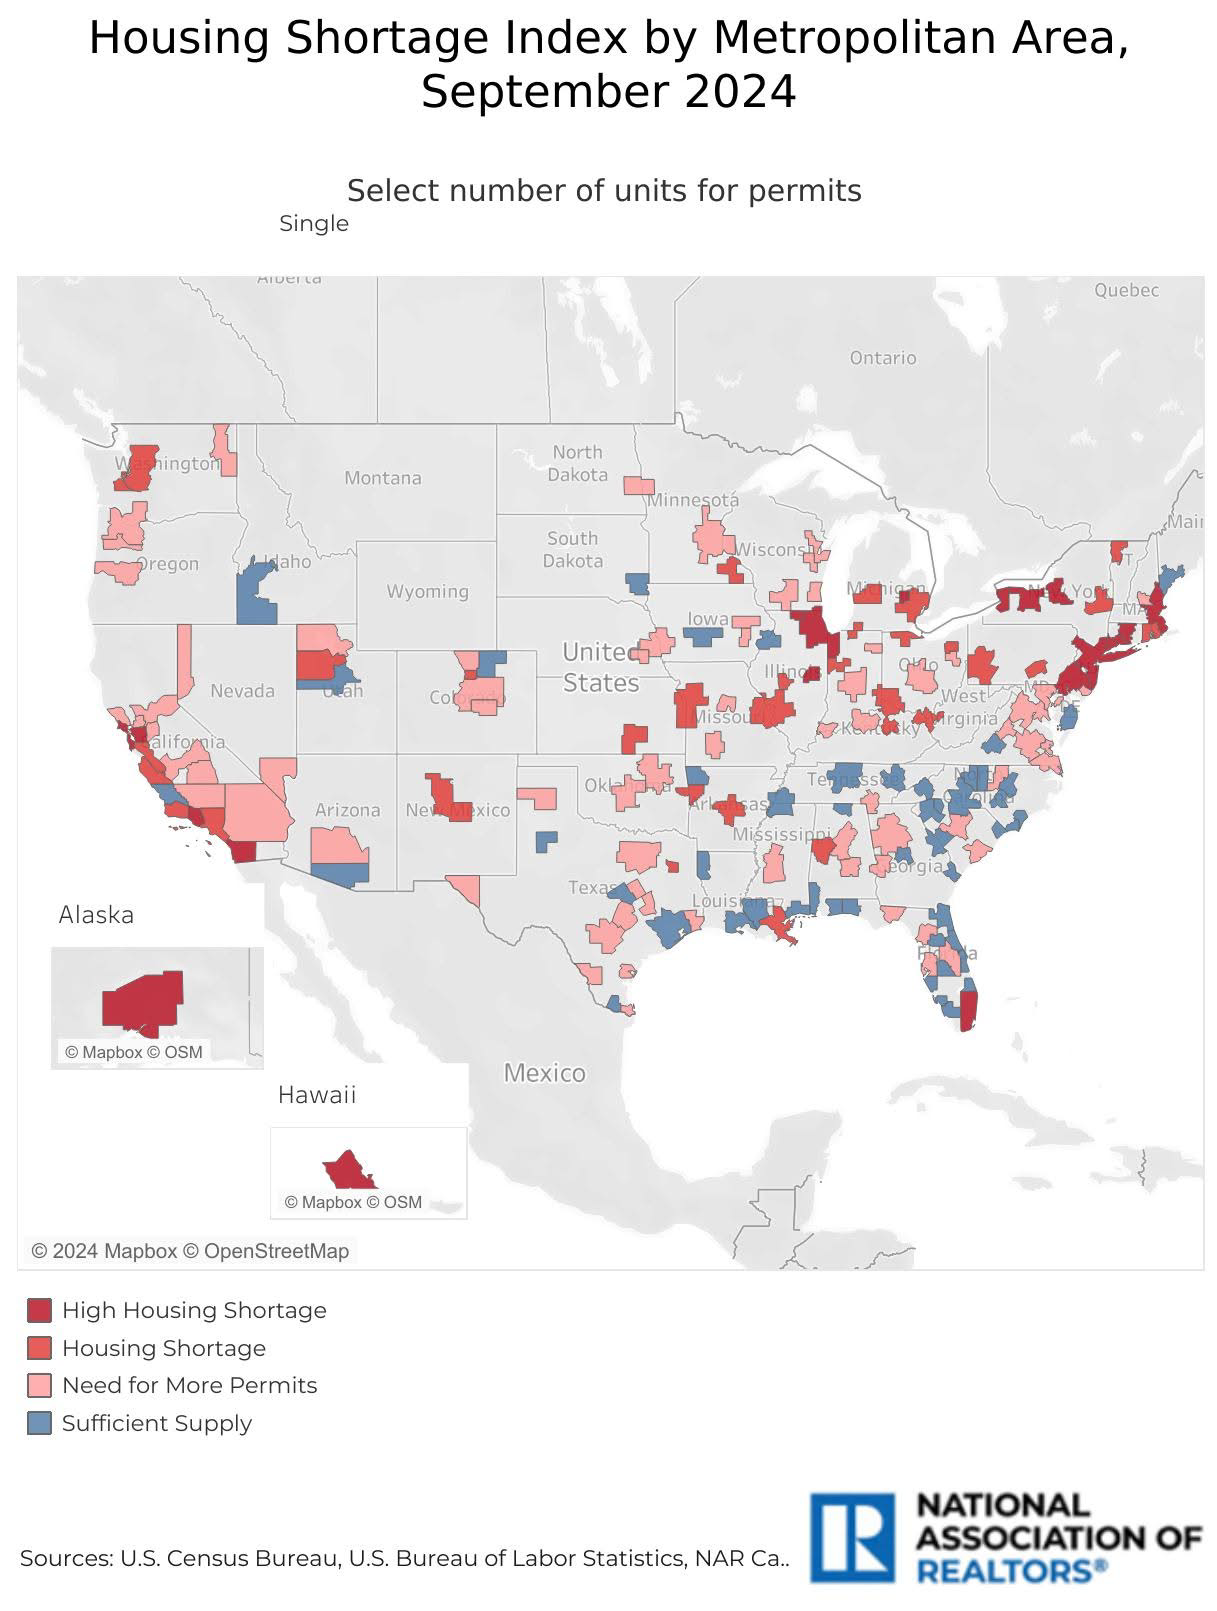
Housing Shortage Index Map
The Housing Shortage Index Map provides a visual representation of the areas experiencing the most significant housing s...
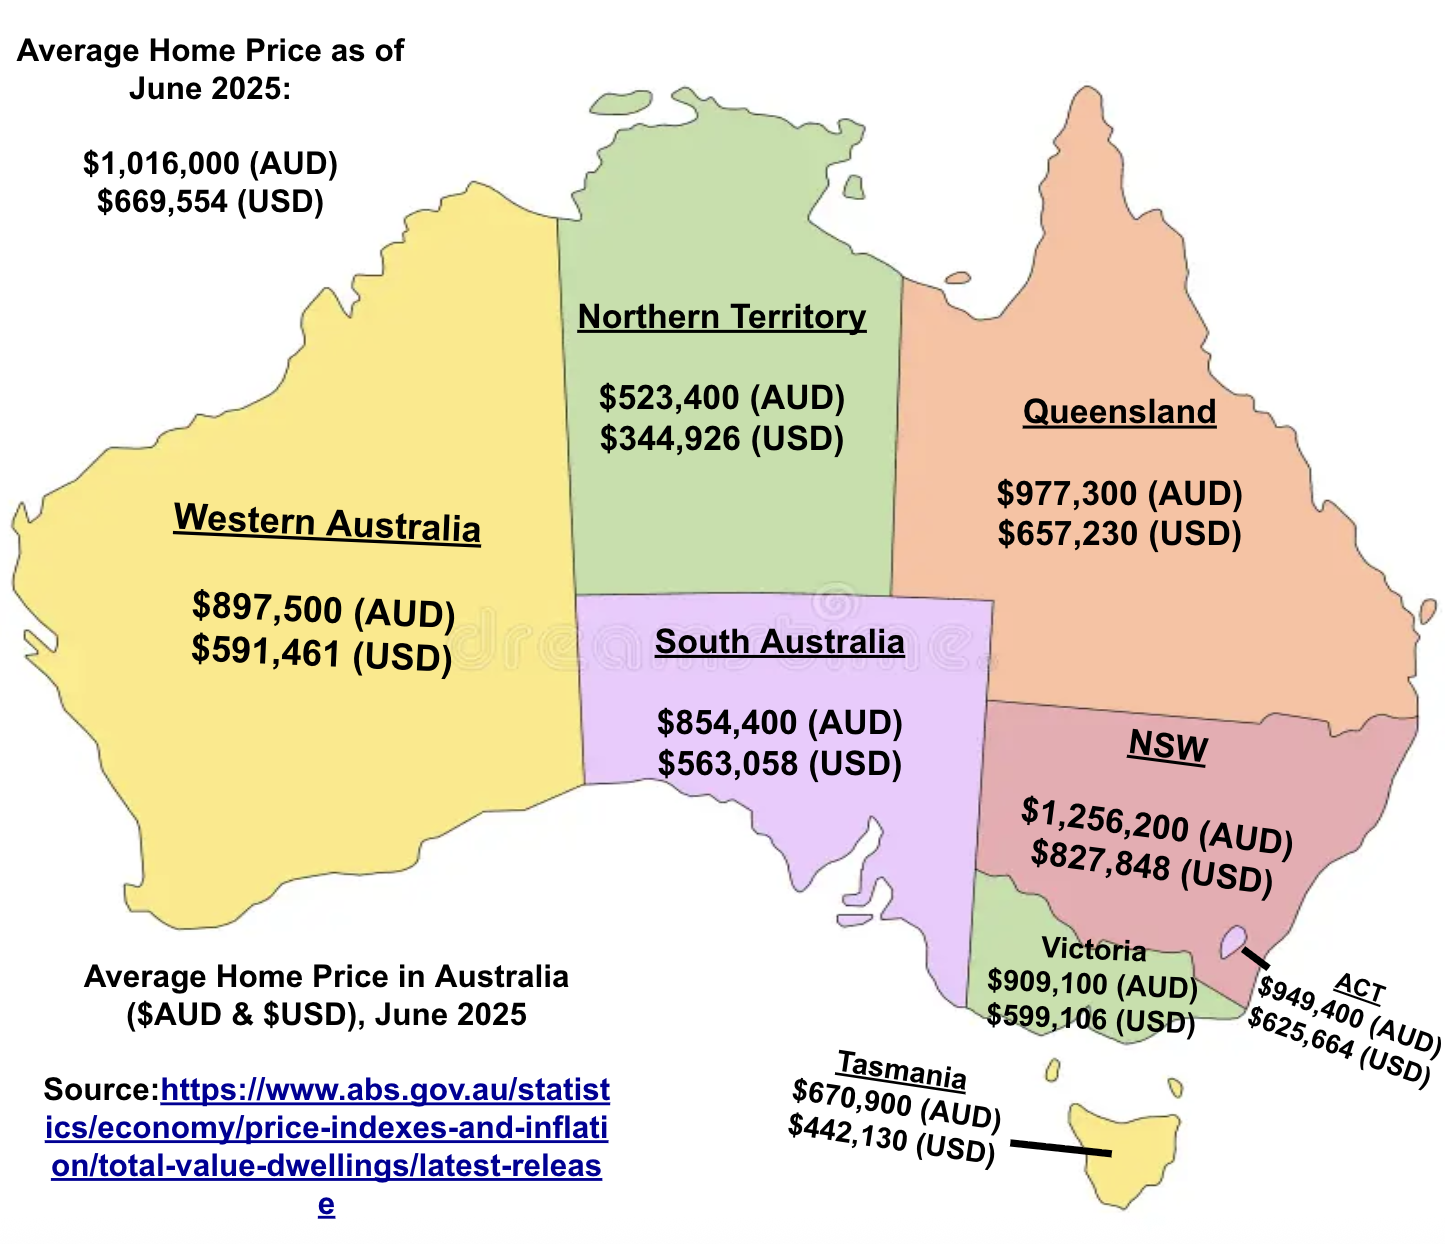
Average Home Price Map in Australia, June 2025
The visualization titled "Average Home Price in Australia ($AUD & $USD), June 2025" presents a detailed overview of the ...
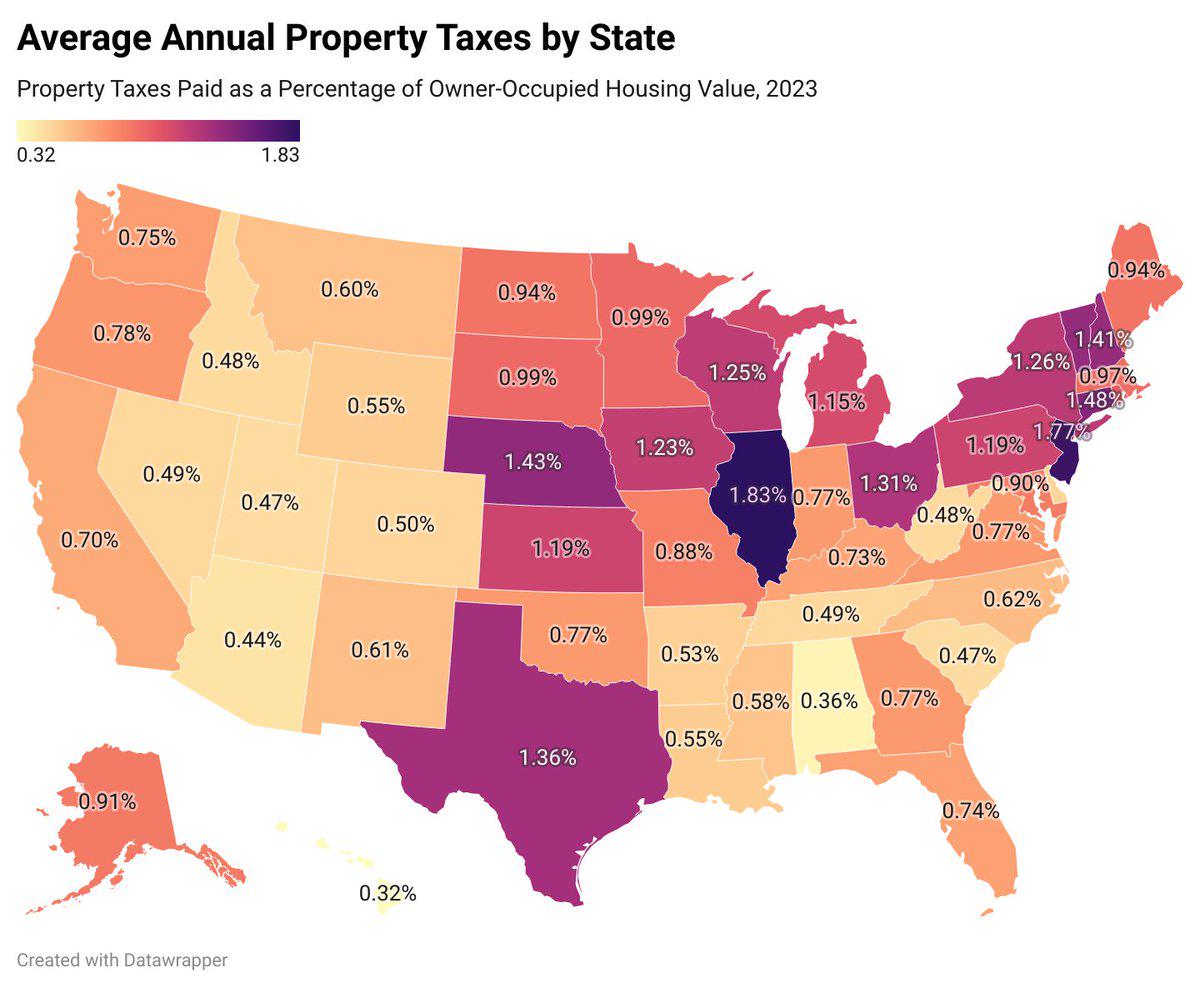
Average Annual Property Tax by State Map
This map displays the average annual property tax by state across the United States, offering a clear visual representat...
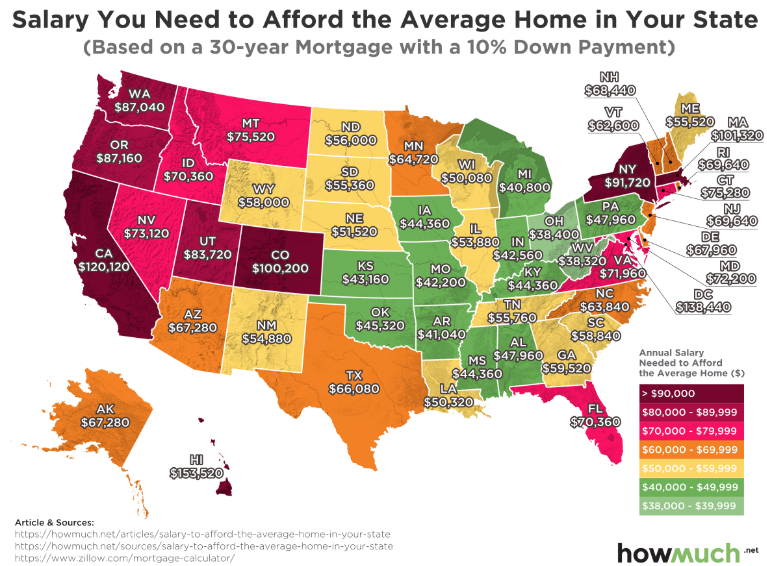
Salary Needed to Afford a Home Map
Interestingly, the map illustrates how salaries vary dramatically across different regions, affecting home affordability...
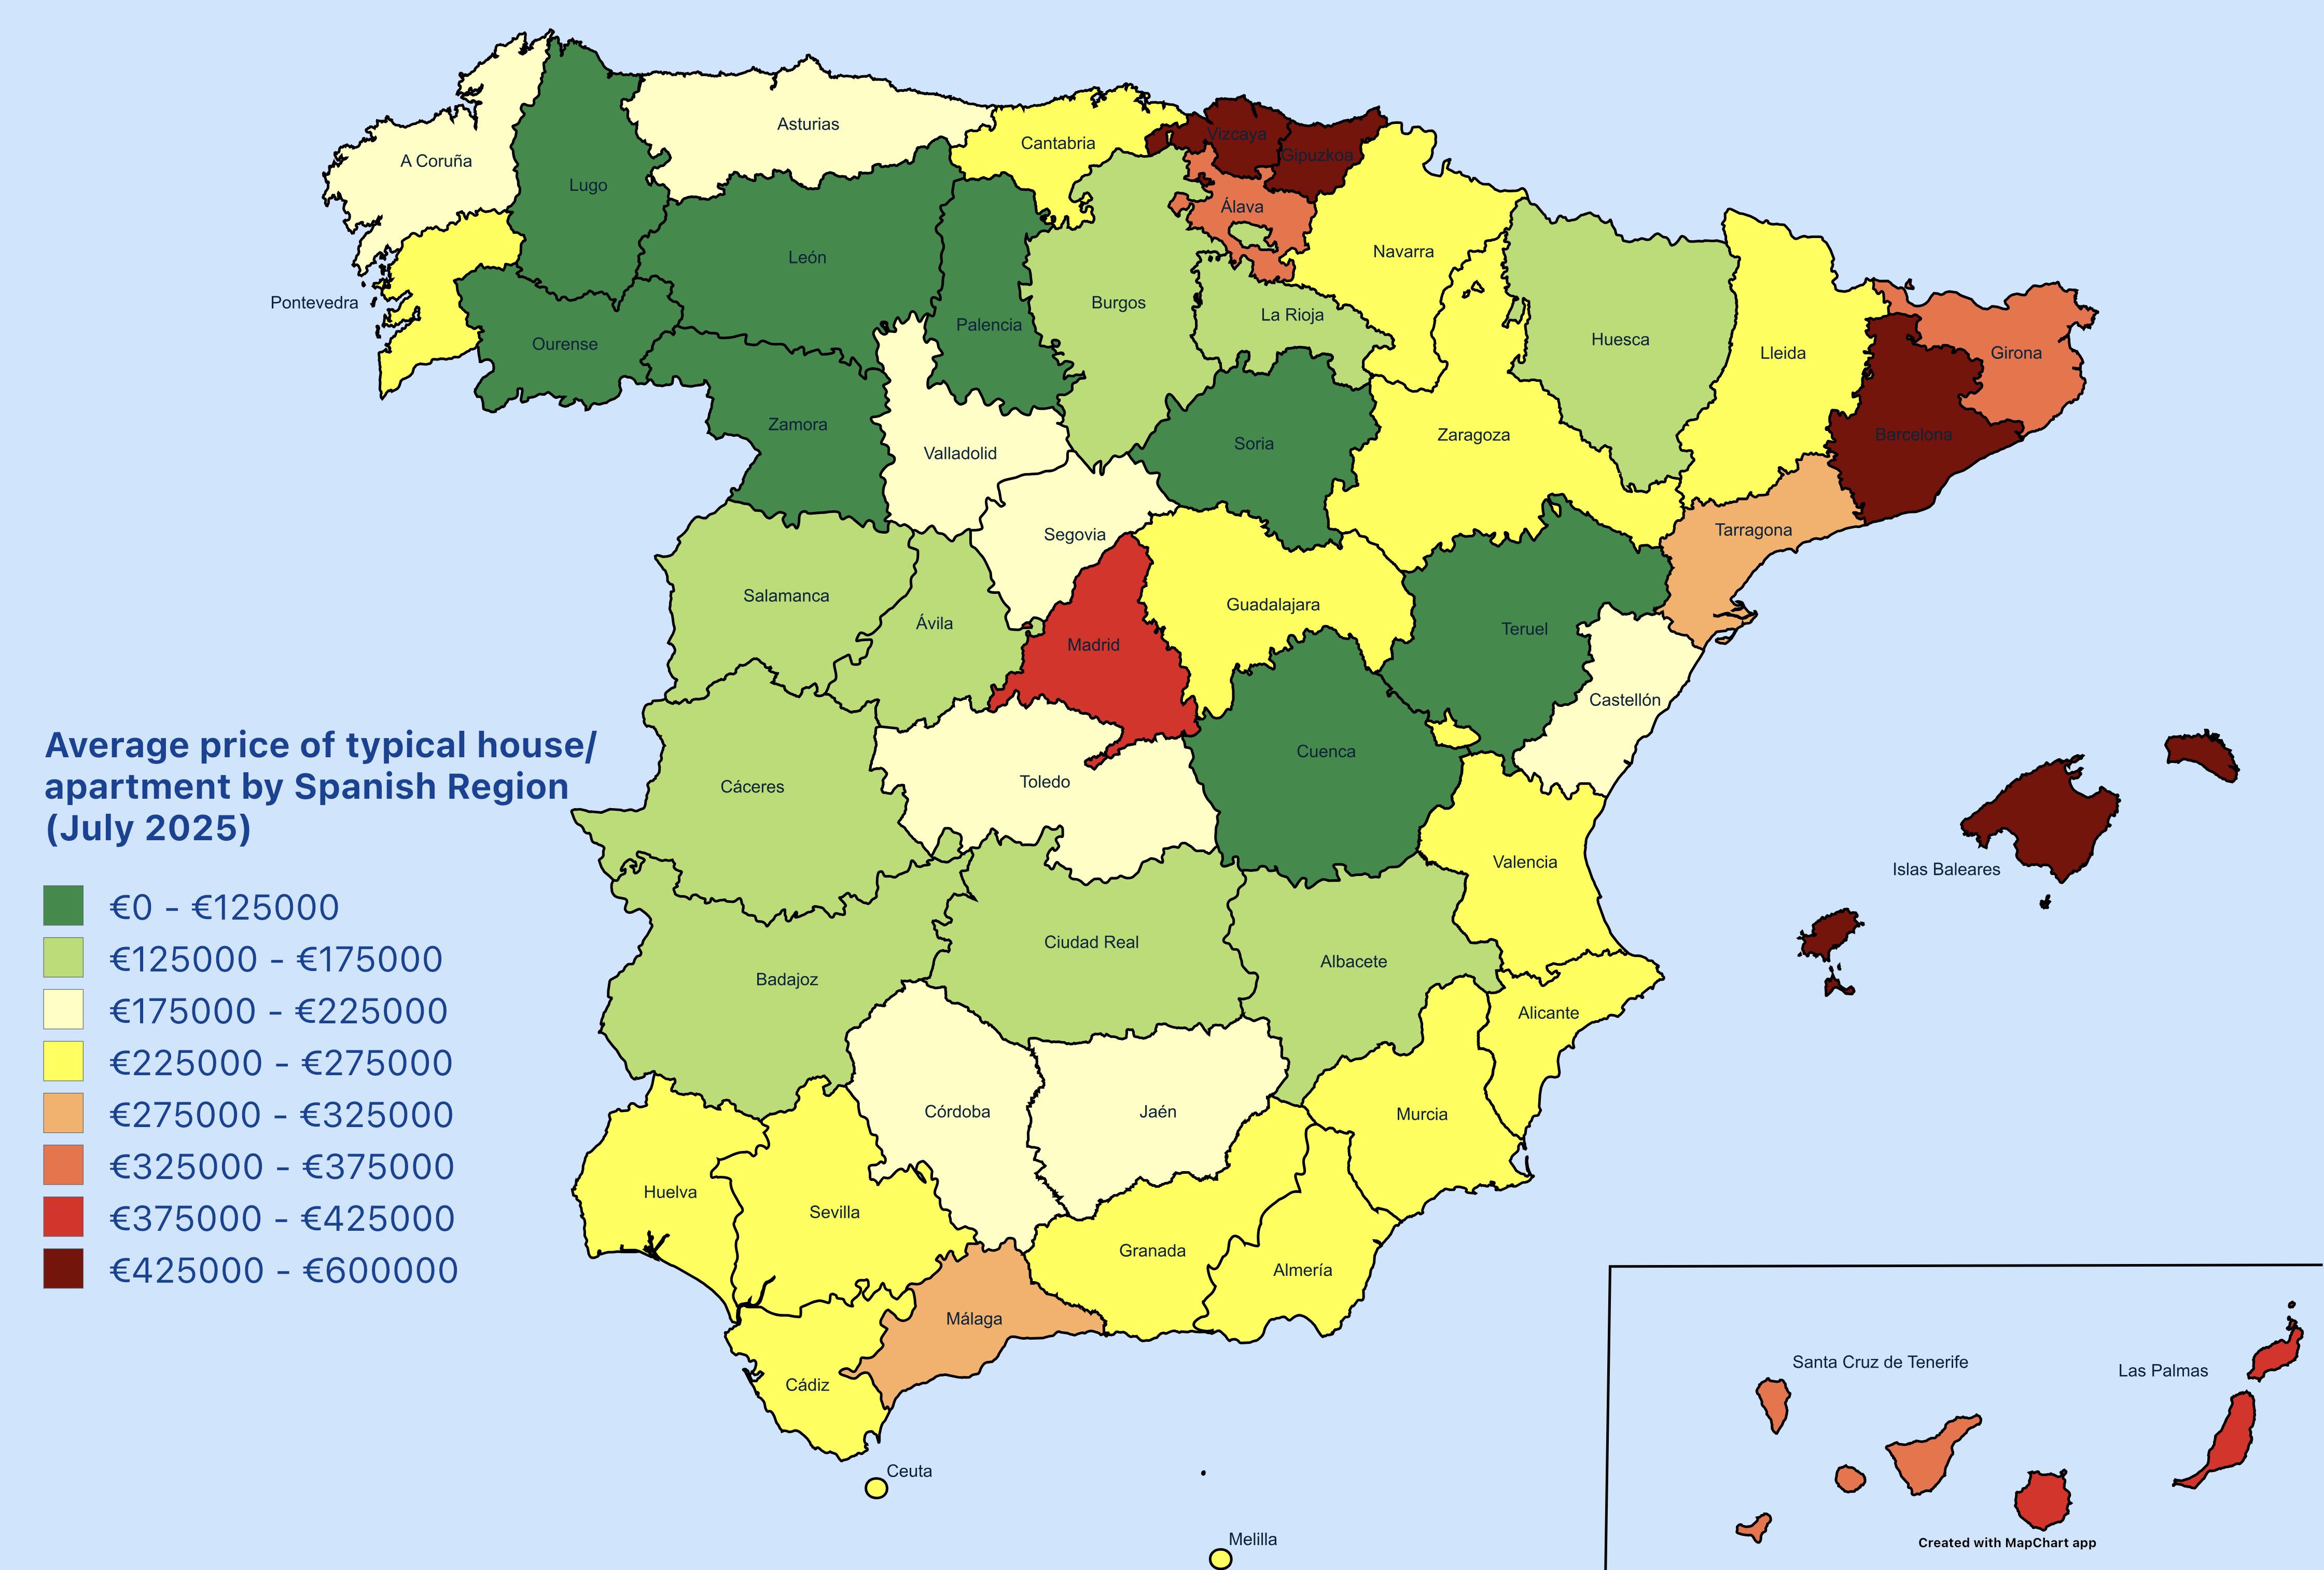
Average Housing Prices by Spanish Region Map
The "Average Housing Prices by Spanish Region Map" provides a comprehensive overview of the real estate landscape across...
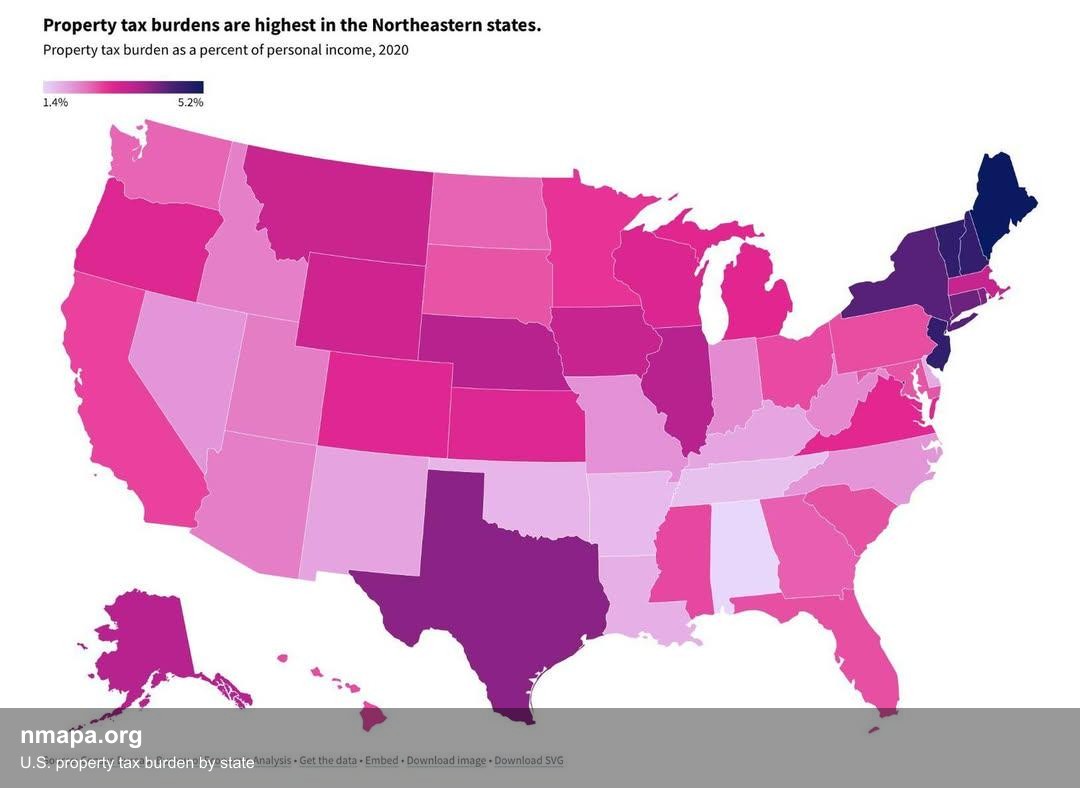
U.S. Property Tax Burden by State Map
The "U.S. Property Tax Burden by State Map" provides a clear visualization of property tax rates across the United State...
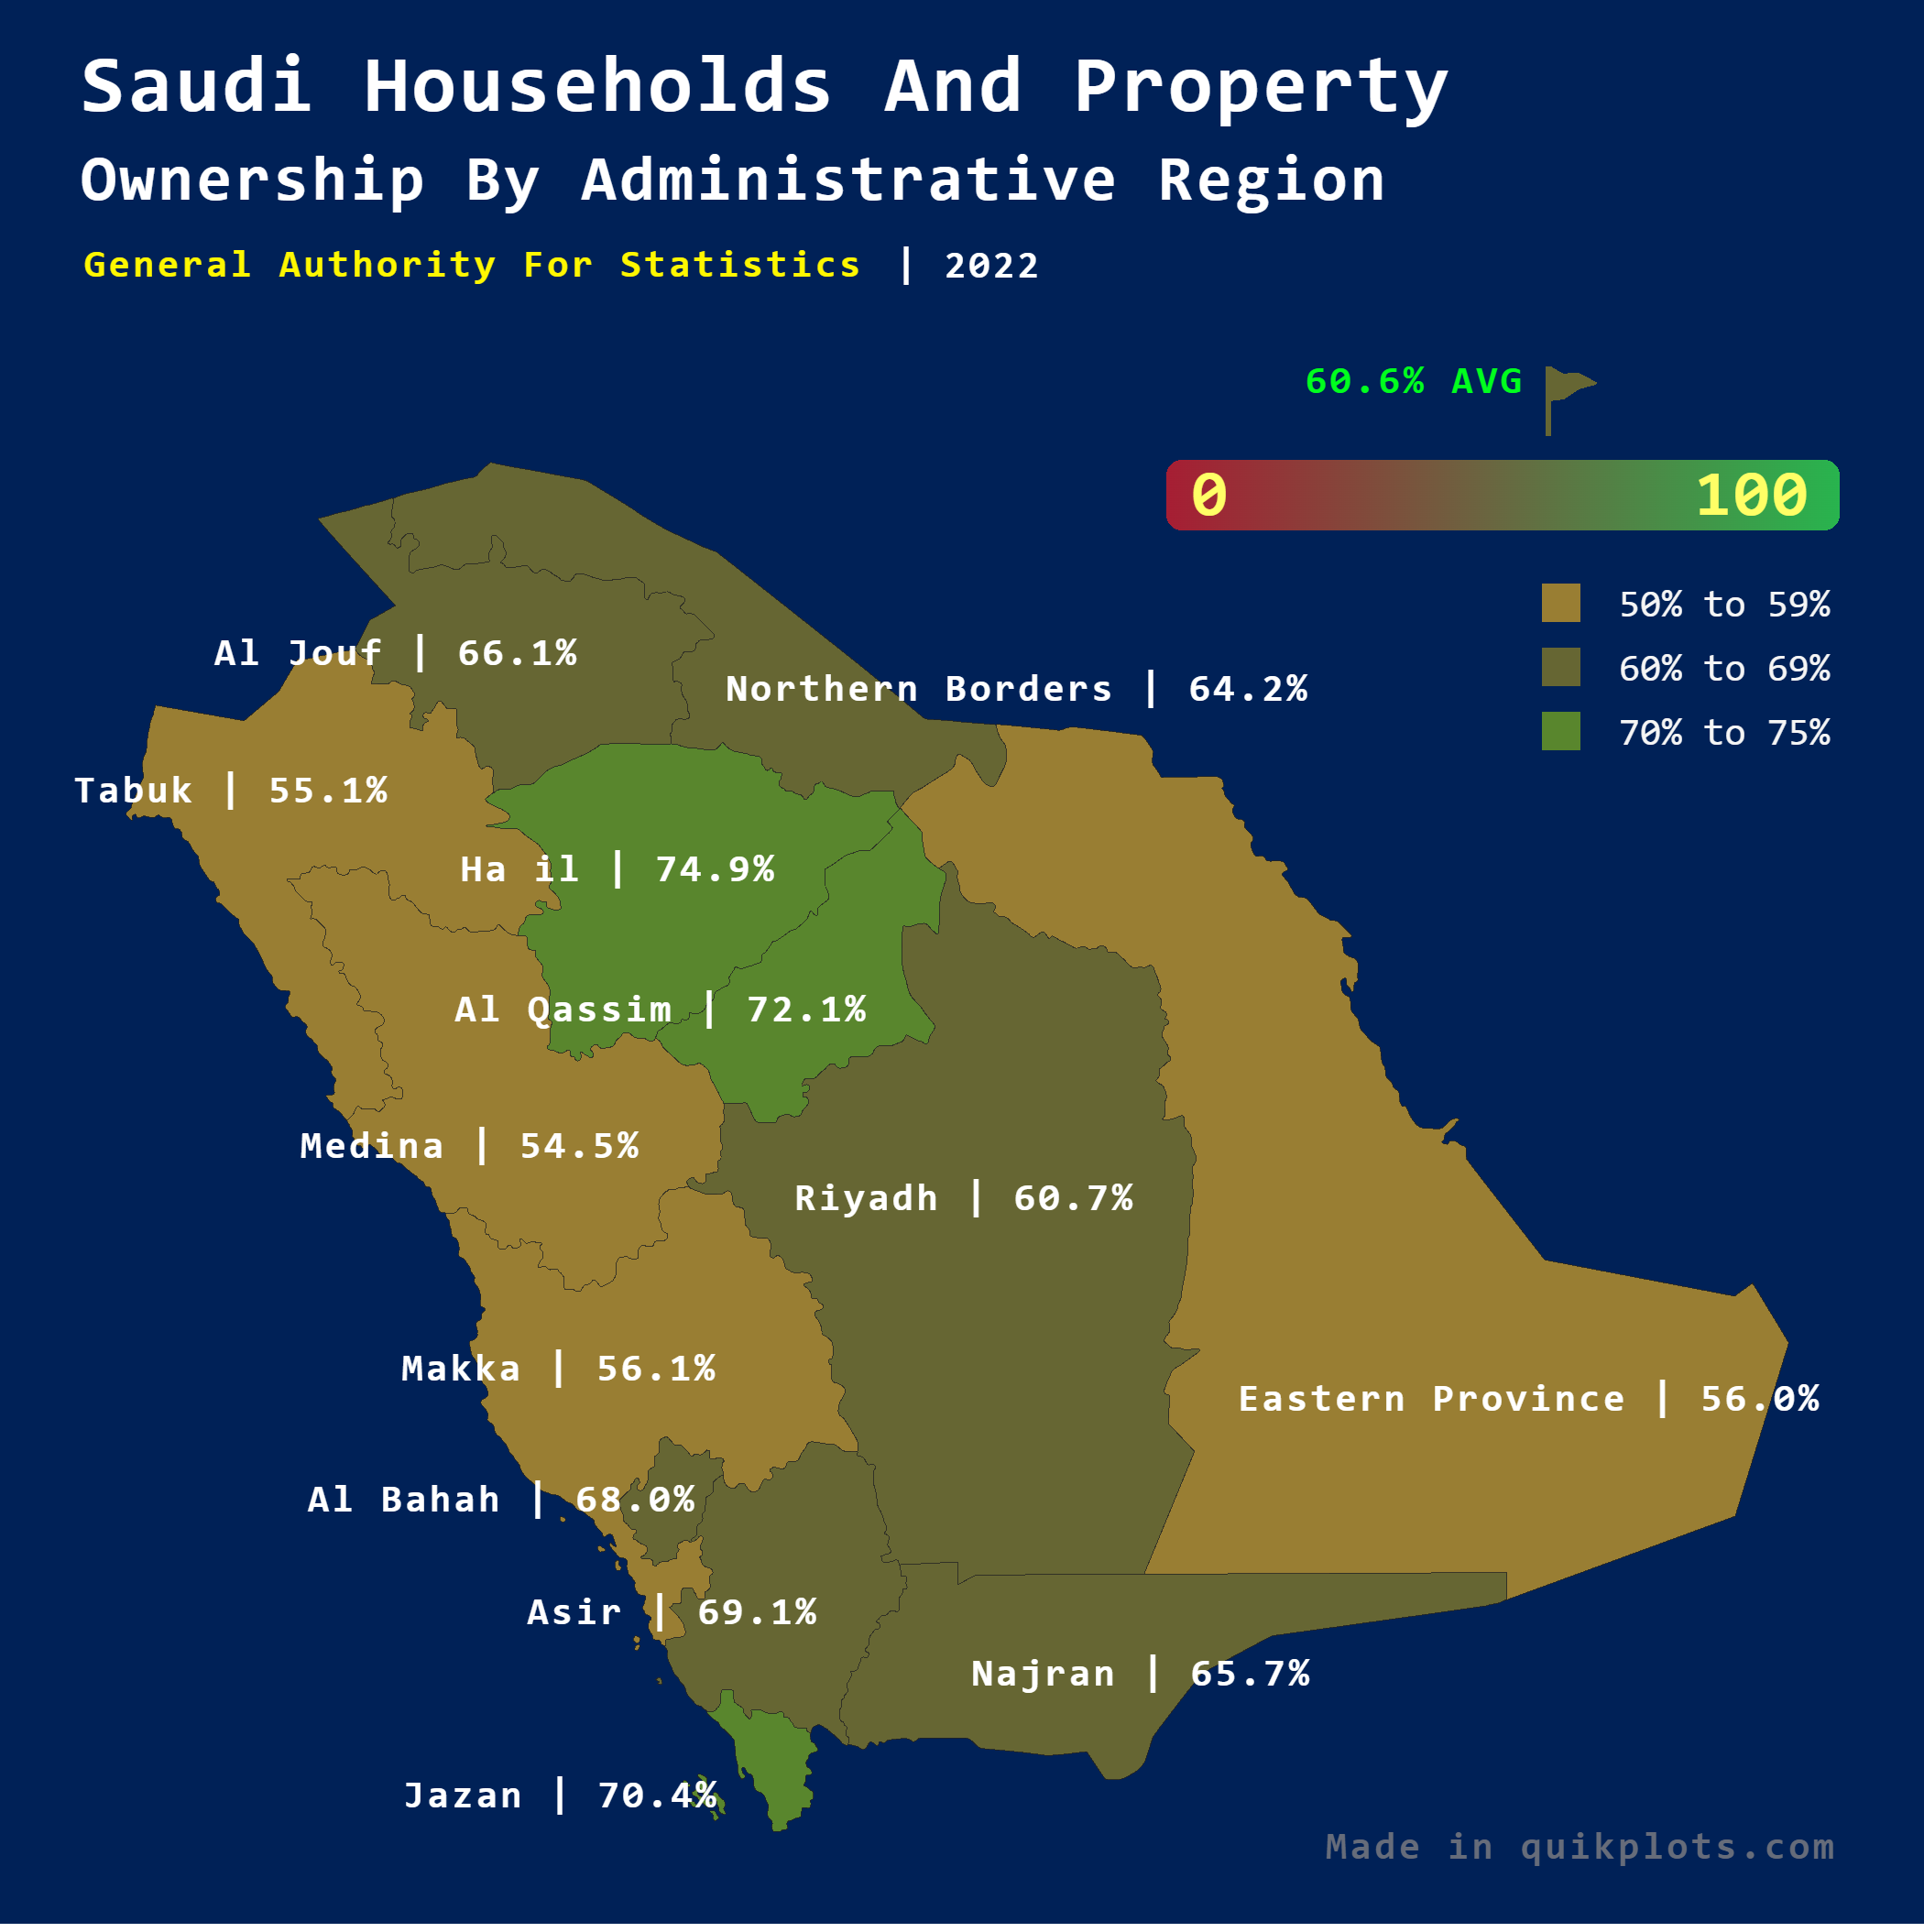
Saudi Households and Property Ownership Map
The visualization titled \...