housing market Maps
6 geographic visualizations tagged with "housing market"
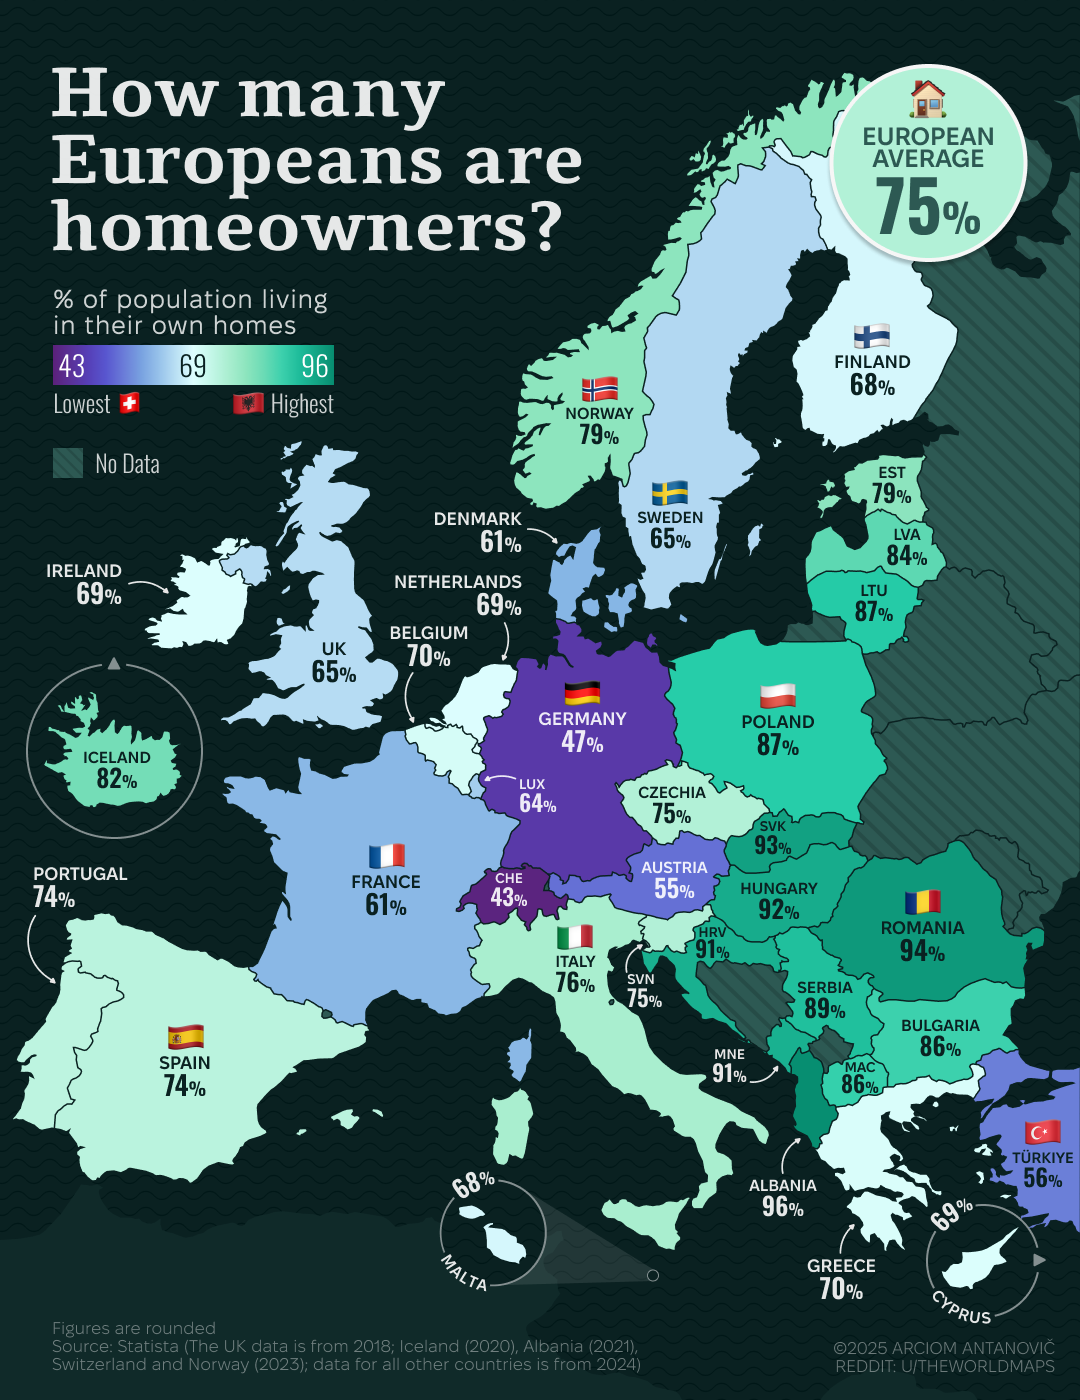
Map of European Homeownership Rates
This map illustrates the share of the European population living in their own homes, providing a clear visual representa...
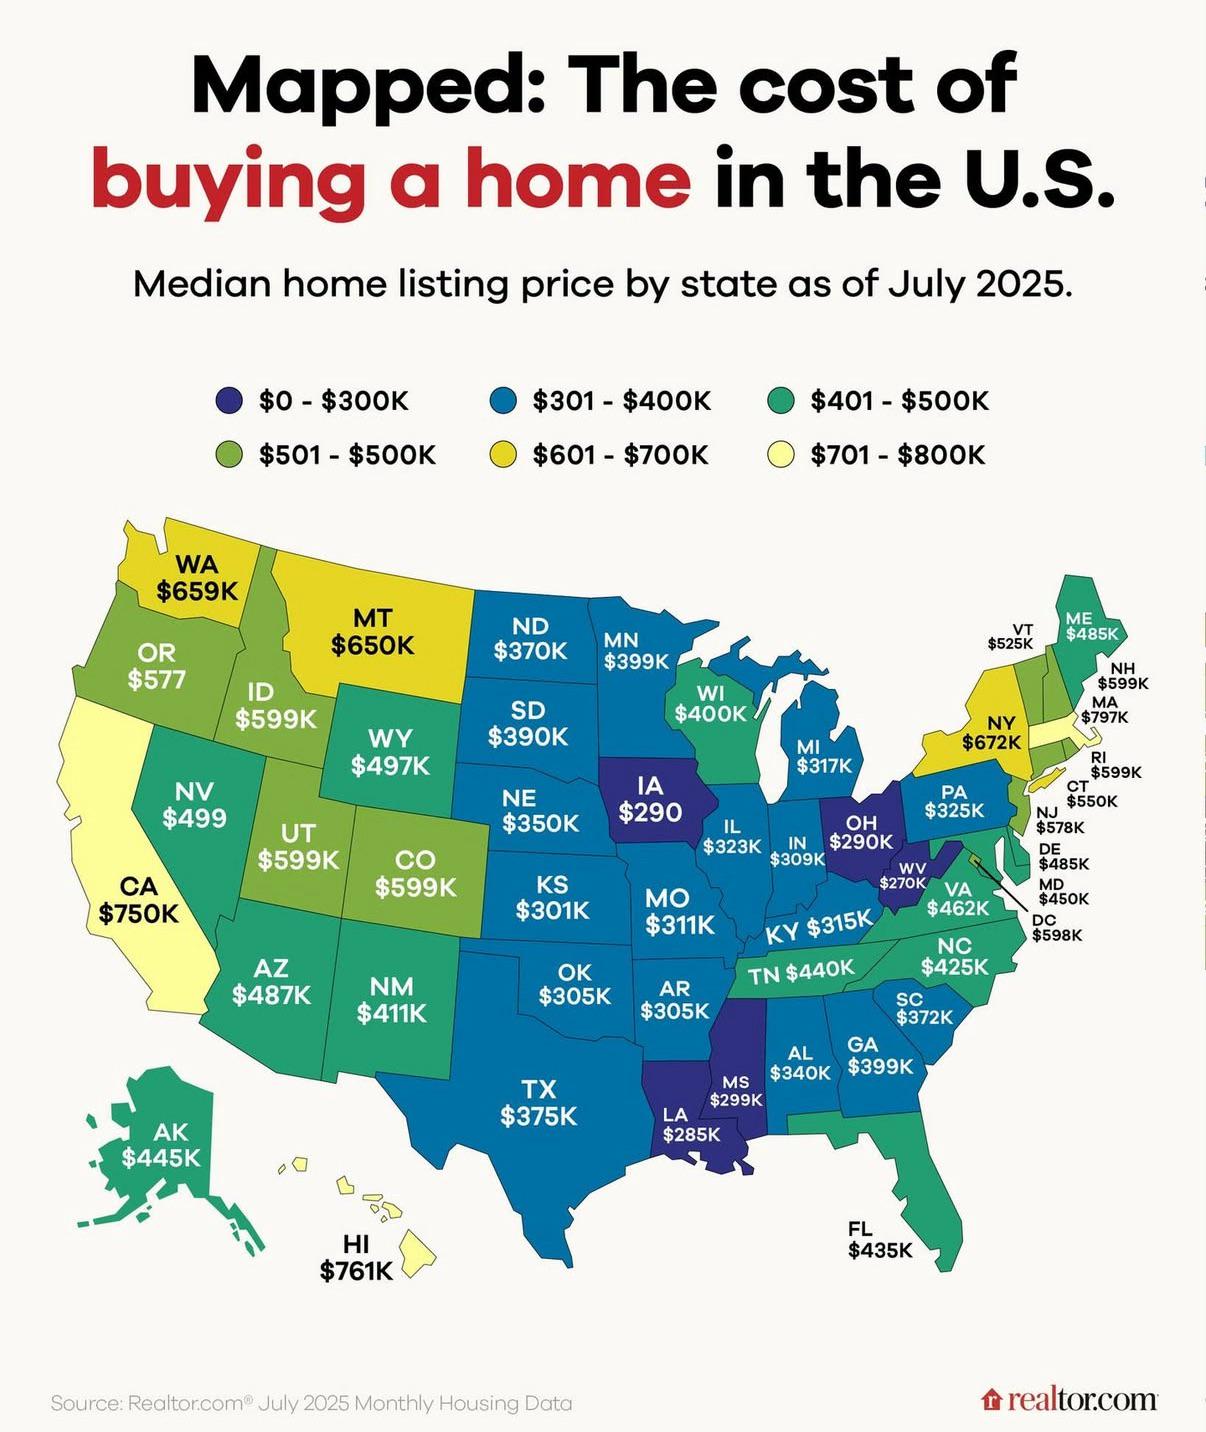
Median House Costs by US States Map
The "Median House Costs by US States as of July 2025" map provides a visual representation of the median housing prices ...
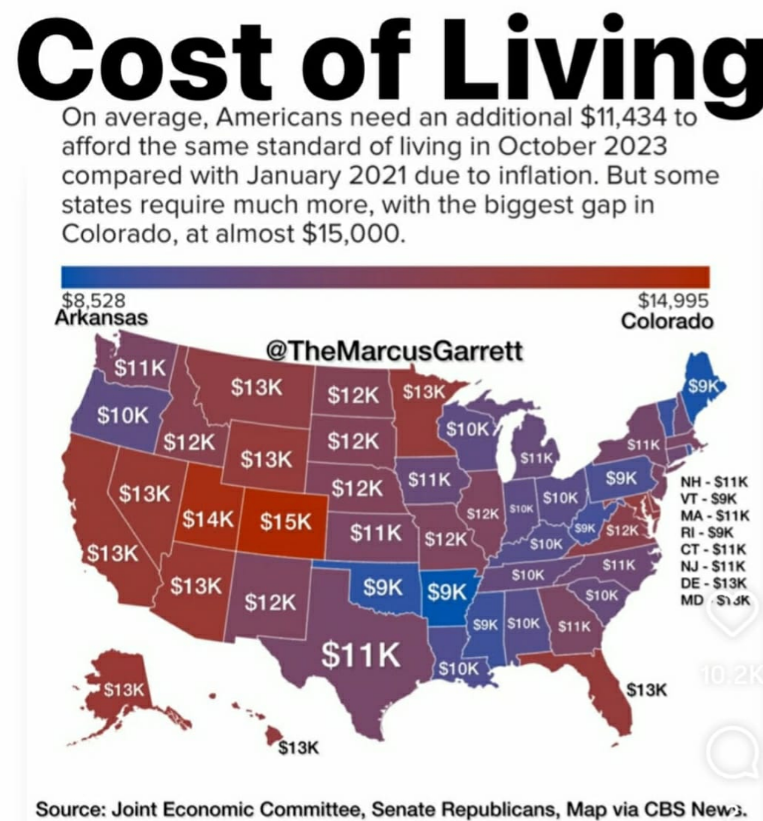
Cost of Living Increase by State Map
The visualization titled "The Shocking Difference in Cost of Living Increase Across U.S. States" effectively highlights ...
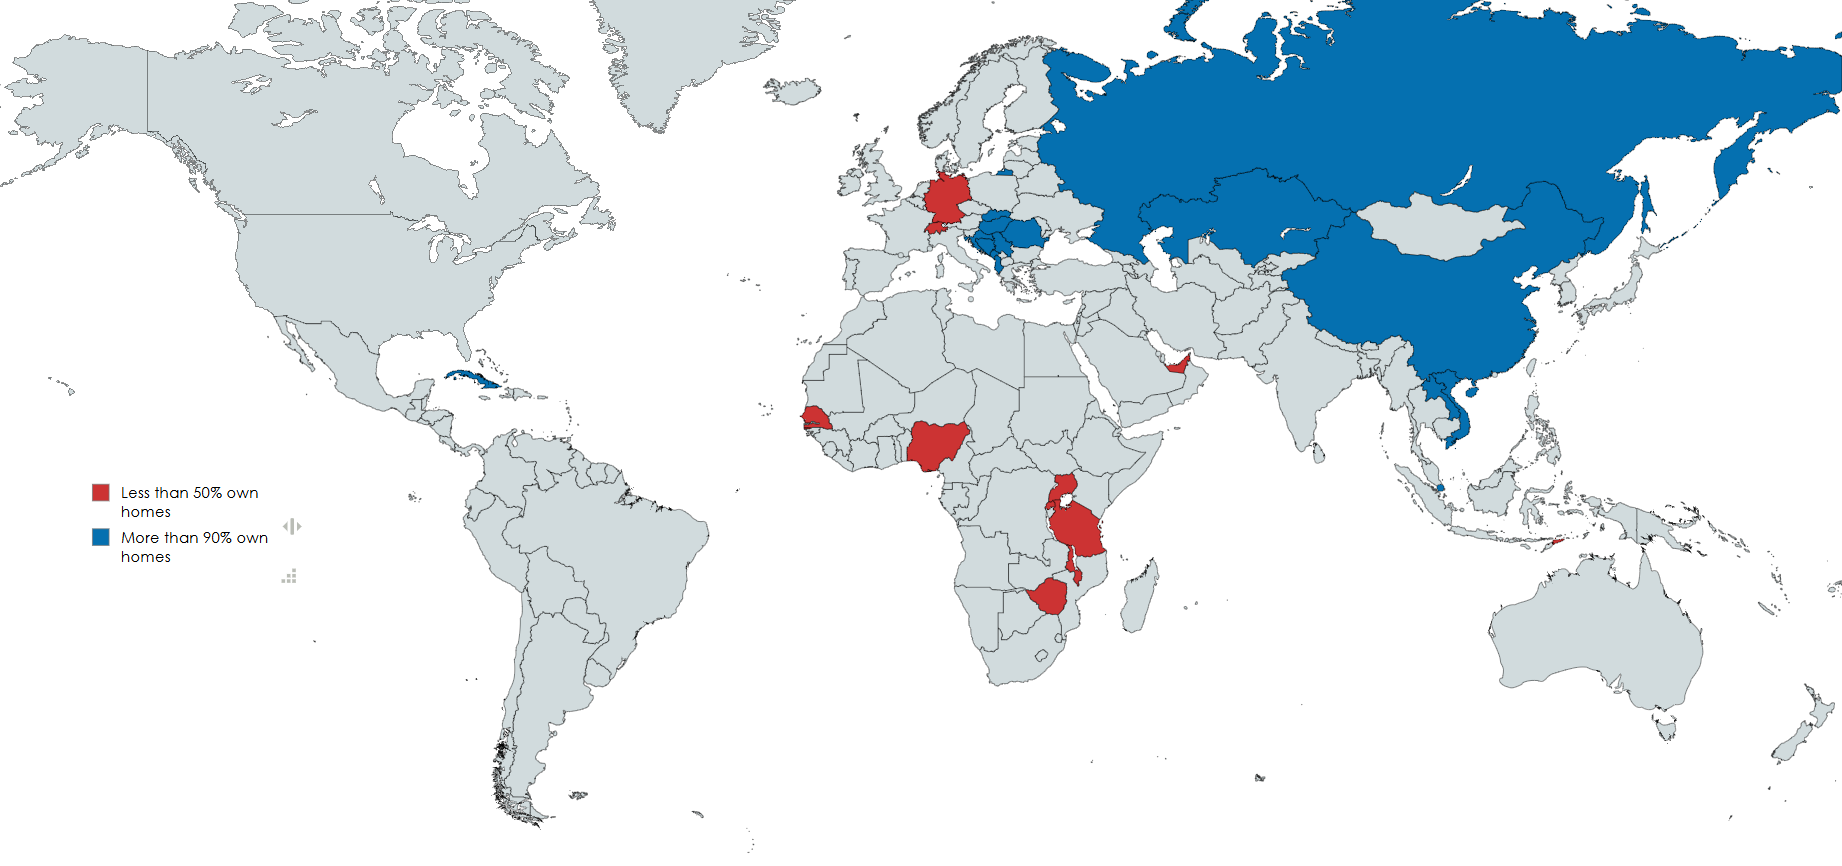
Home Ownership Rates by Country Map
This map highlights a striking contrast in home ownership rates across different countries, categorizing them into two d...
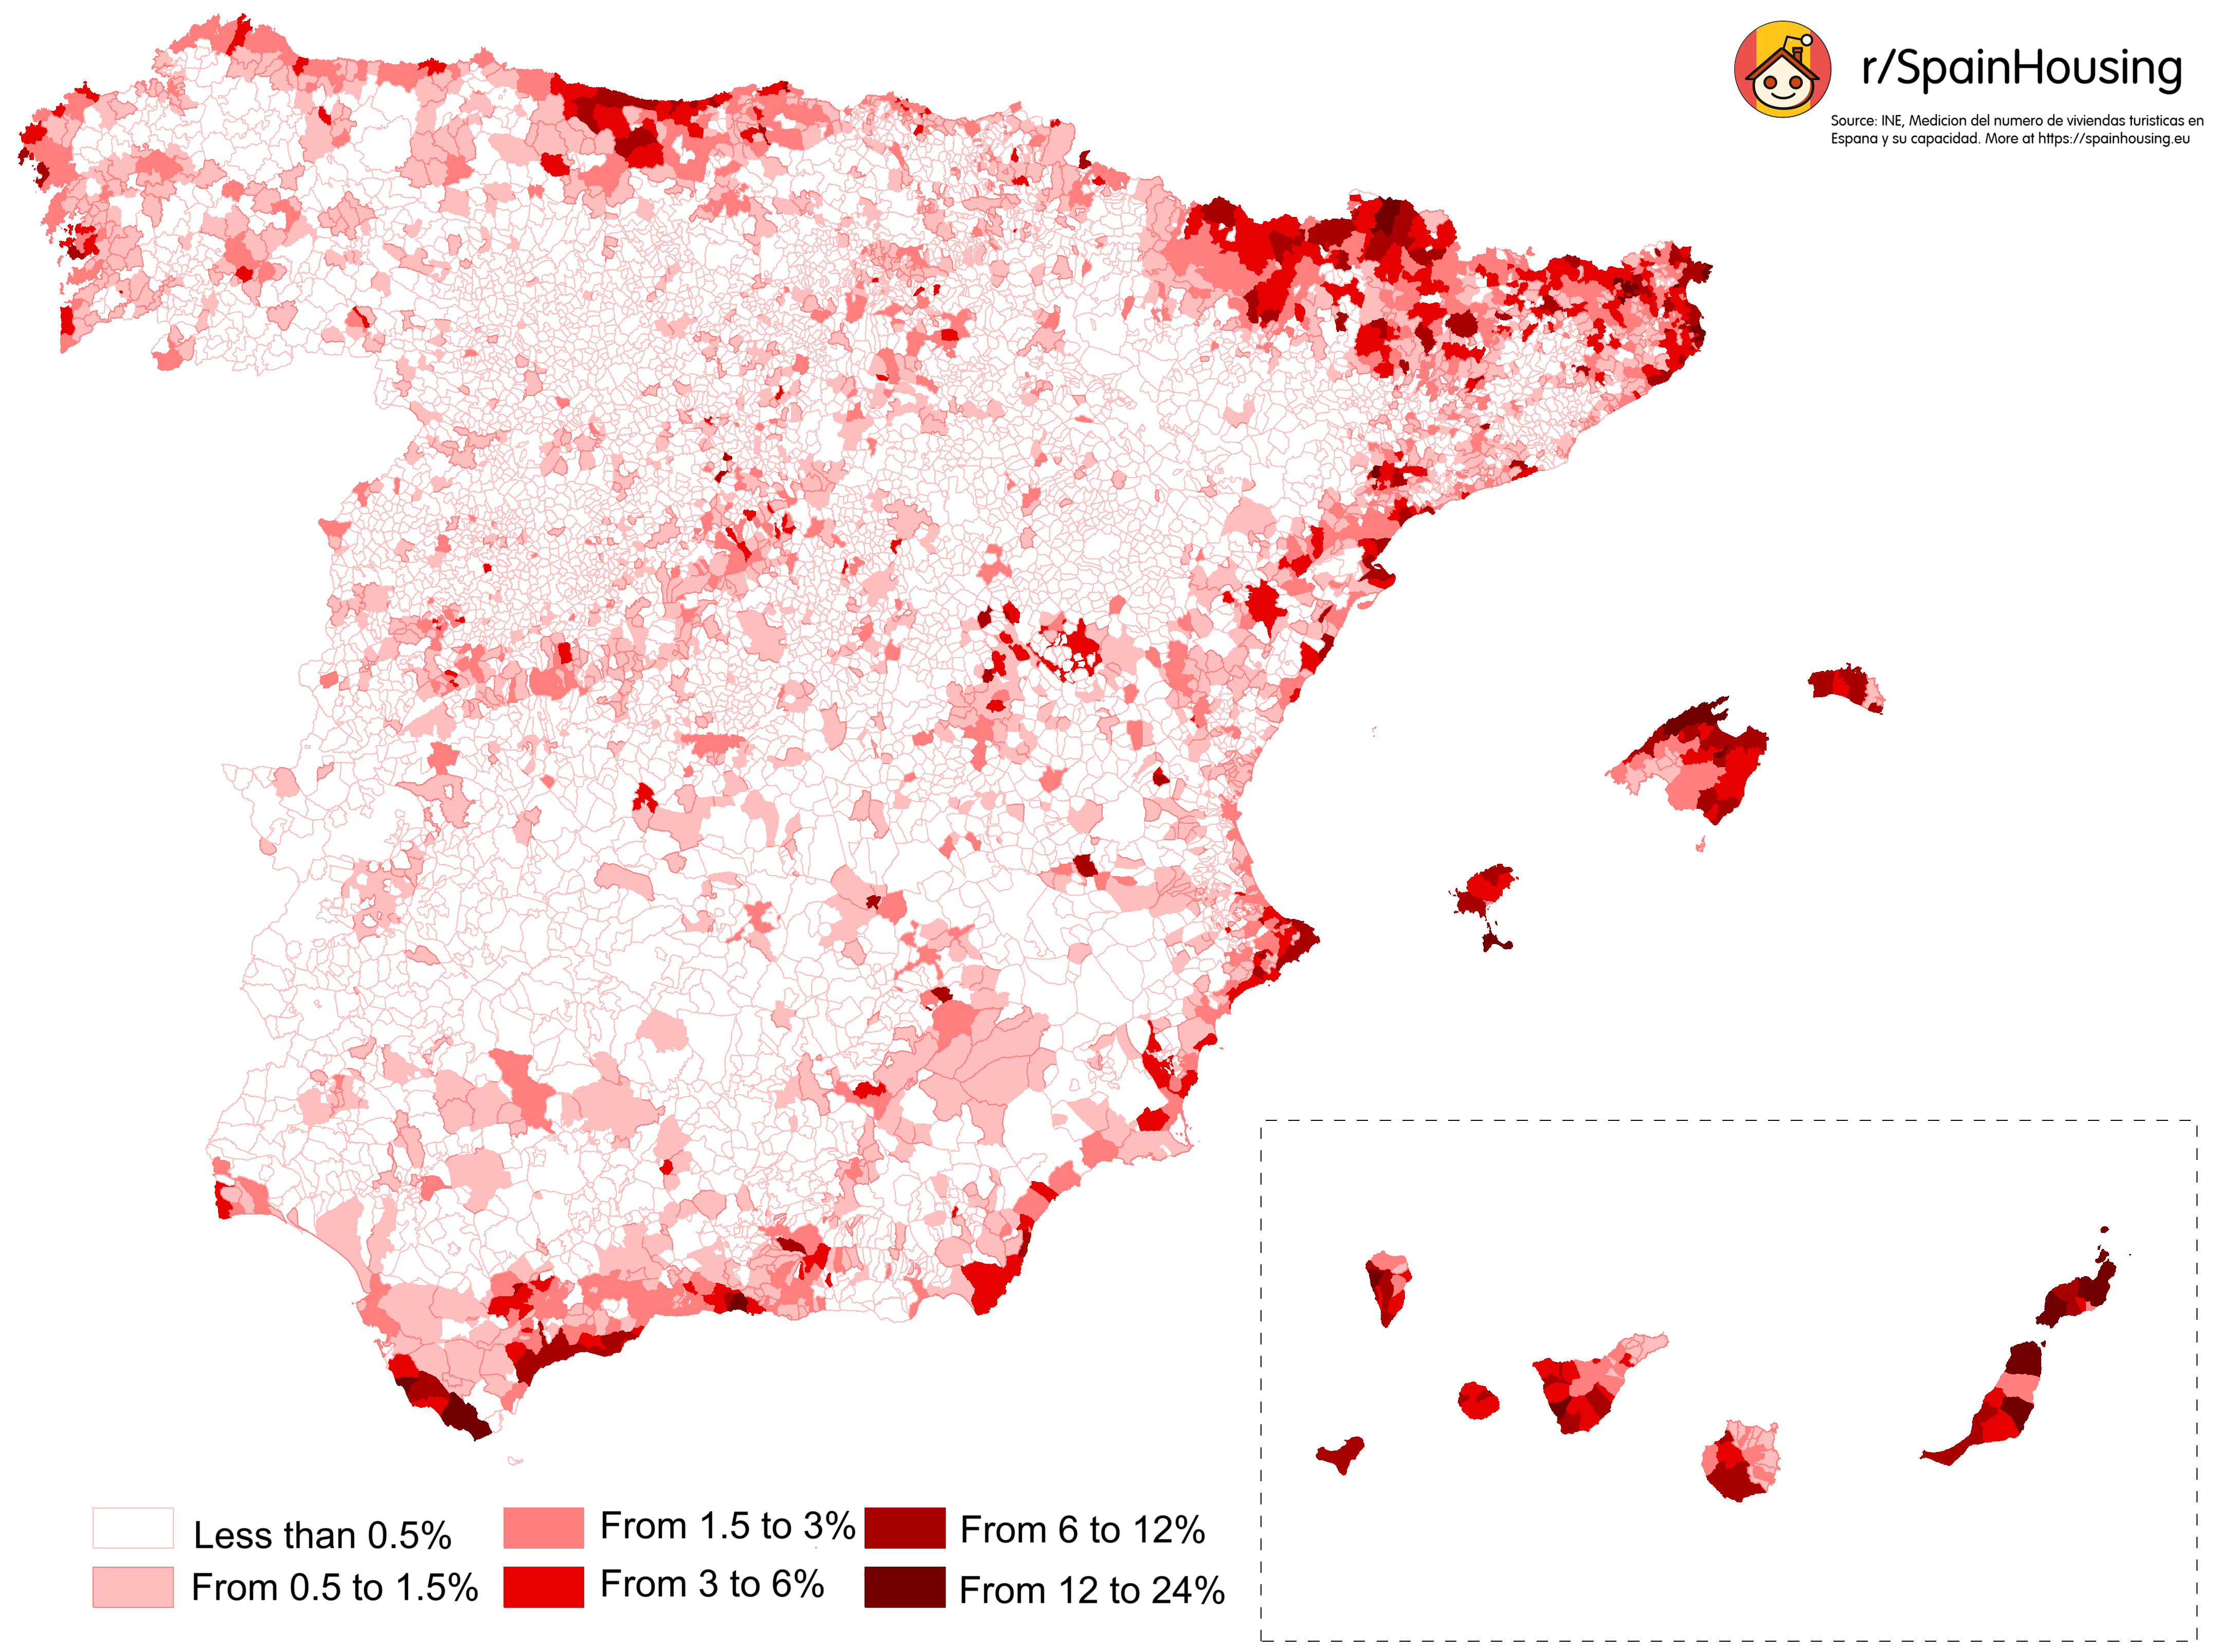
Map of Homes Used for Tourist Rentals in Spain
The map titled "Percentage of Homes Used for Tourist Rentals in Spain" provides a compelling visualization of how many r...
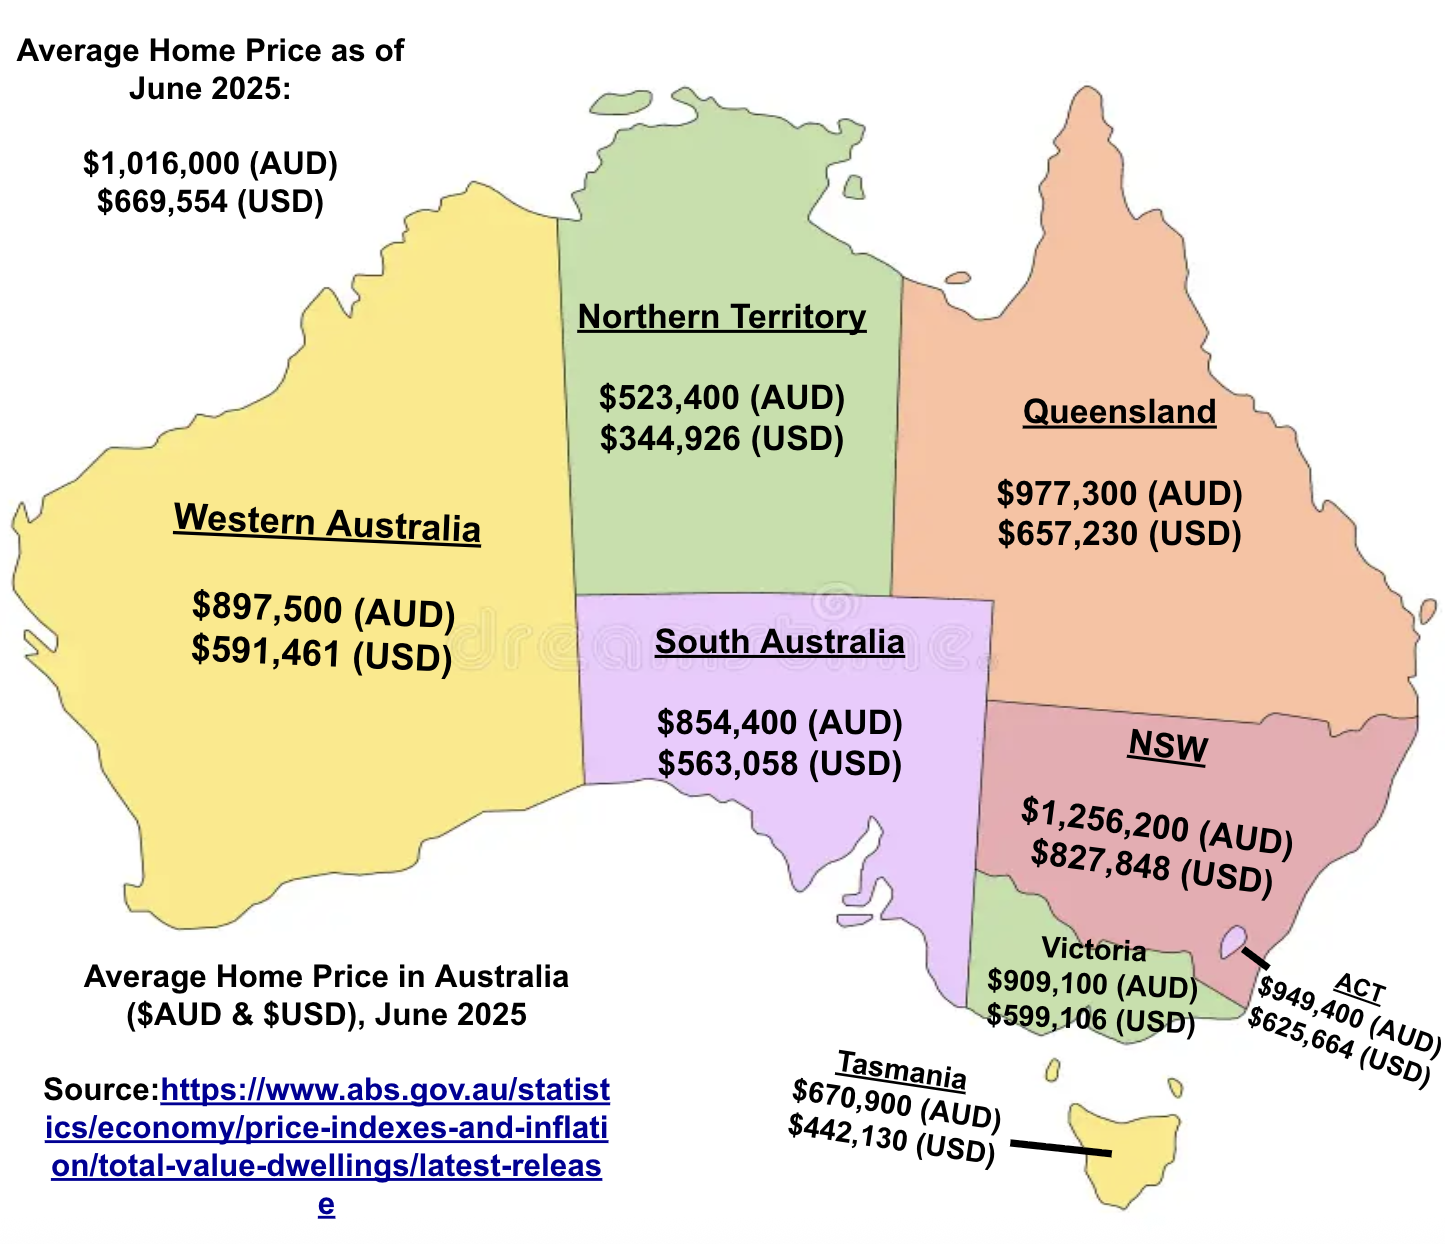
Average Home Price Map in Australia, June 2025
The visualization titled "Average Home Price in Australia ($AUD & $USD), June 2025" presents a detailed overview of the ...