Median House Costs by US States Map

Marcus Rodriguez
Historical Geography Expert
Marcus Rodriguez specializes in historical cartography and geographic data analysis. With a background in both history and geography, he brings unique...
Geographic Analysis
What This Map Shows
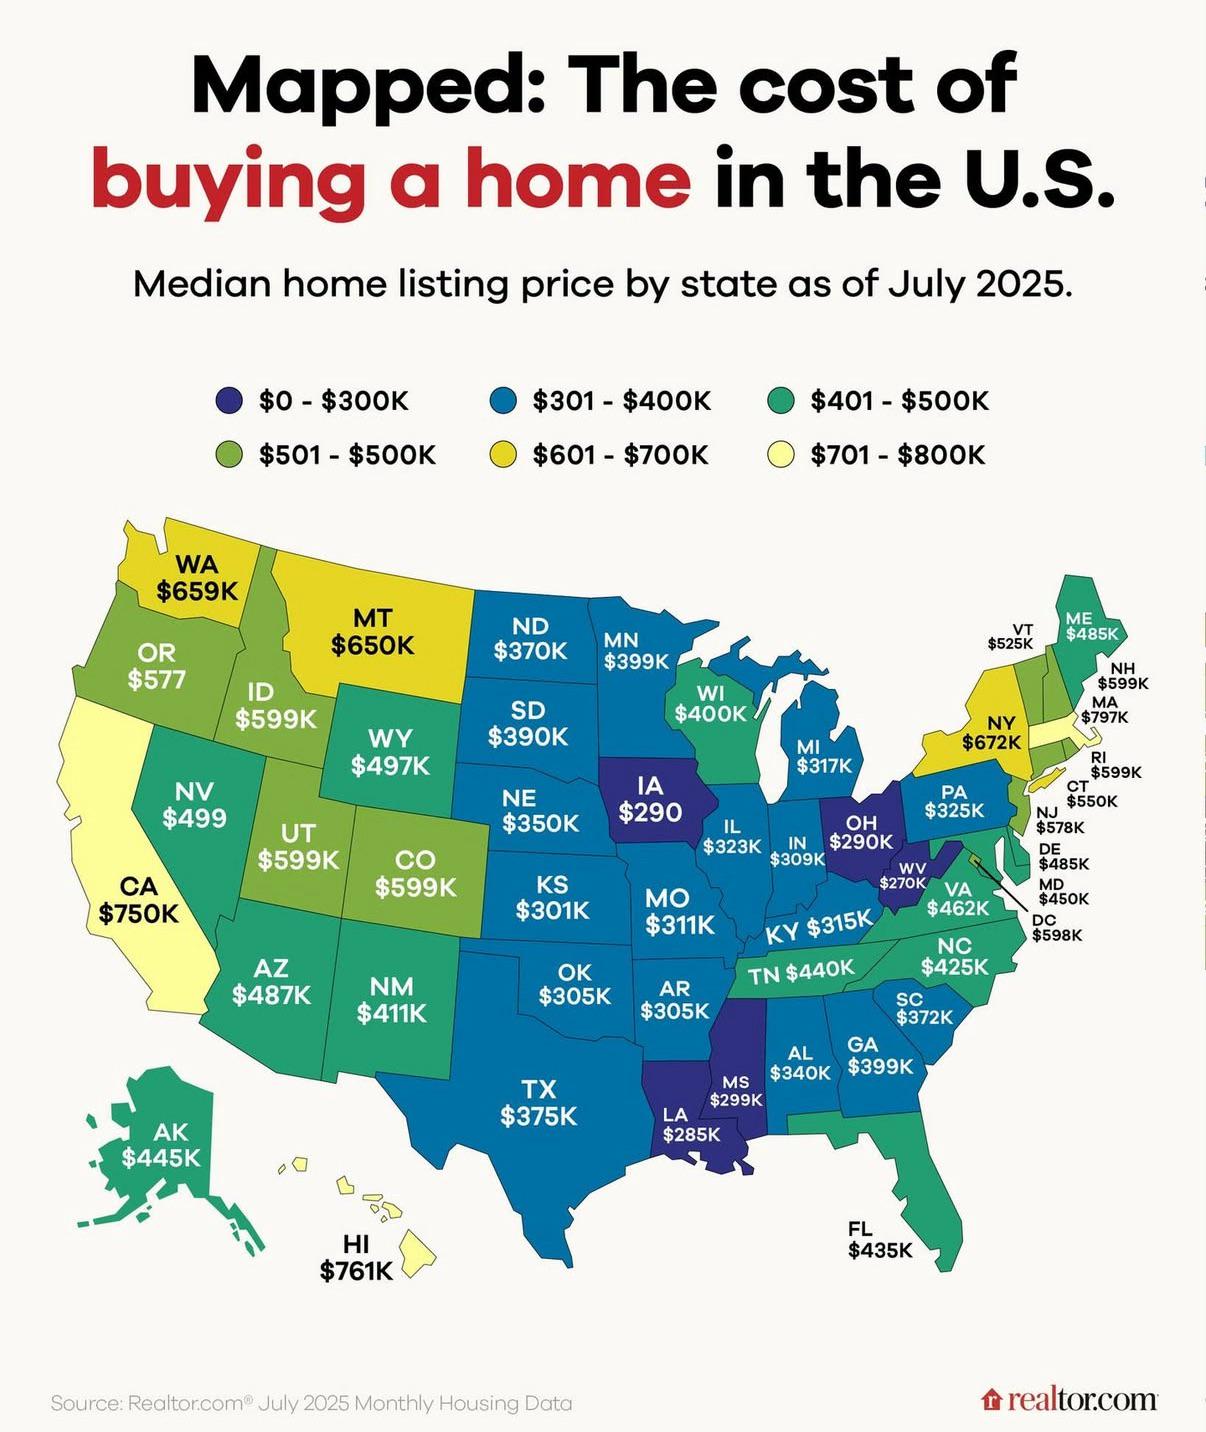
The "Median House Costs by US States as of July 2025" map provides a visual representation of the median housing prices across the United States. This map is particularly valuable for prospective homebuyers, real estate investors, and policymakers, as it highlights significant economic trends and regional disparities in the housing market. By indicating the median house costs in various states, the map allows users to quickly grasp where housing is more affordable or, conversely, where it may be prohibitively expensive.
Interestingly, housing costs can reflect various underlying economic factors, including population density, job availability, and local amenities. The visualization enables viewers to see these differences at a glance, paving the way for deeper discussions about housing affordability and economic health across the nation.
Deep Dive into Housing Costs
Housing costs are influenced by multiple factors, including supply and demand dynamics, local economies, and even historical trends. For instance, states like California and New York are known for their high median home prices, often exceeding the national average. In California, a combination of tech industry growth and limited land availability has driven prices skyward, with areas like San Francisco seeing median prices that can reach over $1 million.
Conversely, states like West Virginia and Mississippi often report much lower median house costs, sometimes under $200,000. This disparity can be attributed to various factors, such as lower demand, smaller urban centers, and less economic activity overall. Interestingly, these lower costs can attract those seeking affordability, prompting a migration of individuals and families from more expensive states.
Have you ever wondered why some states experience rapid housing price increases while others remain stagnant? Economic growth, population shifts, and even local policies play crucial roles. For instance, states that invest in infrastructure and job creation often experience a corresponding increase in housing demand, driving up costs. Meanwhile, areas that lack such investments may see homes linger on the market, which can keep prices down.
Additionally, the type of housing available can vary significantly by region. Urban areas typically feature more condos and multi-family units, while rural states may offer more single-family homes. This variation affects not just median prices, but also the overall housing landscape, influencing everything from community structure to demographic patterns.
Regional Analysis
When analyzing the map regionally, it’s striking to see how the West Coast compares to the Midwest. For example, California's median house costs are substantially higher than states like Ohio or Indiana. In the Midwest, states like Illinois have median prices that hover around the national average, but the cost of living can still be much lower than in coastal states.
The South presents a mixed picture as well. States such as Texas demonstrate significant urban growth, leading to increased housing demand and rising prices in cities like Austin and Dallas. In contrast, rural southern states may still offer affordable options, making them attractive to families and retirees looking to escape urban congestion.
Interestingly, even within states, there can be stark contrasts. For instance, in Florida, areas like Miami boast high median prices, driven by tourism and a growing job market, while more rural areas in the Panhandle may offer houses at a fraction of the cost. These variations underscore the importance of local markets and the fact that state averages can sometimes mask significant regional differences.
Significance and Impact
Understanding median house costs is crucial for several reasons. Firstly, it provides insight into economic health and stability. High housing costs can indicate a robust economy, but they can also lead to affordability crises, pushing lower-income families out of the housing market. As cities grow and develop, maintaining affordable housing becomes a pressing issue, impacting everything from education to local business sustainability.
Moreover, as the nation faces challenges like inflation and shifting demographics, keeping an eye on housing trends becomes essential. Future projections indicate that as remote work continues to reshape where people choose to live, we may see new patterns emerging in housing costs. Areas that were once considered affordable might become the next hot spots, while traditionally expensive regions could see a decline in demand.
In conclusion, the "Median House Costs by US States" map serves as an essential tool for understanding the complex landscape of American housing. By examining these costs, we can gain a deeper appreciation for the economic forces at play and the implications they hold for individuals and communities across the nation.
Visualization Details
- Published
- August 19, 2025
- Views
- 62
Comments
Loading comments...