SNAP Dependency by State Map

David Chen
Data Visualization Specialist
David Chen is an expert in transforming complex geographic datasets into compelling visual narratives. He combines his background in computer science ...
Geographic Analysis
What This Map Shows
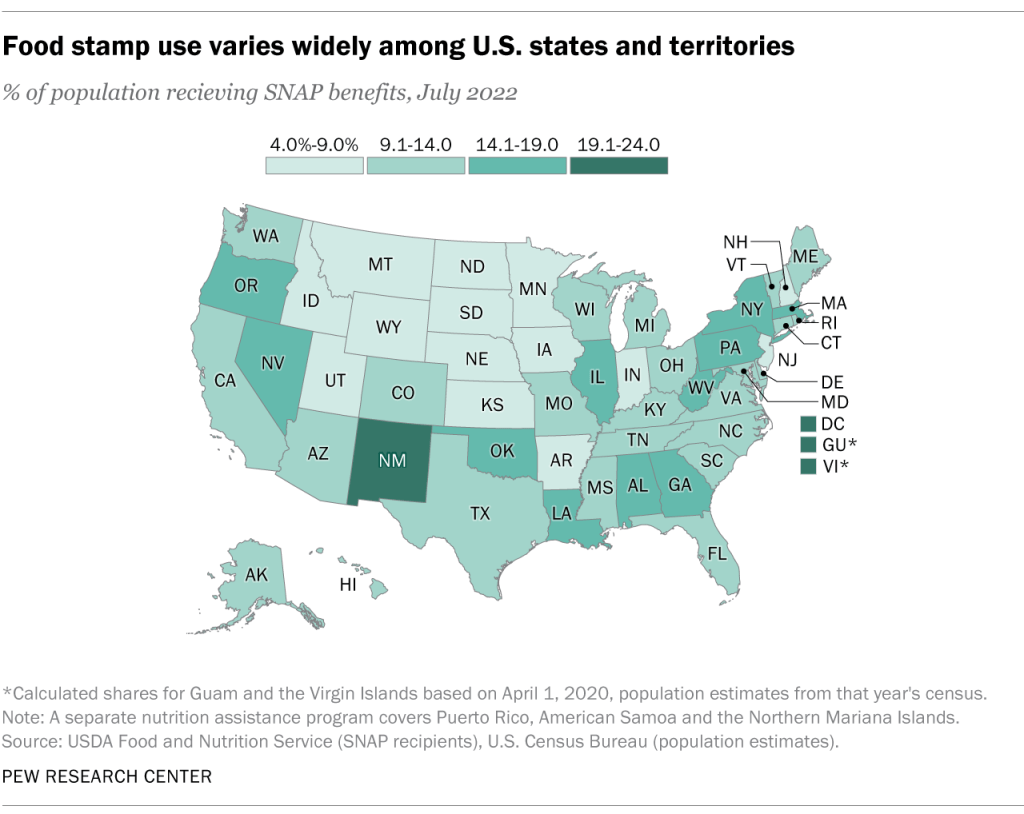
The "SNAP Dependency by State Map" visually illustrates the percentage of the population in each U.S. state that relies on the Supplemental Nutrition Assistance Program (SNAP). This program, formerly known as food stamps, is a vital safety net for millions of Americans, providing assistance to individuals and families who struggle to afford nutritious food. The map highlights the disparities across states, showcasing not just the areas with the highest dependency but also those with comparatively lower levels of reliance on this support.
Deep Dive into SNAP Dependency
SNAP is a crucial program that plays an essential role in the U.S. social safety net. Funded by the federal government but administered by individual states, SNAP helps combat food insecurity, which affects millions of individuals and households across the country. Interestingly, SNAP provides benefits based on income, family size, and other factors, thereby adjusting to the varying needs of American families.
As of recent data, approximately 41 million Americans participate in SNAP, translating to about 12% of the U.S. population. The dependency rate, however, varies significantly across different states. For instance, states like Louisiana, Mississippi, and New Mexico often report some of the highest rates of SNAP dependency, with over 20% of their populations relying on the program. In contrast, states such as North Dakota, Wyoming, and Minnesota tend to show much lower dependency rates, often below 5%.
Interestingly, the factors influencing these differences are multifaceted. Economic conditions, unemployment rates, and demographic factors all contribute to the varying levels of SNAP dependency. States with higher poverty rates and limited job opportunities naturally see more individuals turning to SNAP for assistance. Moreover, certain regions, especially those with significant agricultural backgrounds, may experience cyclical fluctuations in employment opportunities, which can lead to spikes in SNAP enrollment during off-seasons.
Furthermore, the rural-urban divide significantly impacts SNAP dependency. Rural areas, which may face unique economic challenges, often have higher dependency rates compared to urban regions. This is partly due to the availability of jobs, access to education, and overall economic stability. In urban areas, while food insecurity still exists, residents may have better access to employment opportunities and support services that can help alleviate the need for SNAP.
Regional Analysis
Examining the country through the lens of the SNAP dependency map reveals significant regional trends. The Southern states, particularly those in the Deep South, consistently show higher dependency rates. For example, Mississippi has long been recognized as one of the states with the highest levels of SNAP participation. This can be attributed to a combination of high poverty rates, low wages, and limited access to resources.
In contrast, states in the Northeast typically show lower dependency rates. For instance, New Hampshire and Massachusetts have some of the lowest SNAP participation levels, often attributed to a higher cost of living and stronger job markets. Interestingly, even within states, there can be stark contrasts. Urban centers might have higher rates of dependency compared to suburban or rural areas due to the concentration of low-wage jobs and higher living costs.
Additionally, states like California present a mixed picture. While the state has a large population on SNAP, the sheer economic diversity means that many regions within California also experience lower dependency rates. This highlights how local economies and demographics can influence overall participation rates.
Significance and Impact
Understanding SNAP dependency is crucial for various reasons. First, it serves as a critical indicator of economic health and social welfare in the U.S. The reliance on SNAP can reflect broader issues such as poverty, unemployment, and food insecurity. As we navigate economic challenges – from recessions to the ongoing impacts of the COVID-19 pandemic – monitoring changes in SNAP dependency can provide insight into the effectiveness of social programs and the state of the economy.
Moreover, as discussions around food security and public health continue to gain traction, the significance of SNAP cannot be overstated. It not only impacts those who receive benefits but also the economy at large. Every dollar spent on SNAP is estimated to generate about $1.70 in economic activity, helping to support local businesses and communities.
Looking to the future, there may be shifts in SNAP dependency due to changing economic conditions, policy adjustments, and demographic changes. For example, the rise of gig economy jobs and shifts in traditional employment patterns could affect eligibility and participation rates. Additionally, ongoing discussions about the adequacy of SNAP benefits and potential reforms may shape its future impact on American society.
In conclusion, the SNAP Dependency by State Map serves as a vital tool for understanding the complexities of food assistance in the United States. By examining the demographics and economic factors at play, we can better grasp the challenges many Americans face and the importance of social safety nets in fostering a healthier, more equitable society.
Visualization Details
- Published
- October 28, 2025
- Views
- 6
Comments
Loading comments...