Hispanic/Latino Population Percentage Map by State/Province

Marcus Rodriguez
Historical Geography Expert
Marcus Rodriguez specializes in historical cartography and geographic data analysis. With a background in both history and geography, he brings unique...
Geographic Analysis
What This Map Shows
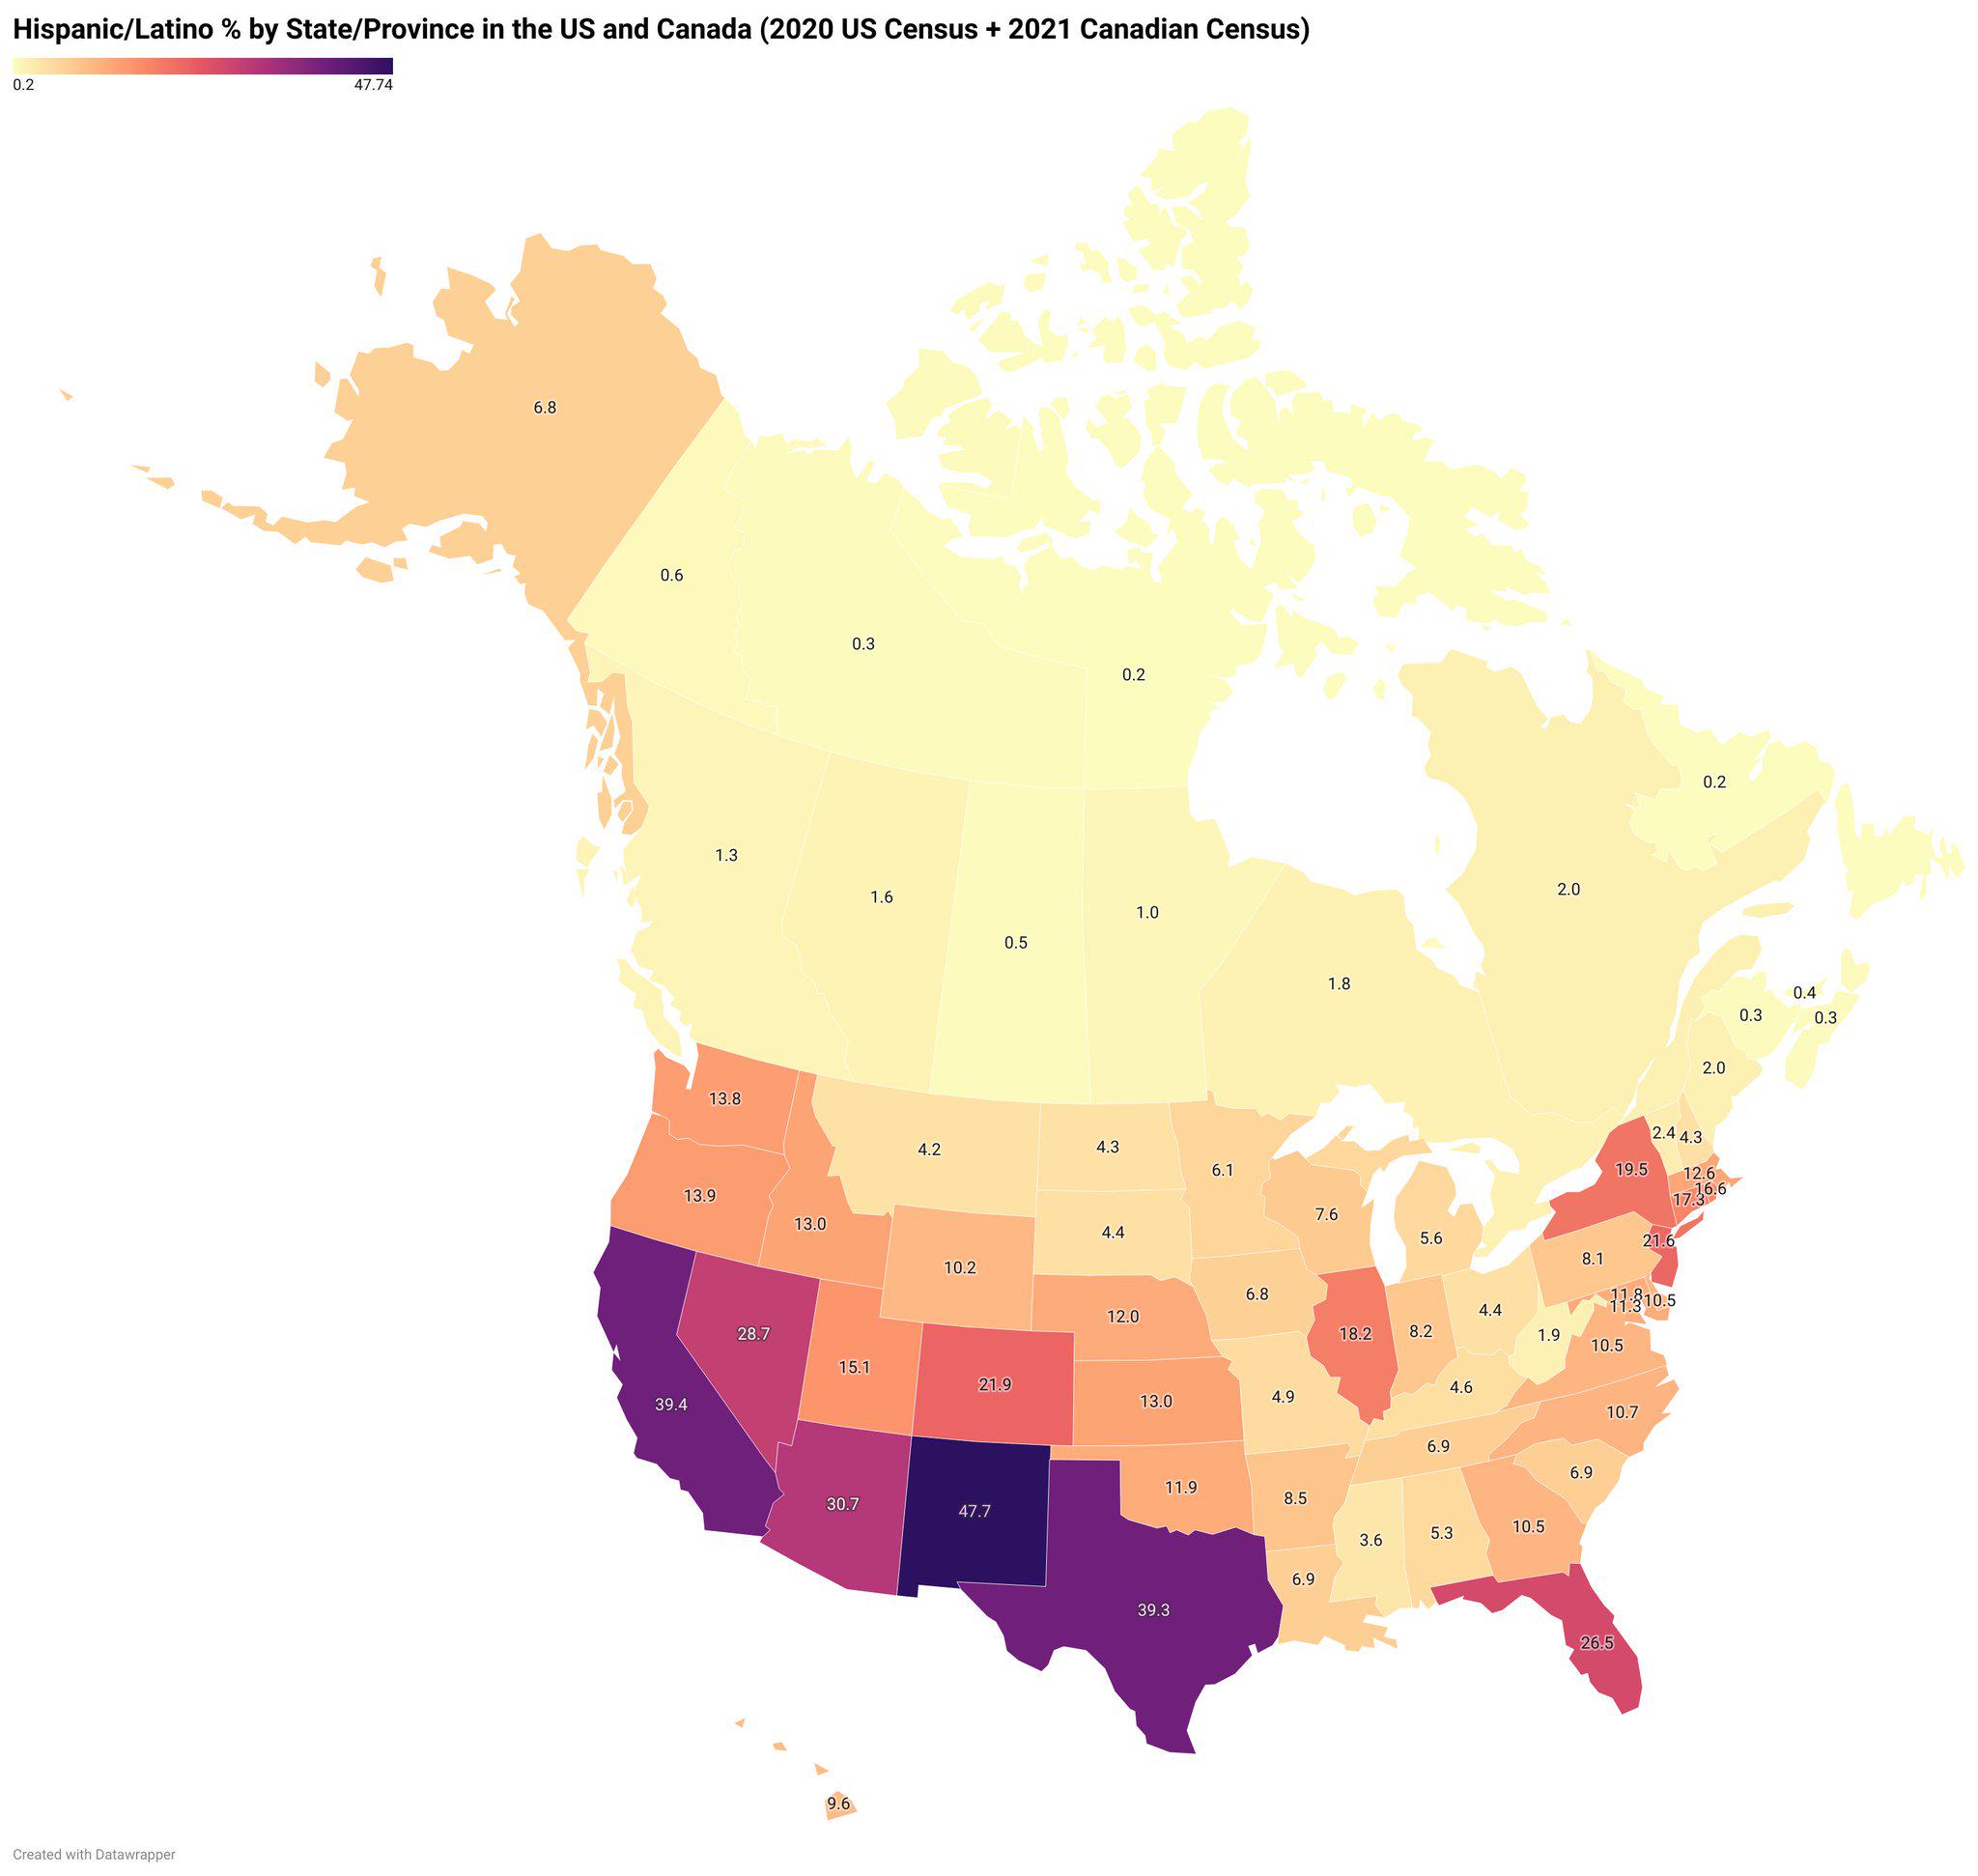
The "Map of the Hispanic/Latino % by State/Province in the US and Canada" provides a compelling visualization of the distribution of Hispanic and Latino populations across North America. With the United States exhibiting a substantial Hispanic population nearing 22%, in stark contrast, Canada has a mere 1.6%. This map highlights the varying percentages across different states and provinces, offering insights into demographic trends, cultural influences, and social dynamics.
Deep Dive into the Hispanic/Latino Population
The Hispanic and Latino population in the United States has seen remarkable growth over the past several decades. As of the latest census data, nearly 62 million people in the U.S. identify as Hispanic or Latino, making this group a significant demographic force. This population is characterized by its diversity, encompassing individuals from various countries, cultures, and backgrounds, including Mexico, Puerto Rico, Cuba, the Dominican Republic, and many Central and South American nations.
What's fascinating is that the concentration of Hispanic/Latino individuals varies widely from one state to another. For example, states like California and Texas stand out with their high percentages; California boasts approximately 39% and Texas around 30%. These states not only have large urban centers, such as Los Angeles and Houston, but also rich cultural histories that reflect their Hispanic heritage.
On the other hand, states in the Northeast, like Vermont and New Hampshire, have significantly lower percentages, often below 5%. This disparity raises interesting questions about migration patterns, economic opportunities, and social integration. Many Hispanic individuals move to areas with established communities and job prospects, contributing to a cycle of demographic growth that can transform local cultures over time.
Moreover, the Hispanic population is younger than the national average, with a median age of around 29 compared to the overall U.S. median of 38. This demographic trend can influence everything from education systems to labor markets, as younger populations may lead to increased demand for schools and jobs. Interestingly, this younger demographic is also growing in educational attainment, with more Hispanic individuals pursuing higher education, thus contributing to the evolving economic landscape.
In Canada, the Hispanic/Latino population is quite small, constituting about 1.6% of the total population. While this figure seems modest, it represents a growing community predominantly concentrated in urban areas like Toronto and Vancouver. The differences in percentages between the U.S. and Canada can be attributed to various factors, including immigration policies, historical migration patterns, and the socio-economic landscape of each country.
Regional Analysis
When analyzing the map, distinct regional patterns emerge. In the Southwest U.S., for instance, states such as Arizona and New Mexico also have high Hispanic populations, often exceeding 45%, which is influenced by historical ties to Mexico and the long-standing presence of Hispanic communities. In contrast, states like North Dakota and South Dakota show percentages that hover around 2%, indicating limited Hispanic influence.
Interestingly, the Midwest presents a mixed picture. States such as Illinois, particularly in cities like Chicago, have robust Hispanic communities, with percentages nearing 20%. However, neighboring states like Iowa and Wisconsin show much lower figures, often influenced by rural demographics and differing immigration patterns.
In Canada, the provinces with the highest Hispanic/Latino populations are Ontario and British Columbia, where multicultural policies have fostered diverse communities. The trend in urban centers contrasts sharply with more rural provinces, where Hispanic representation is minimal. This geographical disparity emphasizes the role of urbanization in shaping demographic profiles.
Significance and Impact
Understanding the distribution of the Hispanic/Latino population is crucial, as it has far-reaching implications for social dynamics, economics, and politics. With Hispanic individuals representing a significant portion of the U.S. electorate, their influence on elections and policy-making is undeniable. As their numbers grow, issues such as immigration reform, education policy, and healthcare access become increasingly relevant.
Moreover, the cultural contributions of Hispanic communities enrich the social fabric of North America. From food to music and art, the influence is visible and vibrant, shaping local cultures and tourism. As we look to the future, the trends indicate that the Hispanic/Latino population will continue to grow, potentially reshaping national identities in both the U.S. and Canada.
In conclusion, the map not only serves as a geographical representation but also as a reflection of the changing tides of North American demographics. As we move forward, keeping an eye on these trends will be essential for understanding the broader socio-economic landscape.
Visualization Details
- Published
- October 24, 2025
- Views
- 10
Comments
Loading comments...