population trends Maps
16 geographic visualizations tagged with "population trends"
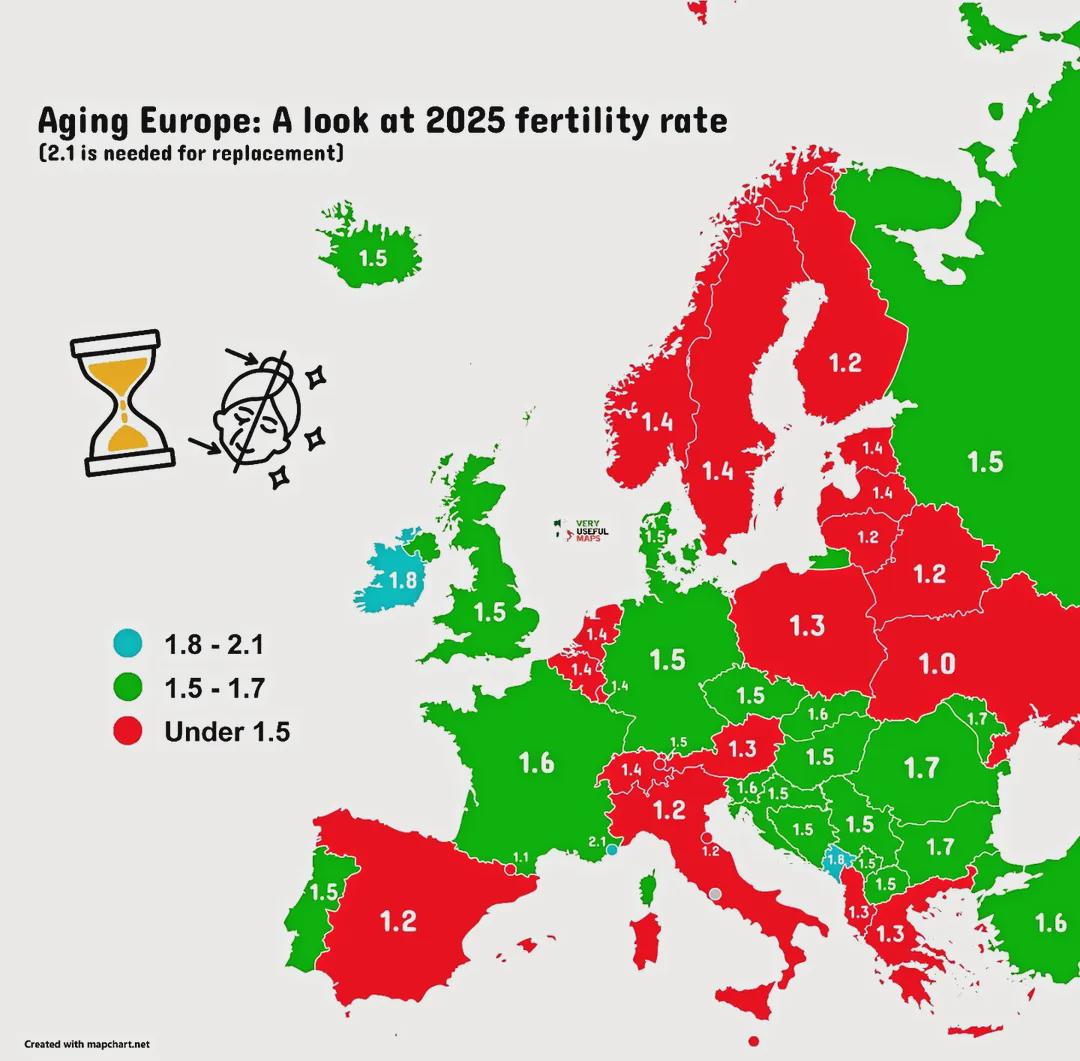
Ageing Population Map of Europe
The "Ageing Europe!" map provides a comprehensive visualization of the demographic shifts occurring across the continent...
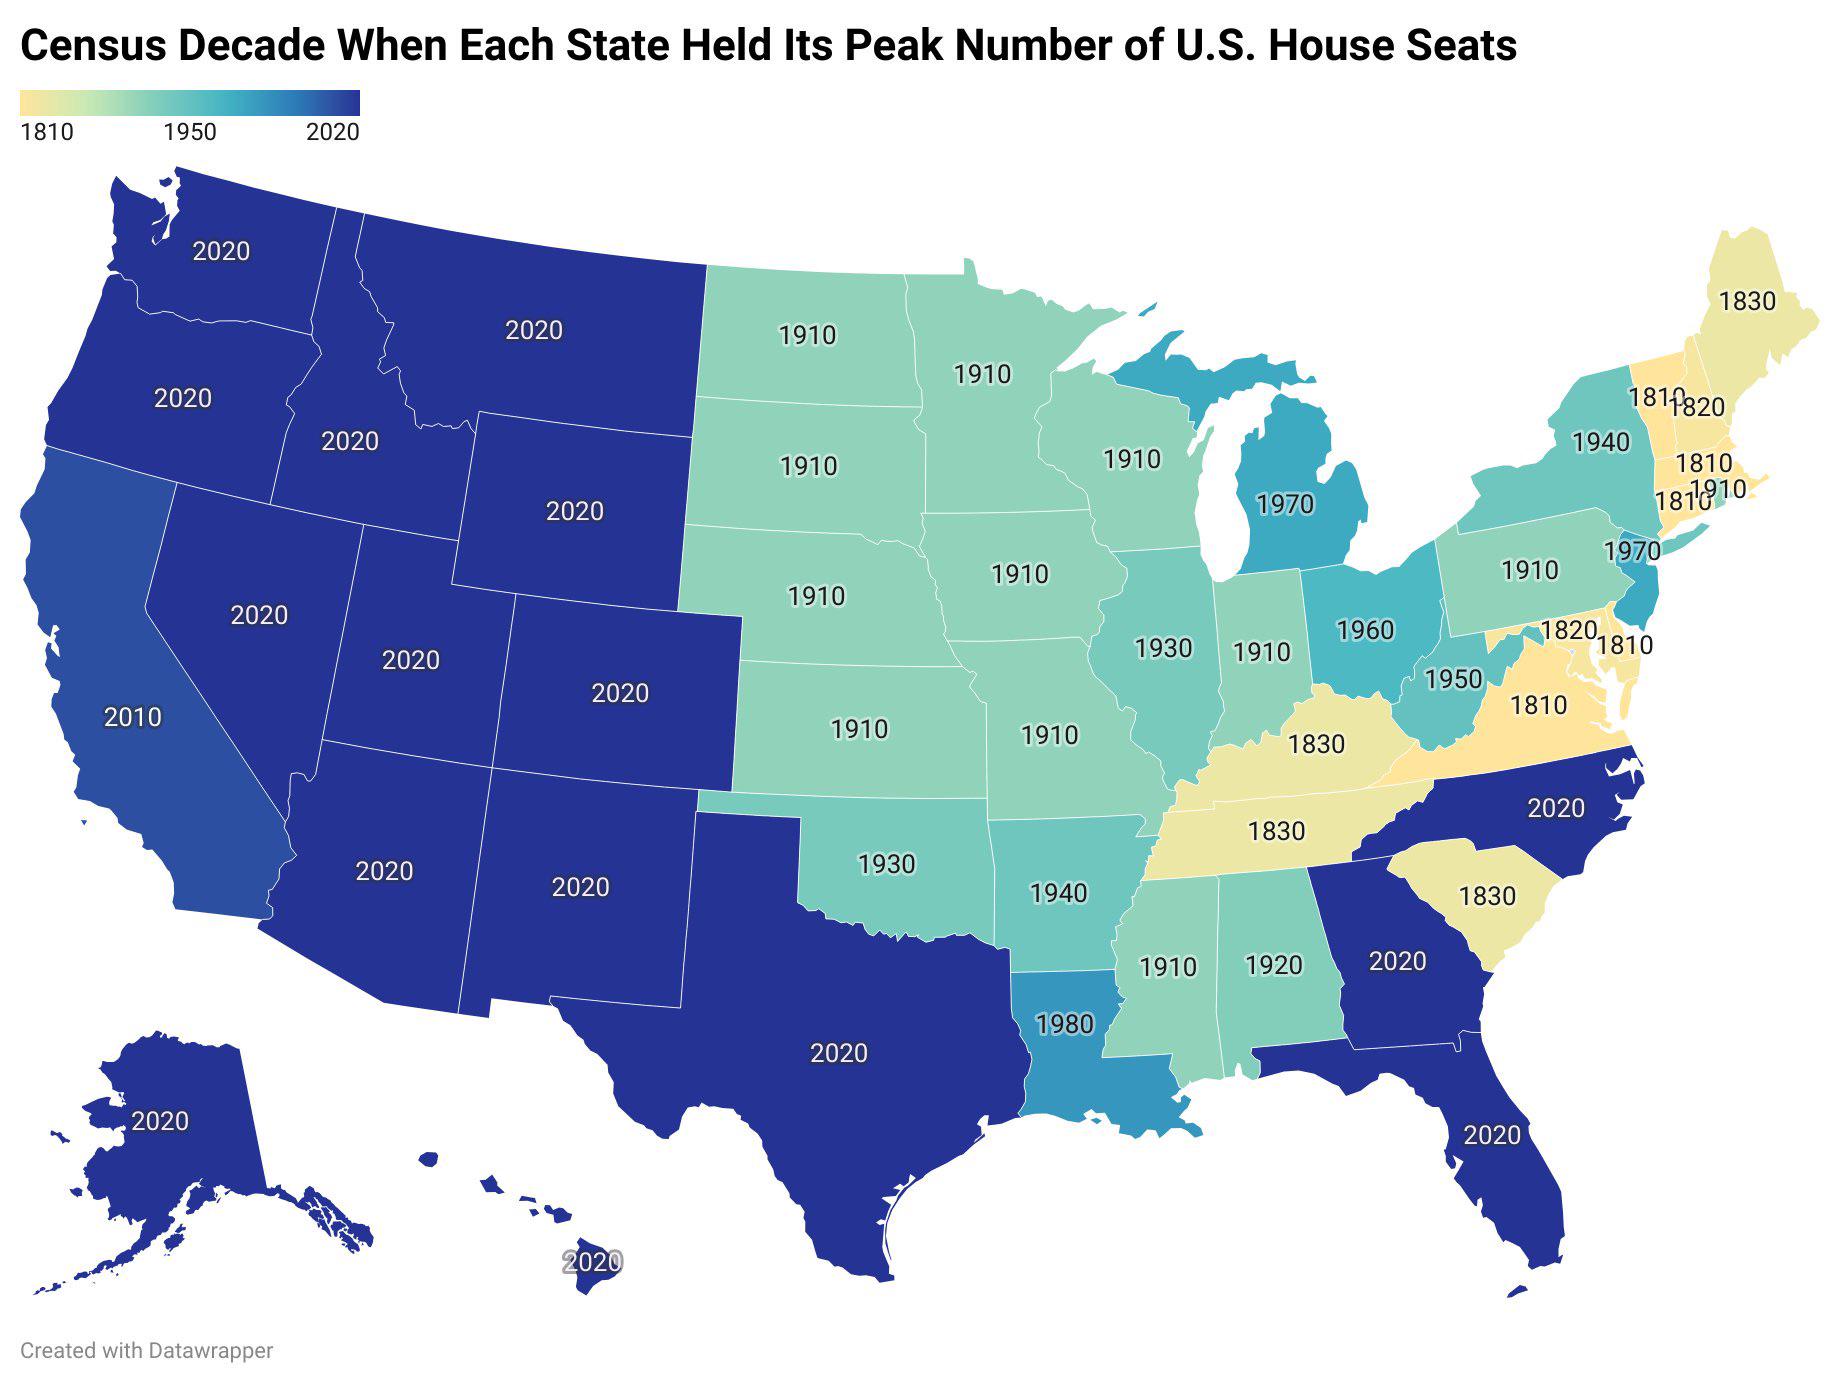
US States Peak House Seats Decade Map
This map visually represents the decade in which each U.S. state reached its maximum number of congressional House seats...
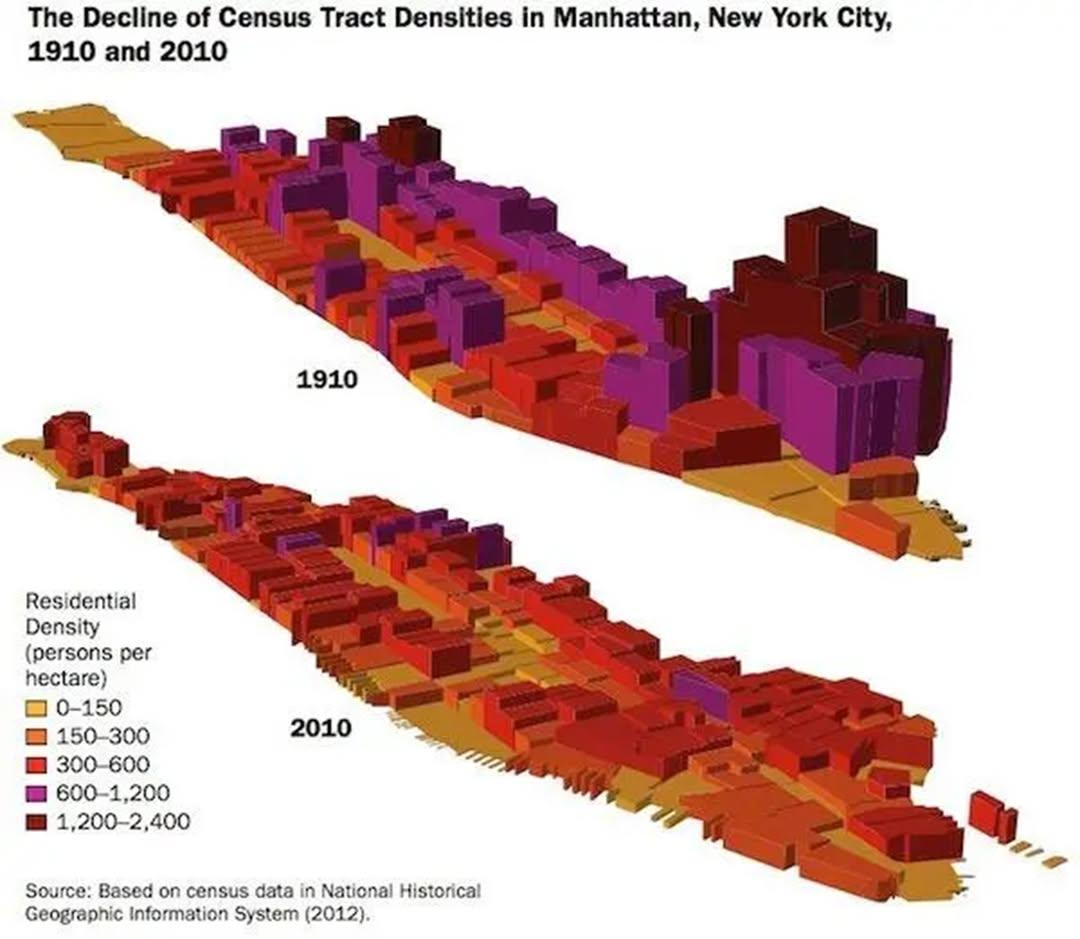
Manhattan Population Decline Map from 1910 to Today
Several factors have played a role in this population decline. The early 20th century was marked by rapid industrializat...
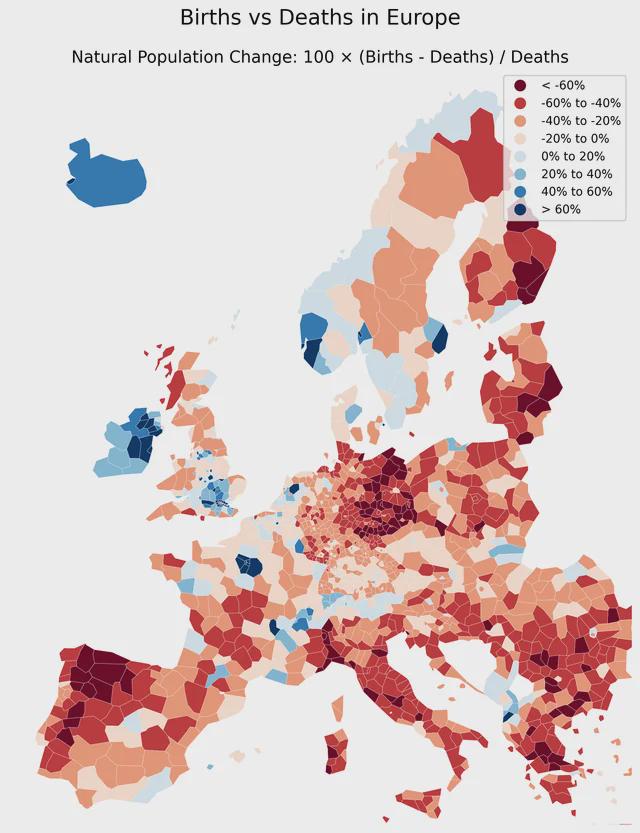
Births vs Deaths in Europe Map
...
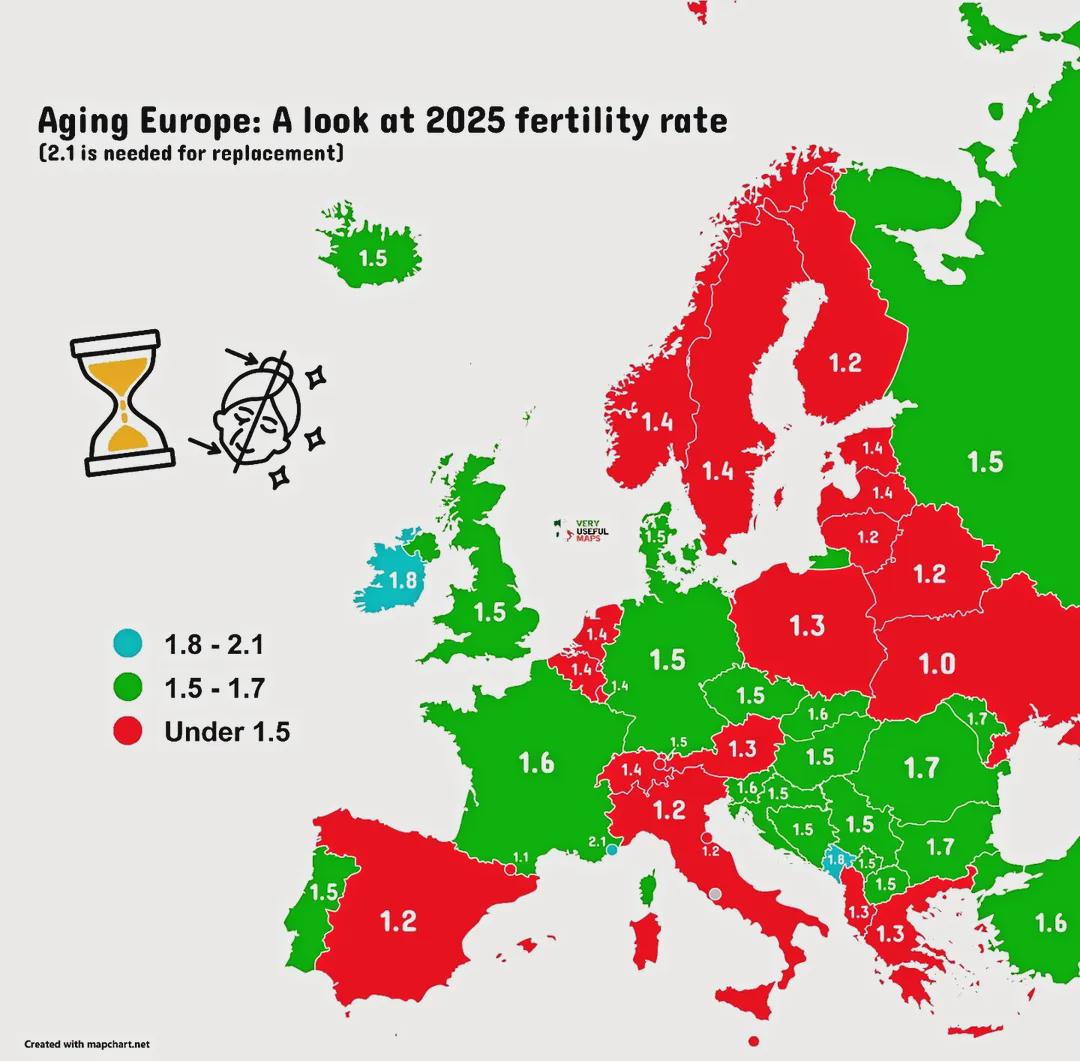
Ageing Population Map of Europe 2025
The "Ageing Population Map of Europe 2025" provides a comprehensive visualization of the demographic shifts occurring ac...
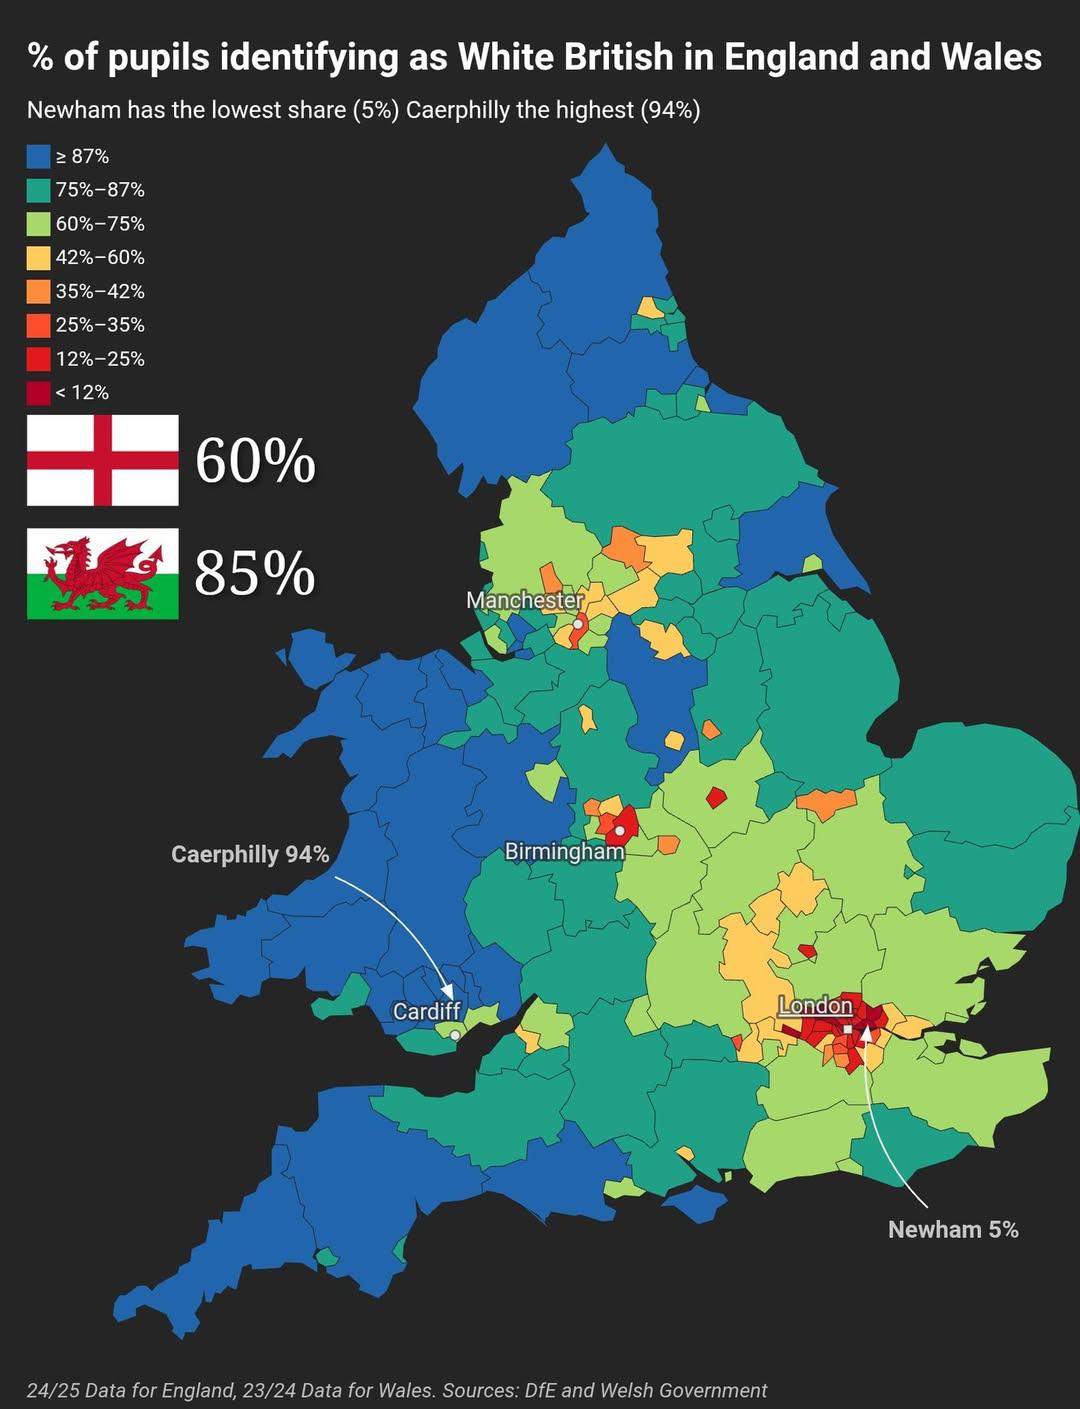
% of Pupils Identifying as White British in England and Wales Map
This map illustrates the percentage of pupils identifying as White British in England and Wales, providing a visual repr...
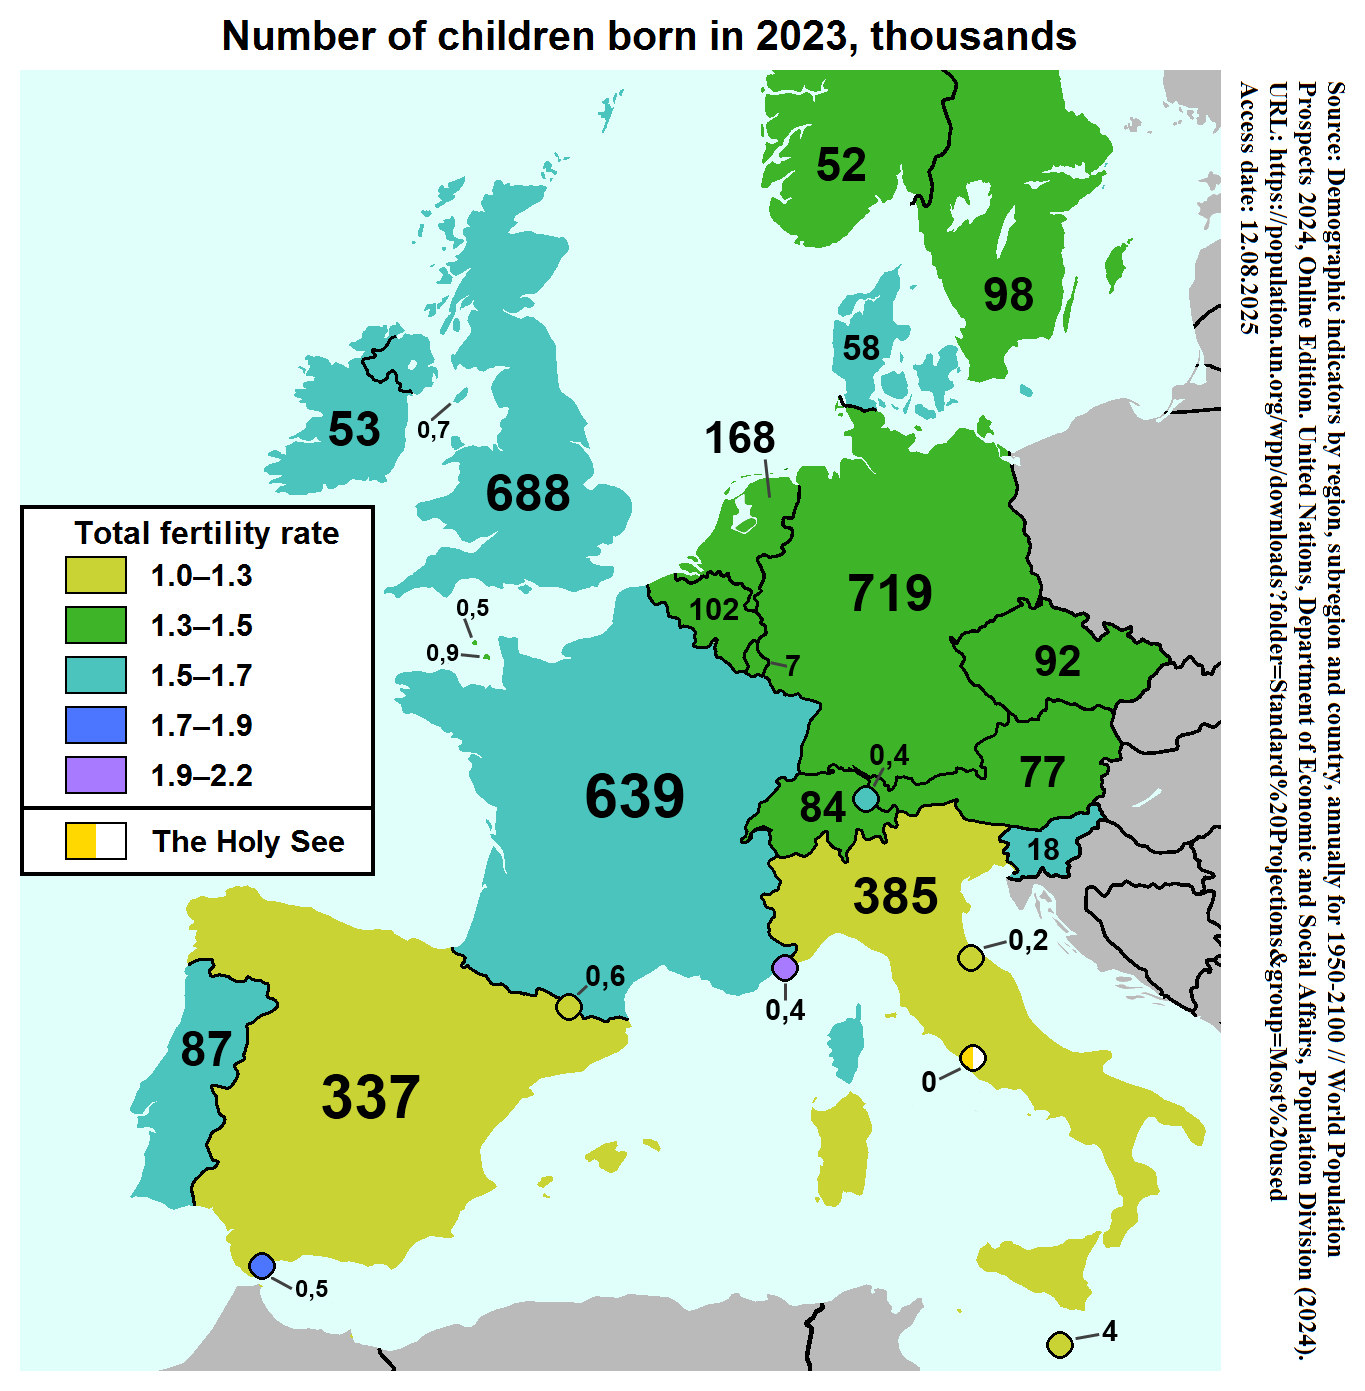
Total Fertility Rate and Children Born Map Western Europe 2023
The map titled "Total Fertility Rate and Number of Children Born in Western Europe, 2023" visually represents the fertil...
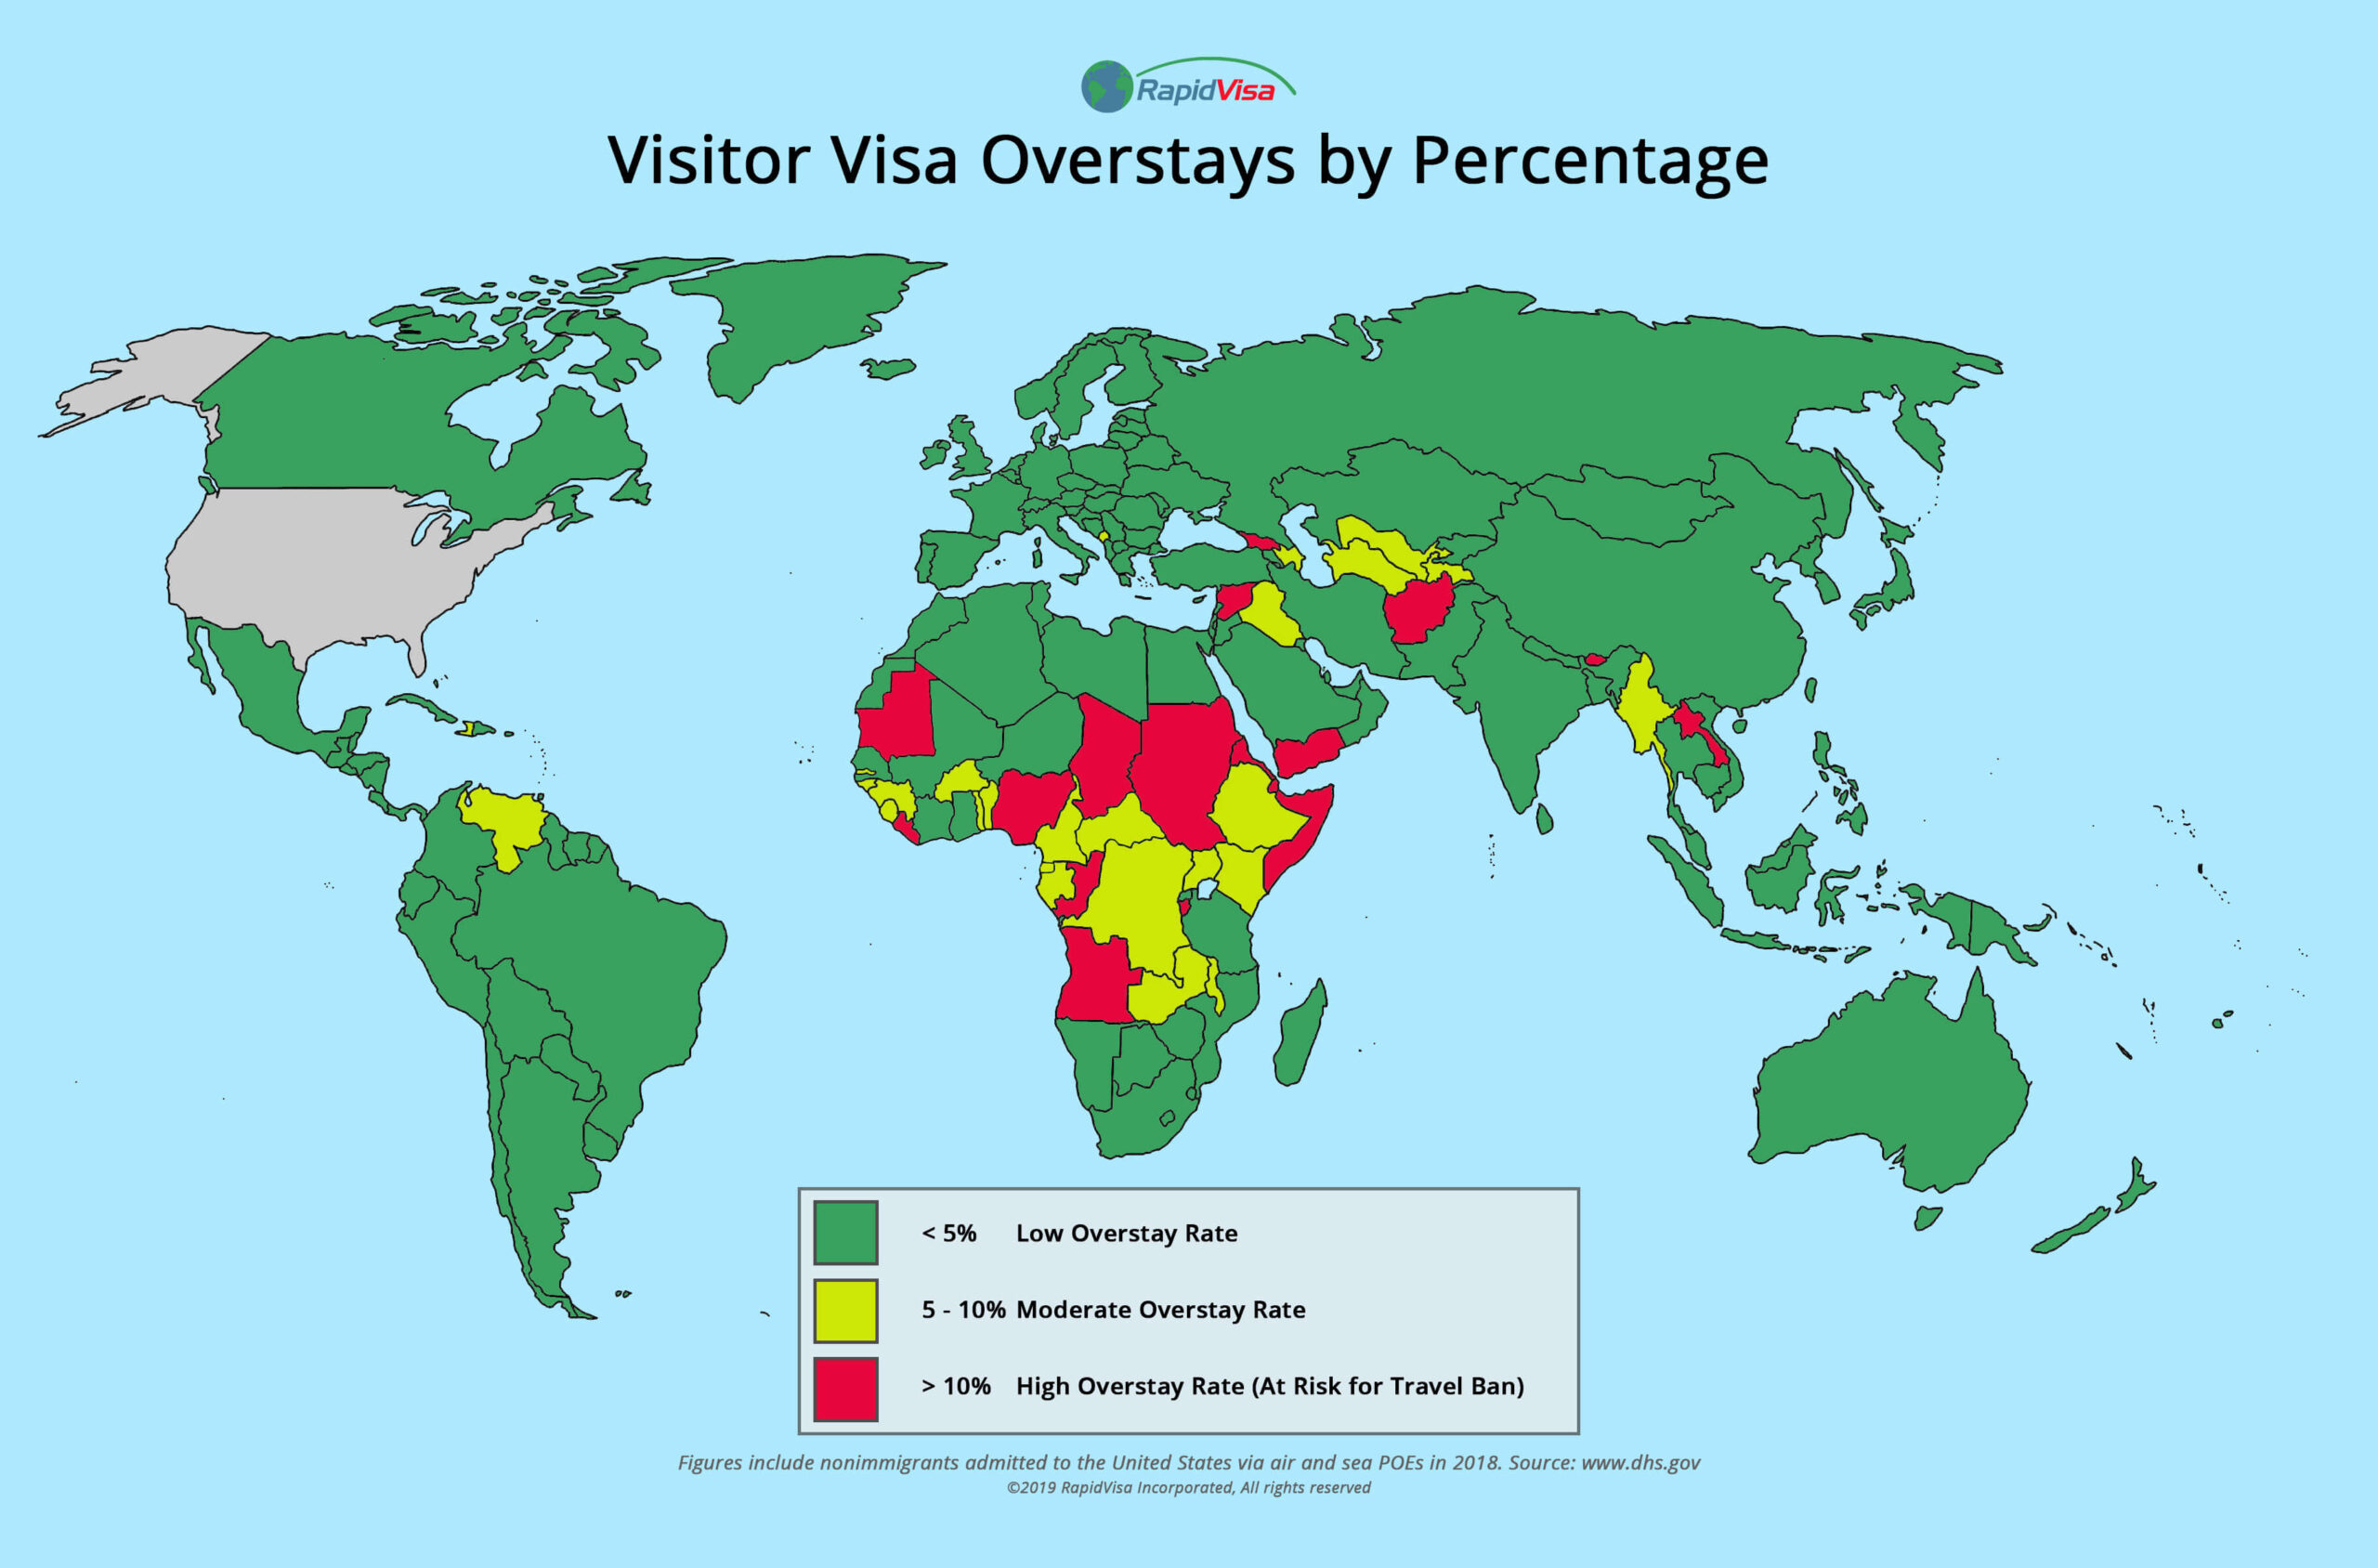
Visitor Visa Overstays in the United States by Percentage Map
The "Visitor Visa Overstays in the United States by Percentage" map provides a visual representation of the rates at whi...
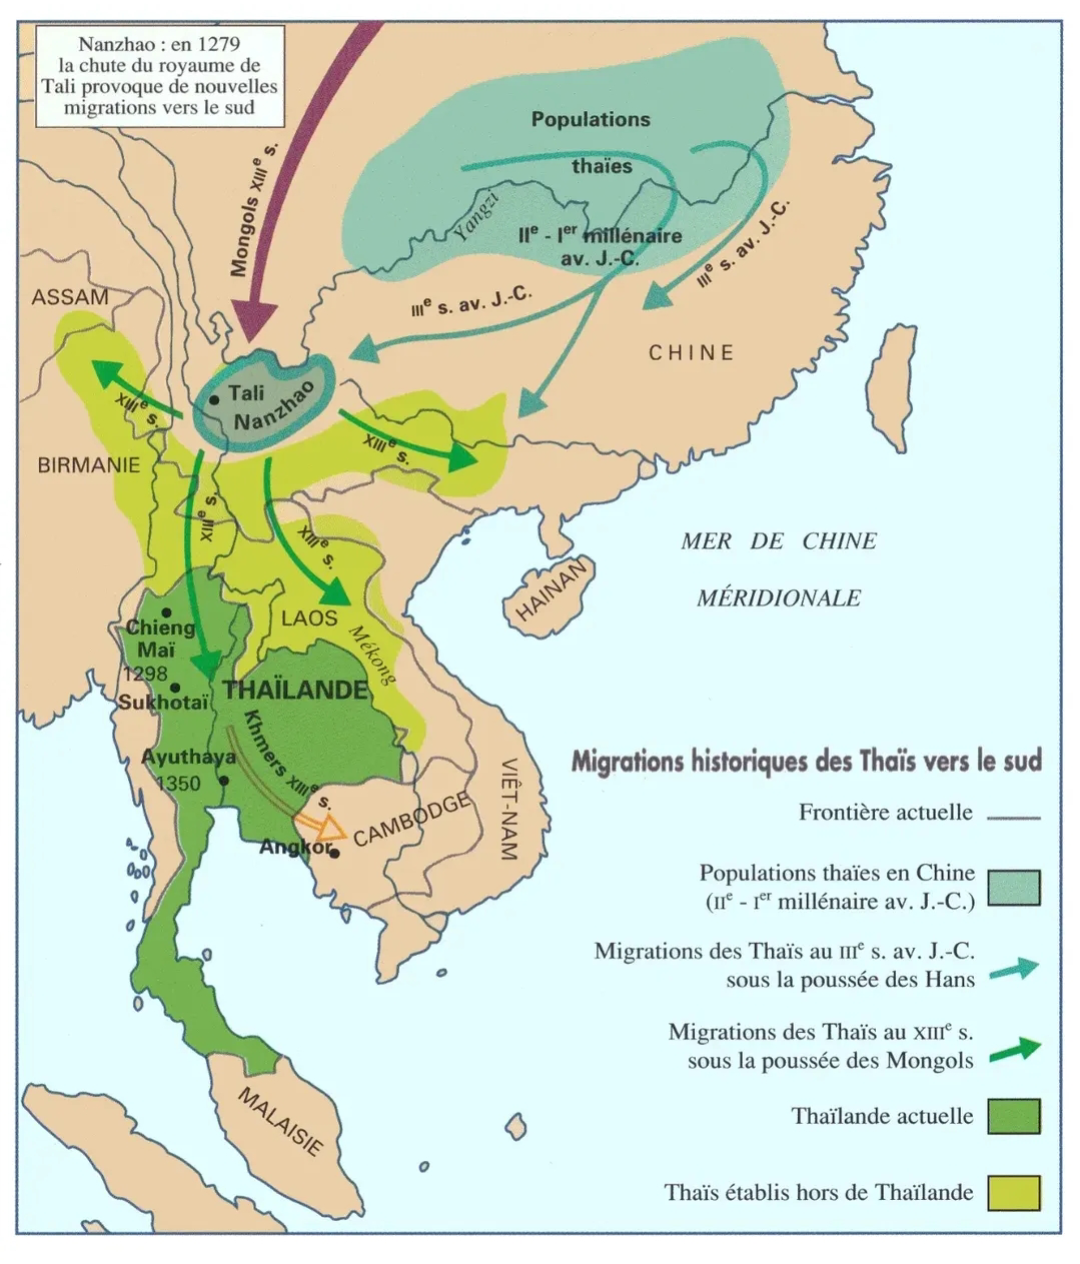
Migration of Thai People to the South Map
This map illustrates the migration patterns of the Thai people towards the southern regions of Thailand. It highlights k...
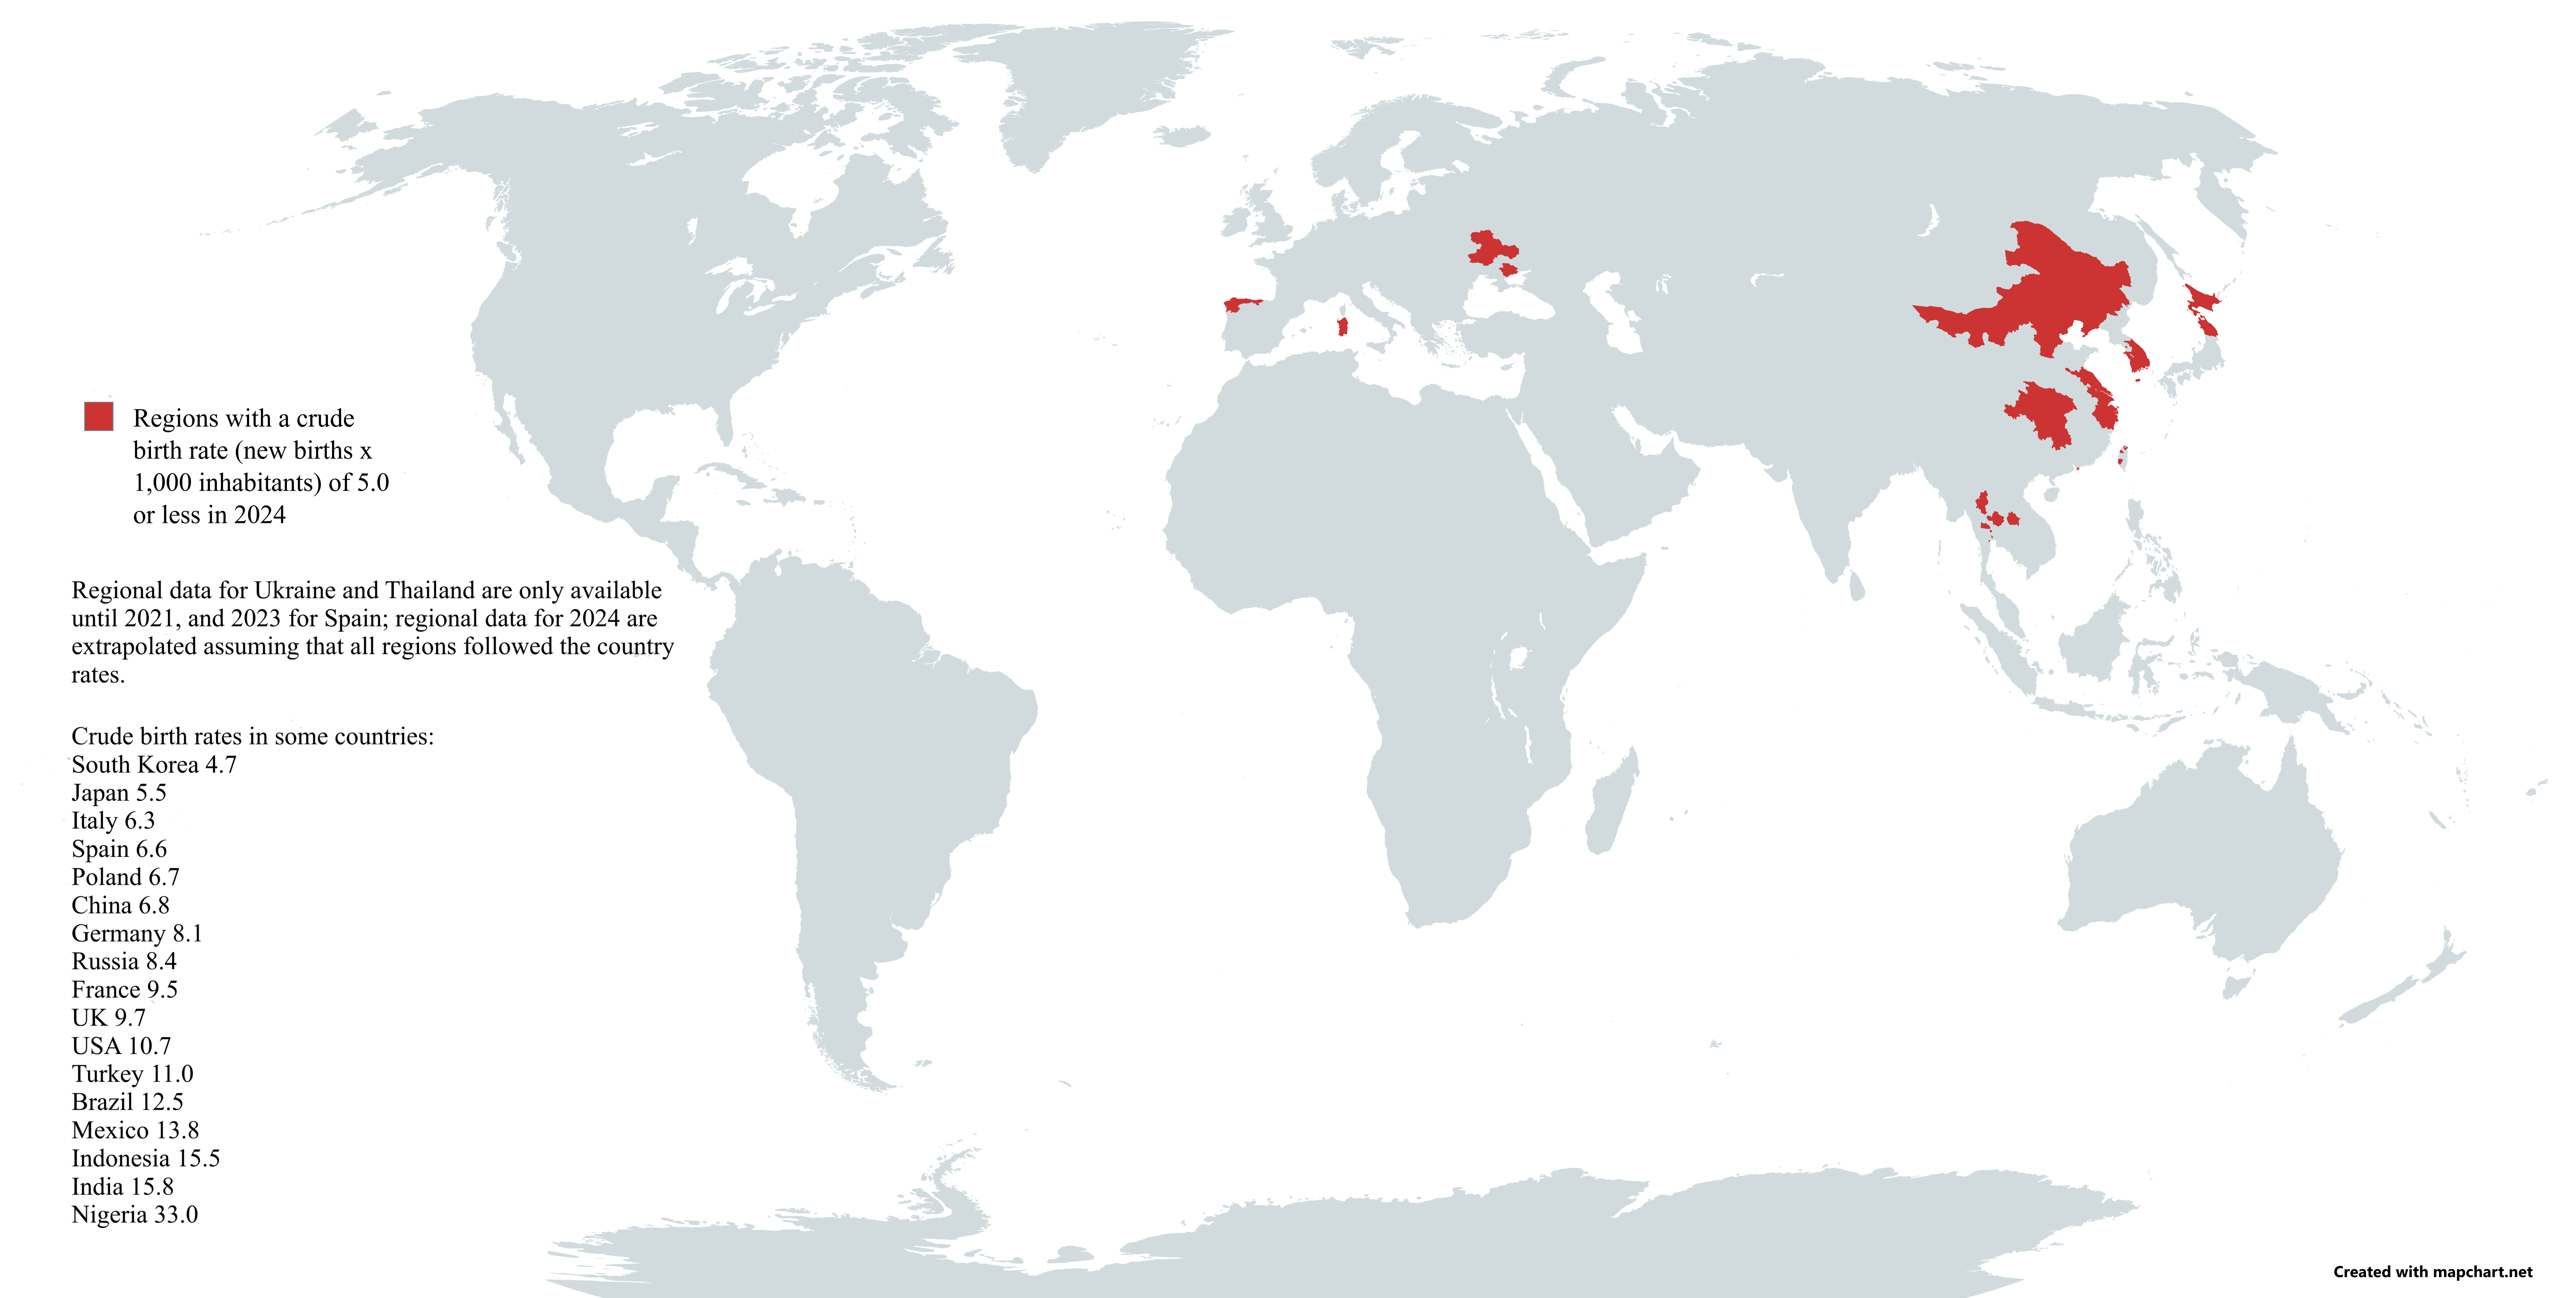
Map of Regions with Lowest Birth Rates
This map vividly illustrates the regions of the world that are grappling with the lowest birth rates. It highlights coun...
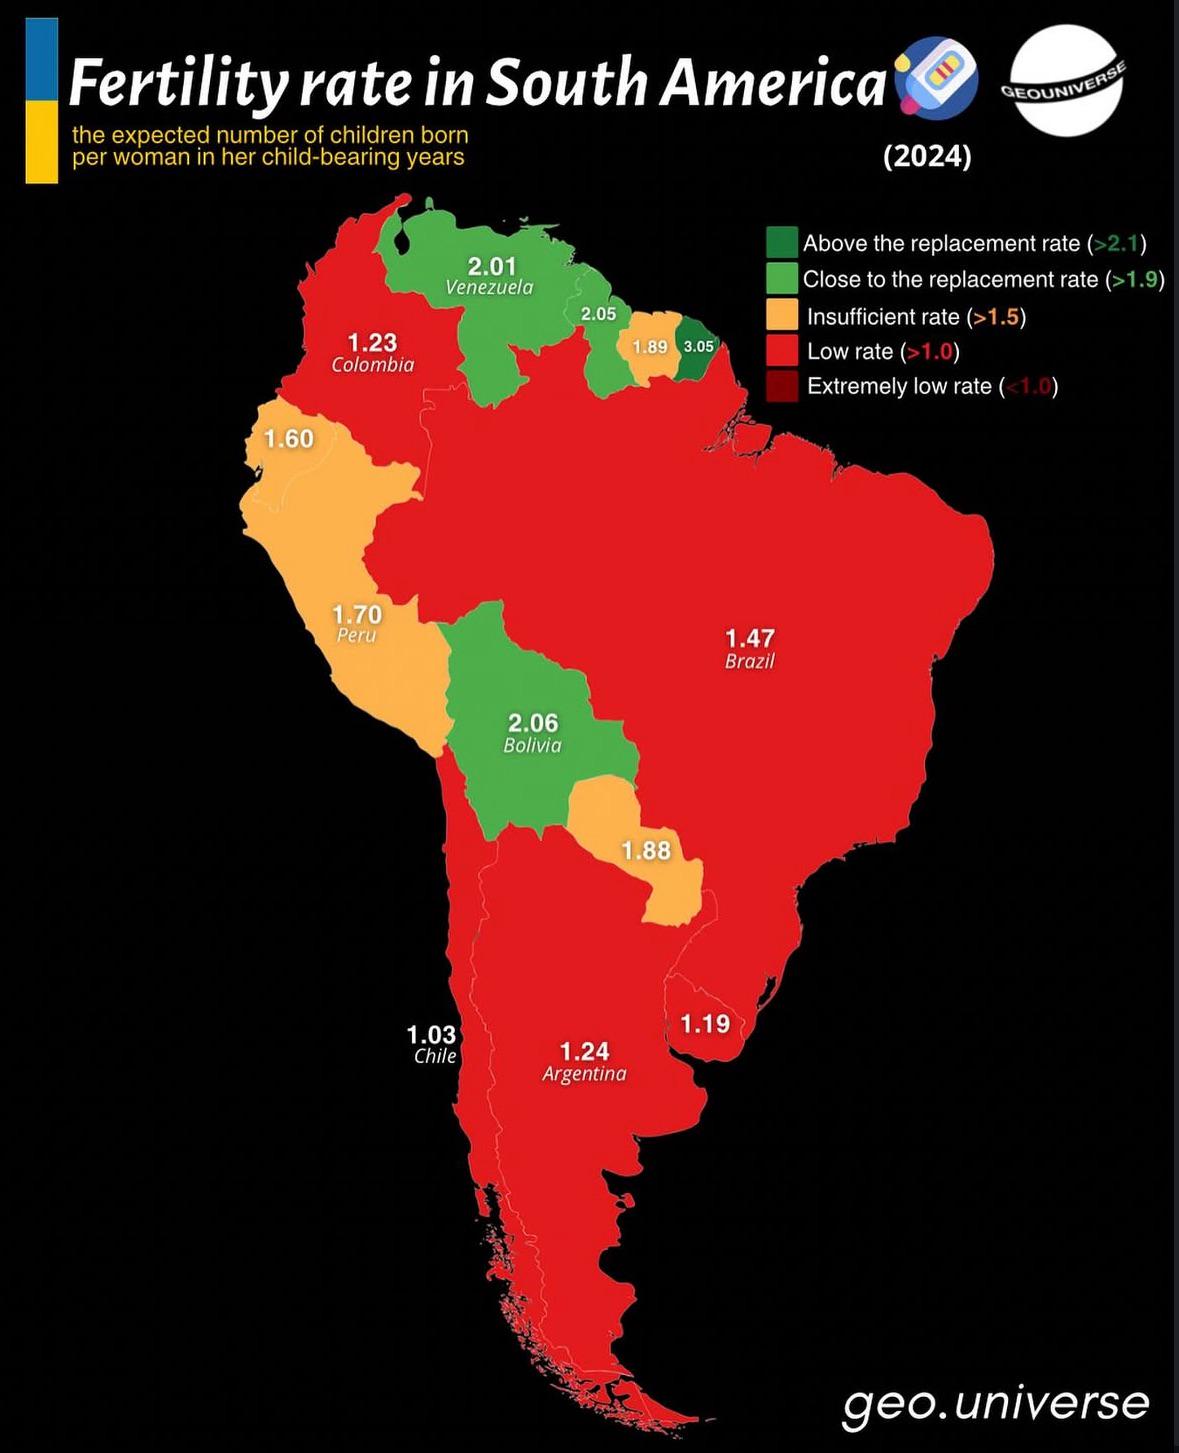
Fertility Rate Map of South America
The "Fertility Rate Map of South America" provides a visual representation of the birth rates across different countries...
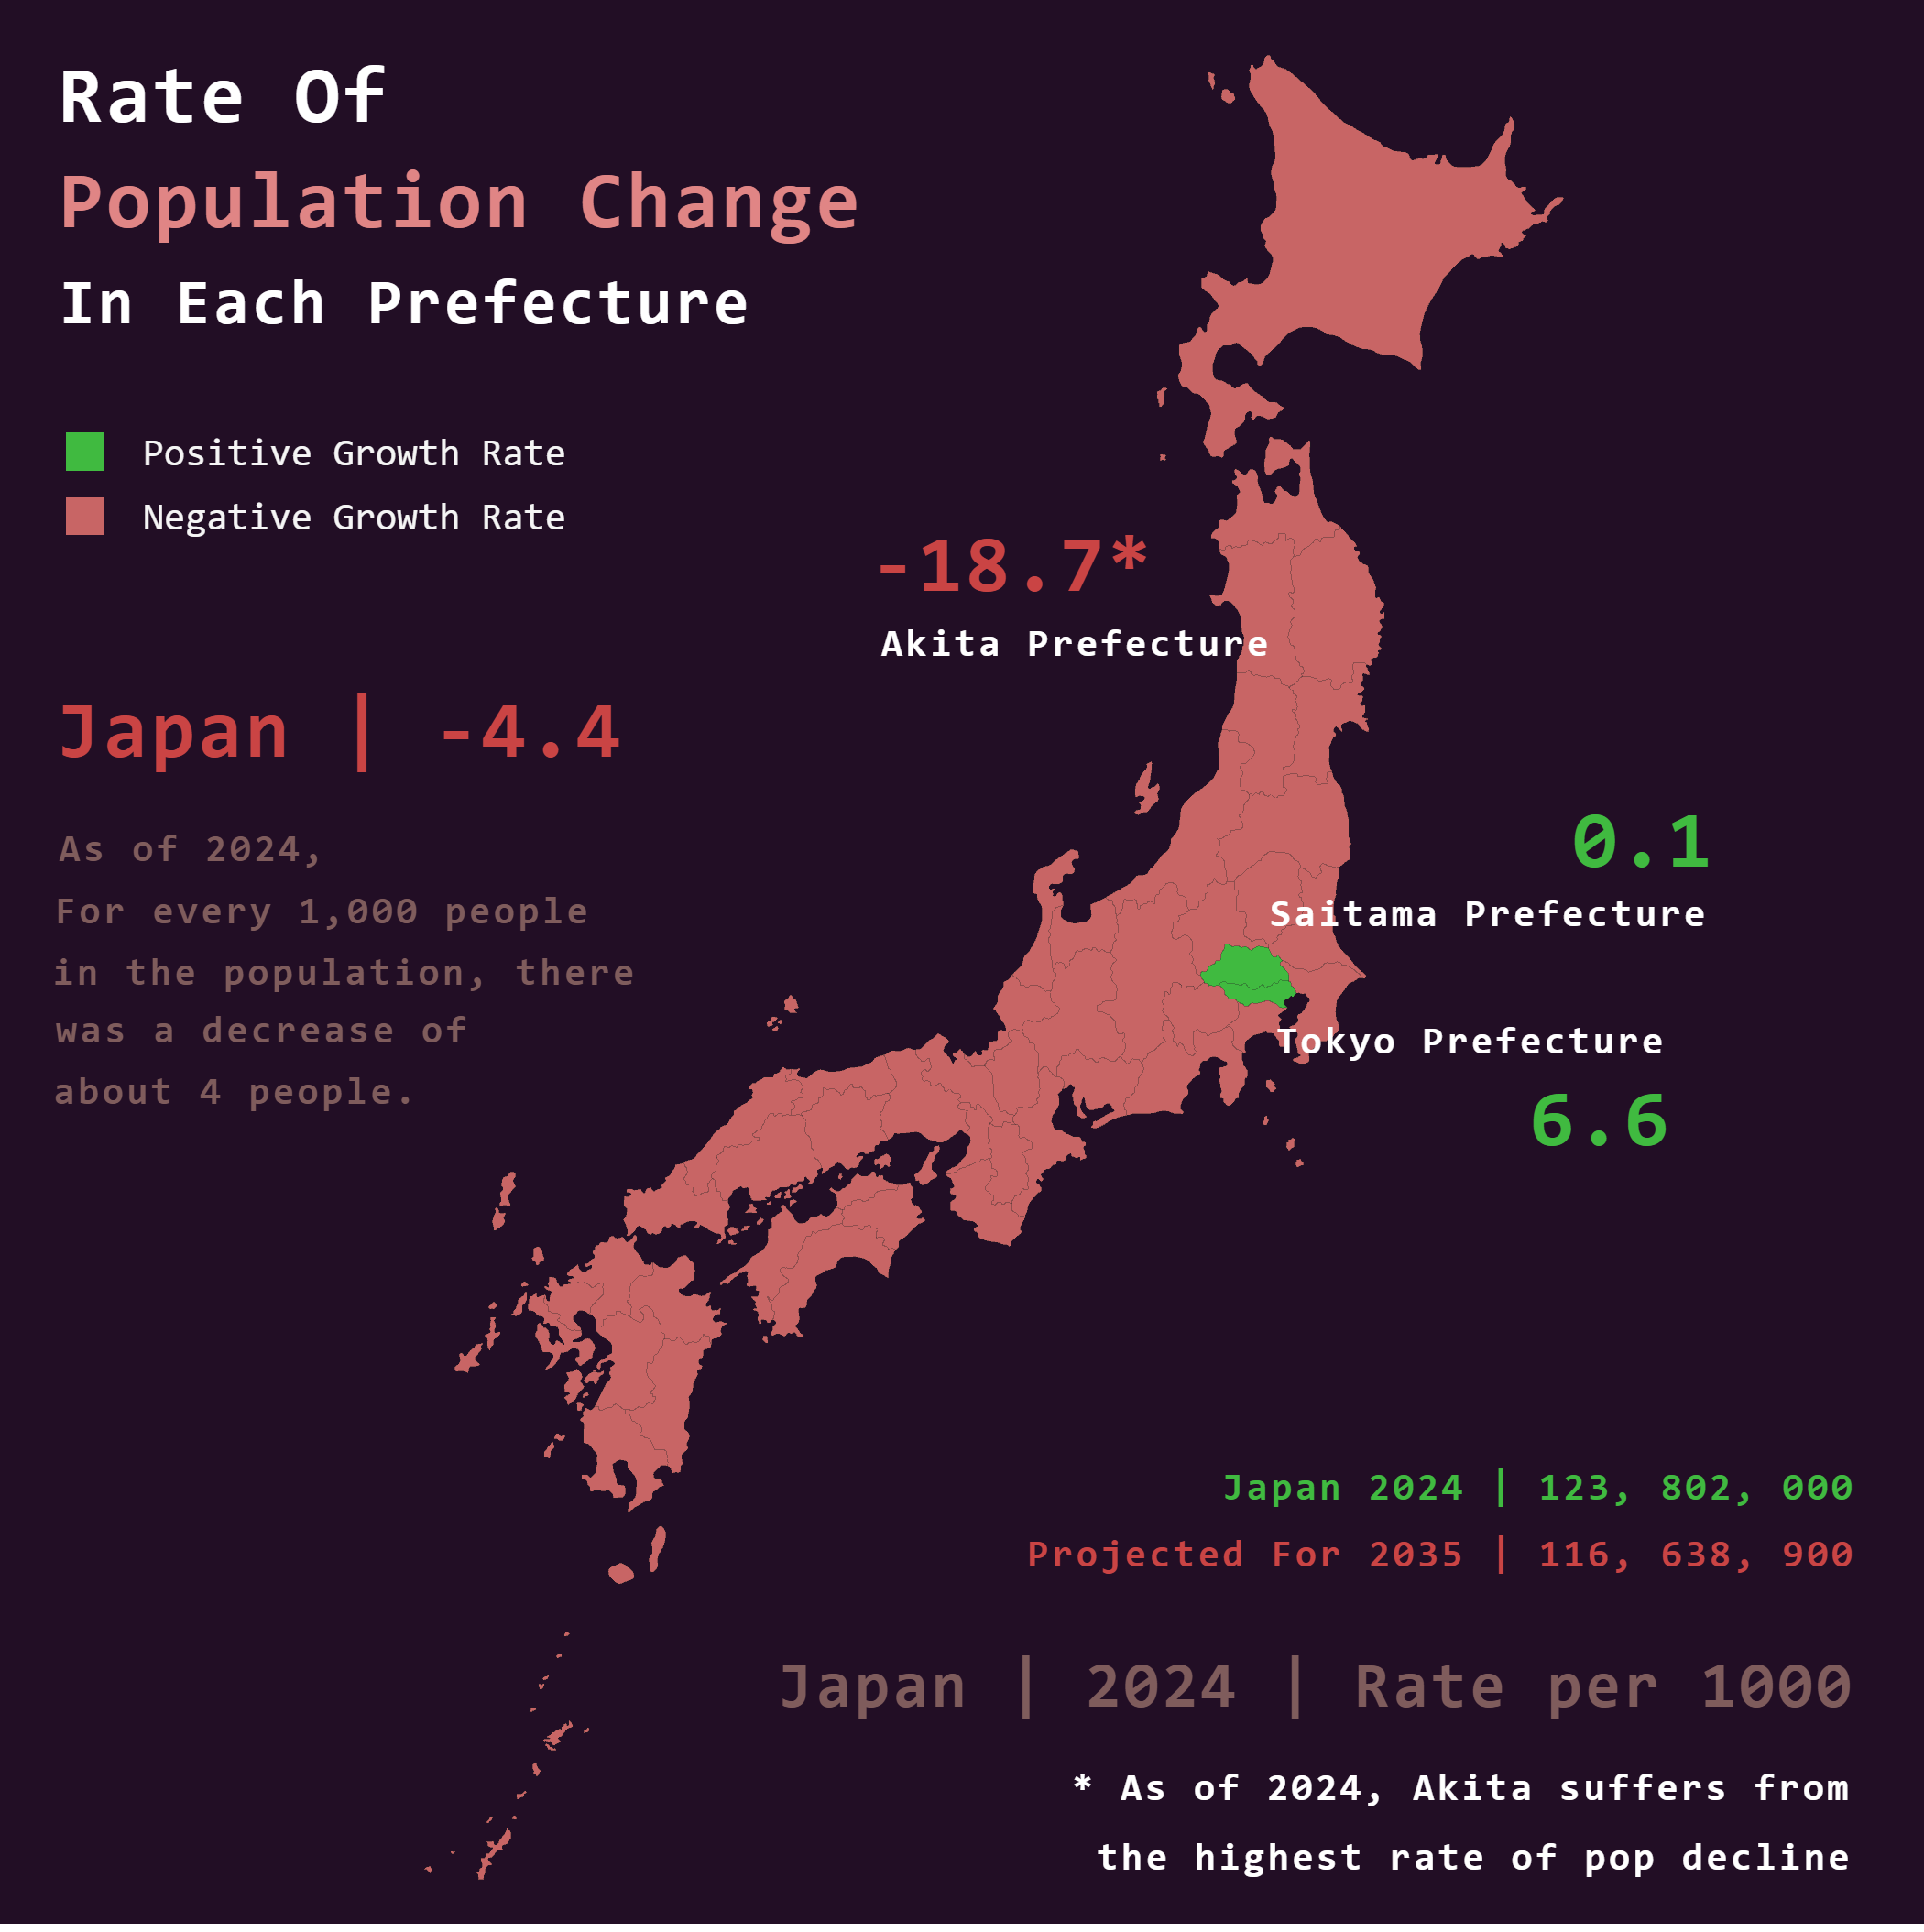
Japan Population Trend Map 2024
The visualization titled \...
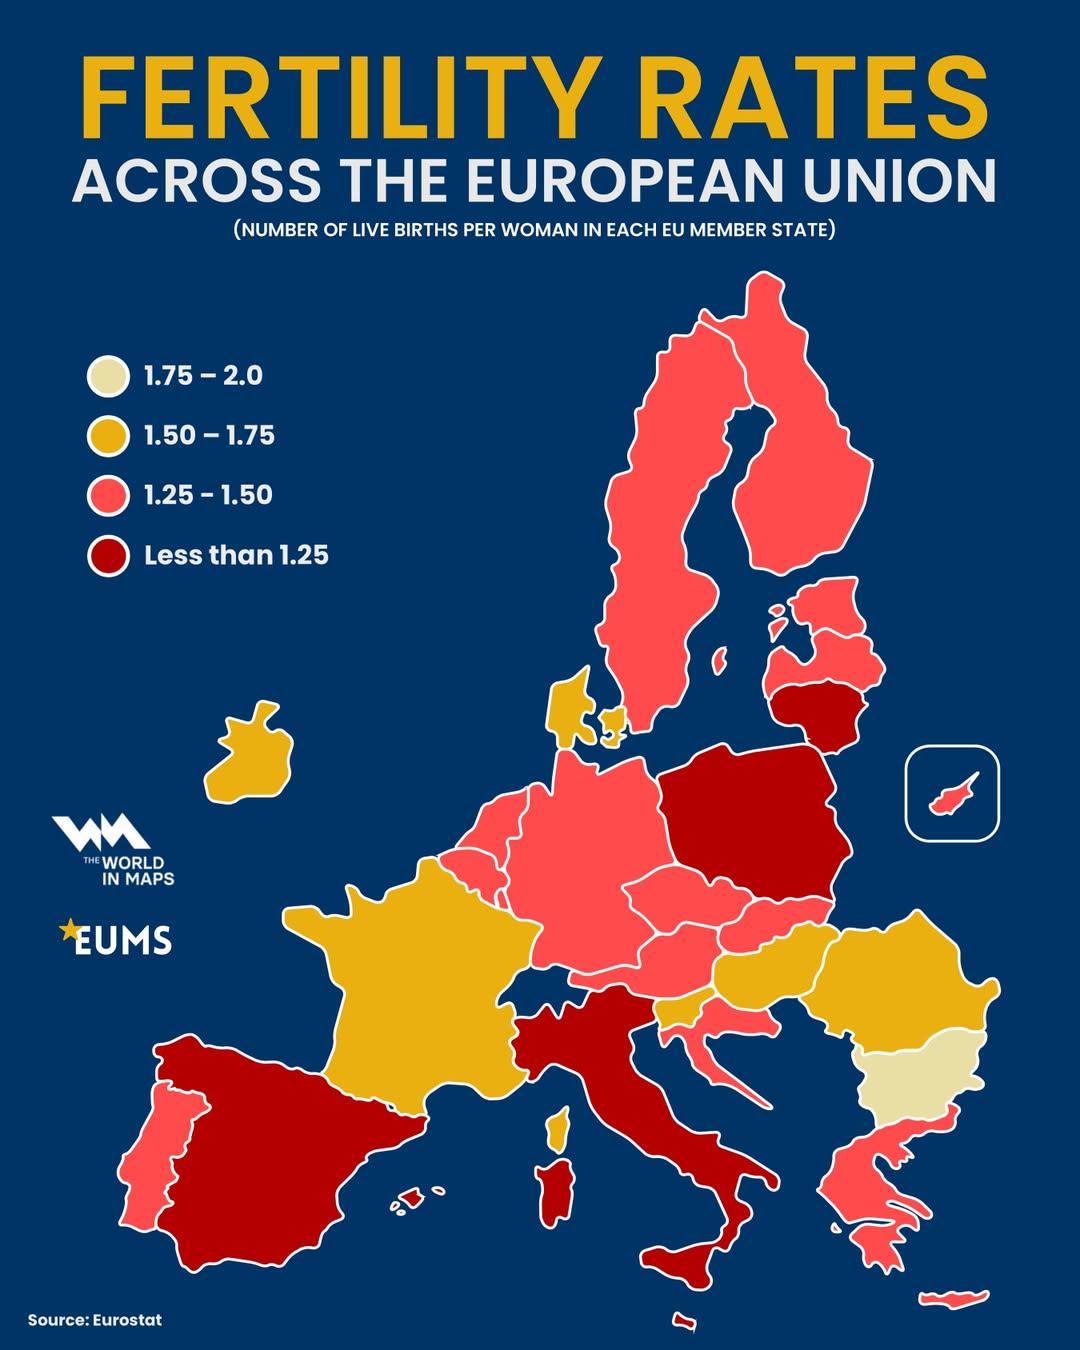
Fertility Rates Across the EU Map
The "Fertility Rates Across the EU Map" provides a comprehensive visualization of the varying fertility rates within the...
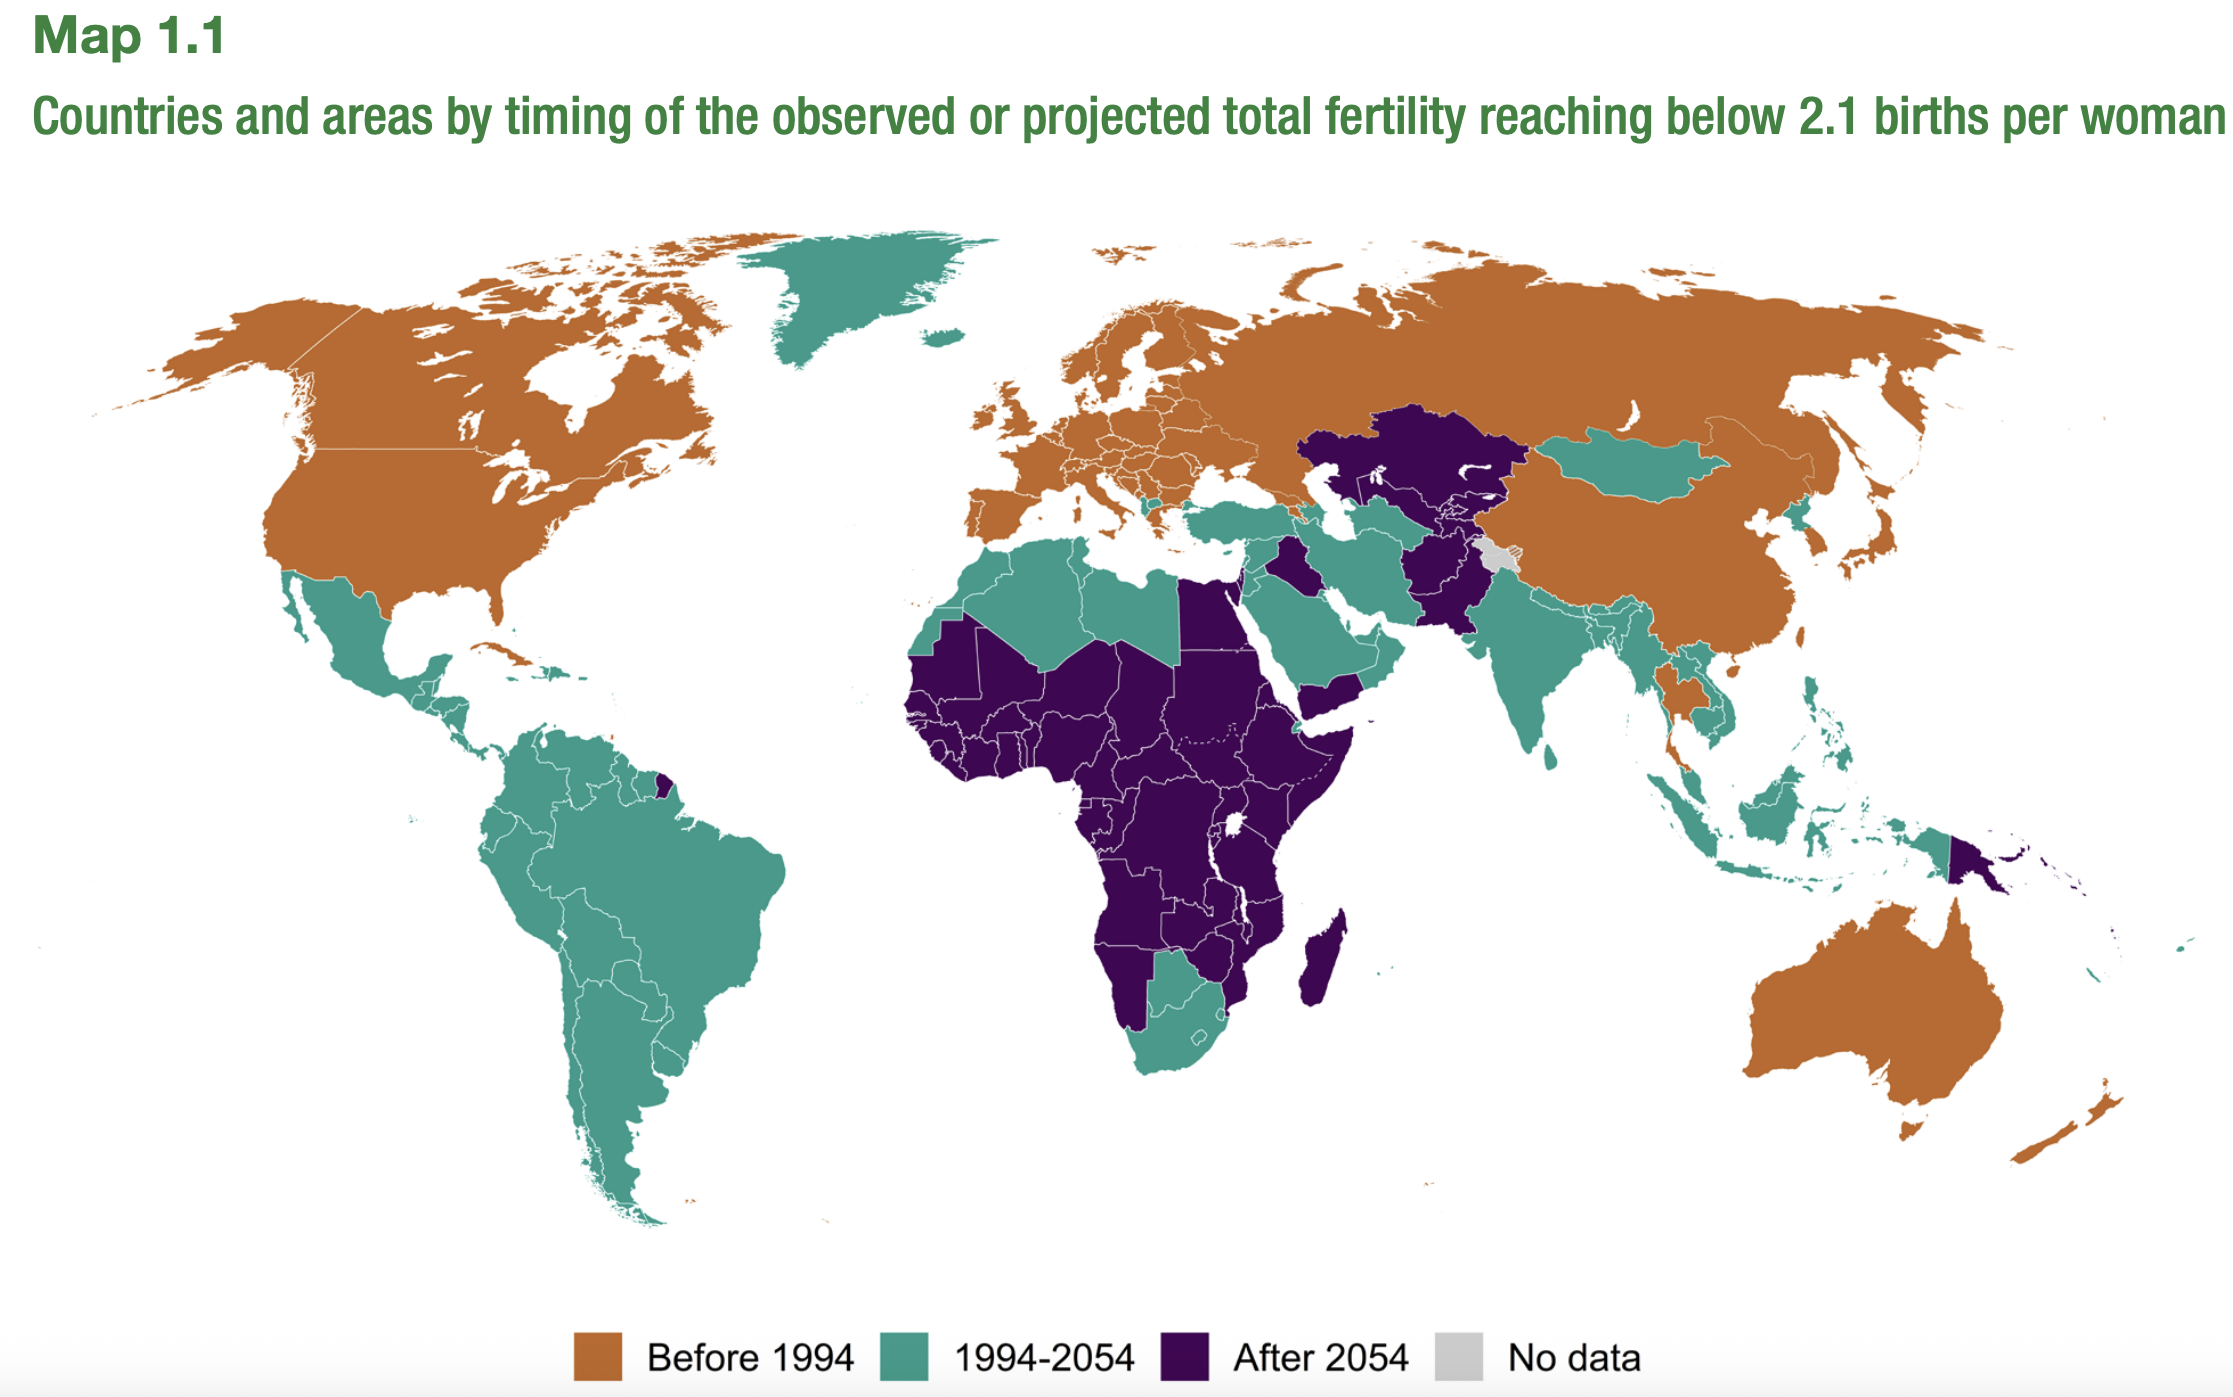
Fertility Rate Decline by Country Map
The visualization titled "Countries and areas by timing of the observed or projected total fertility reaching below the ...
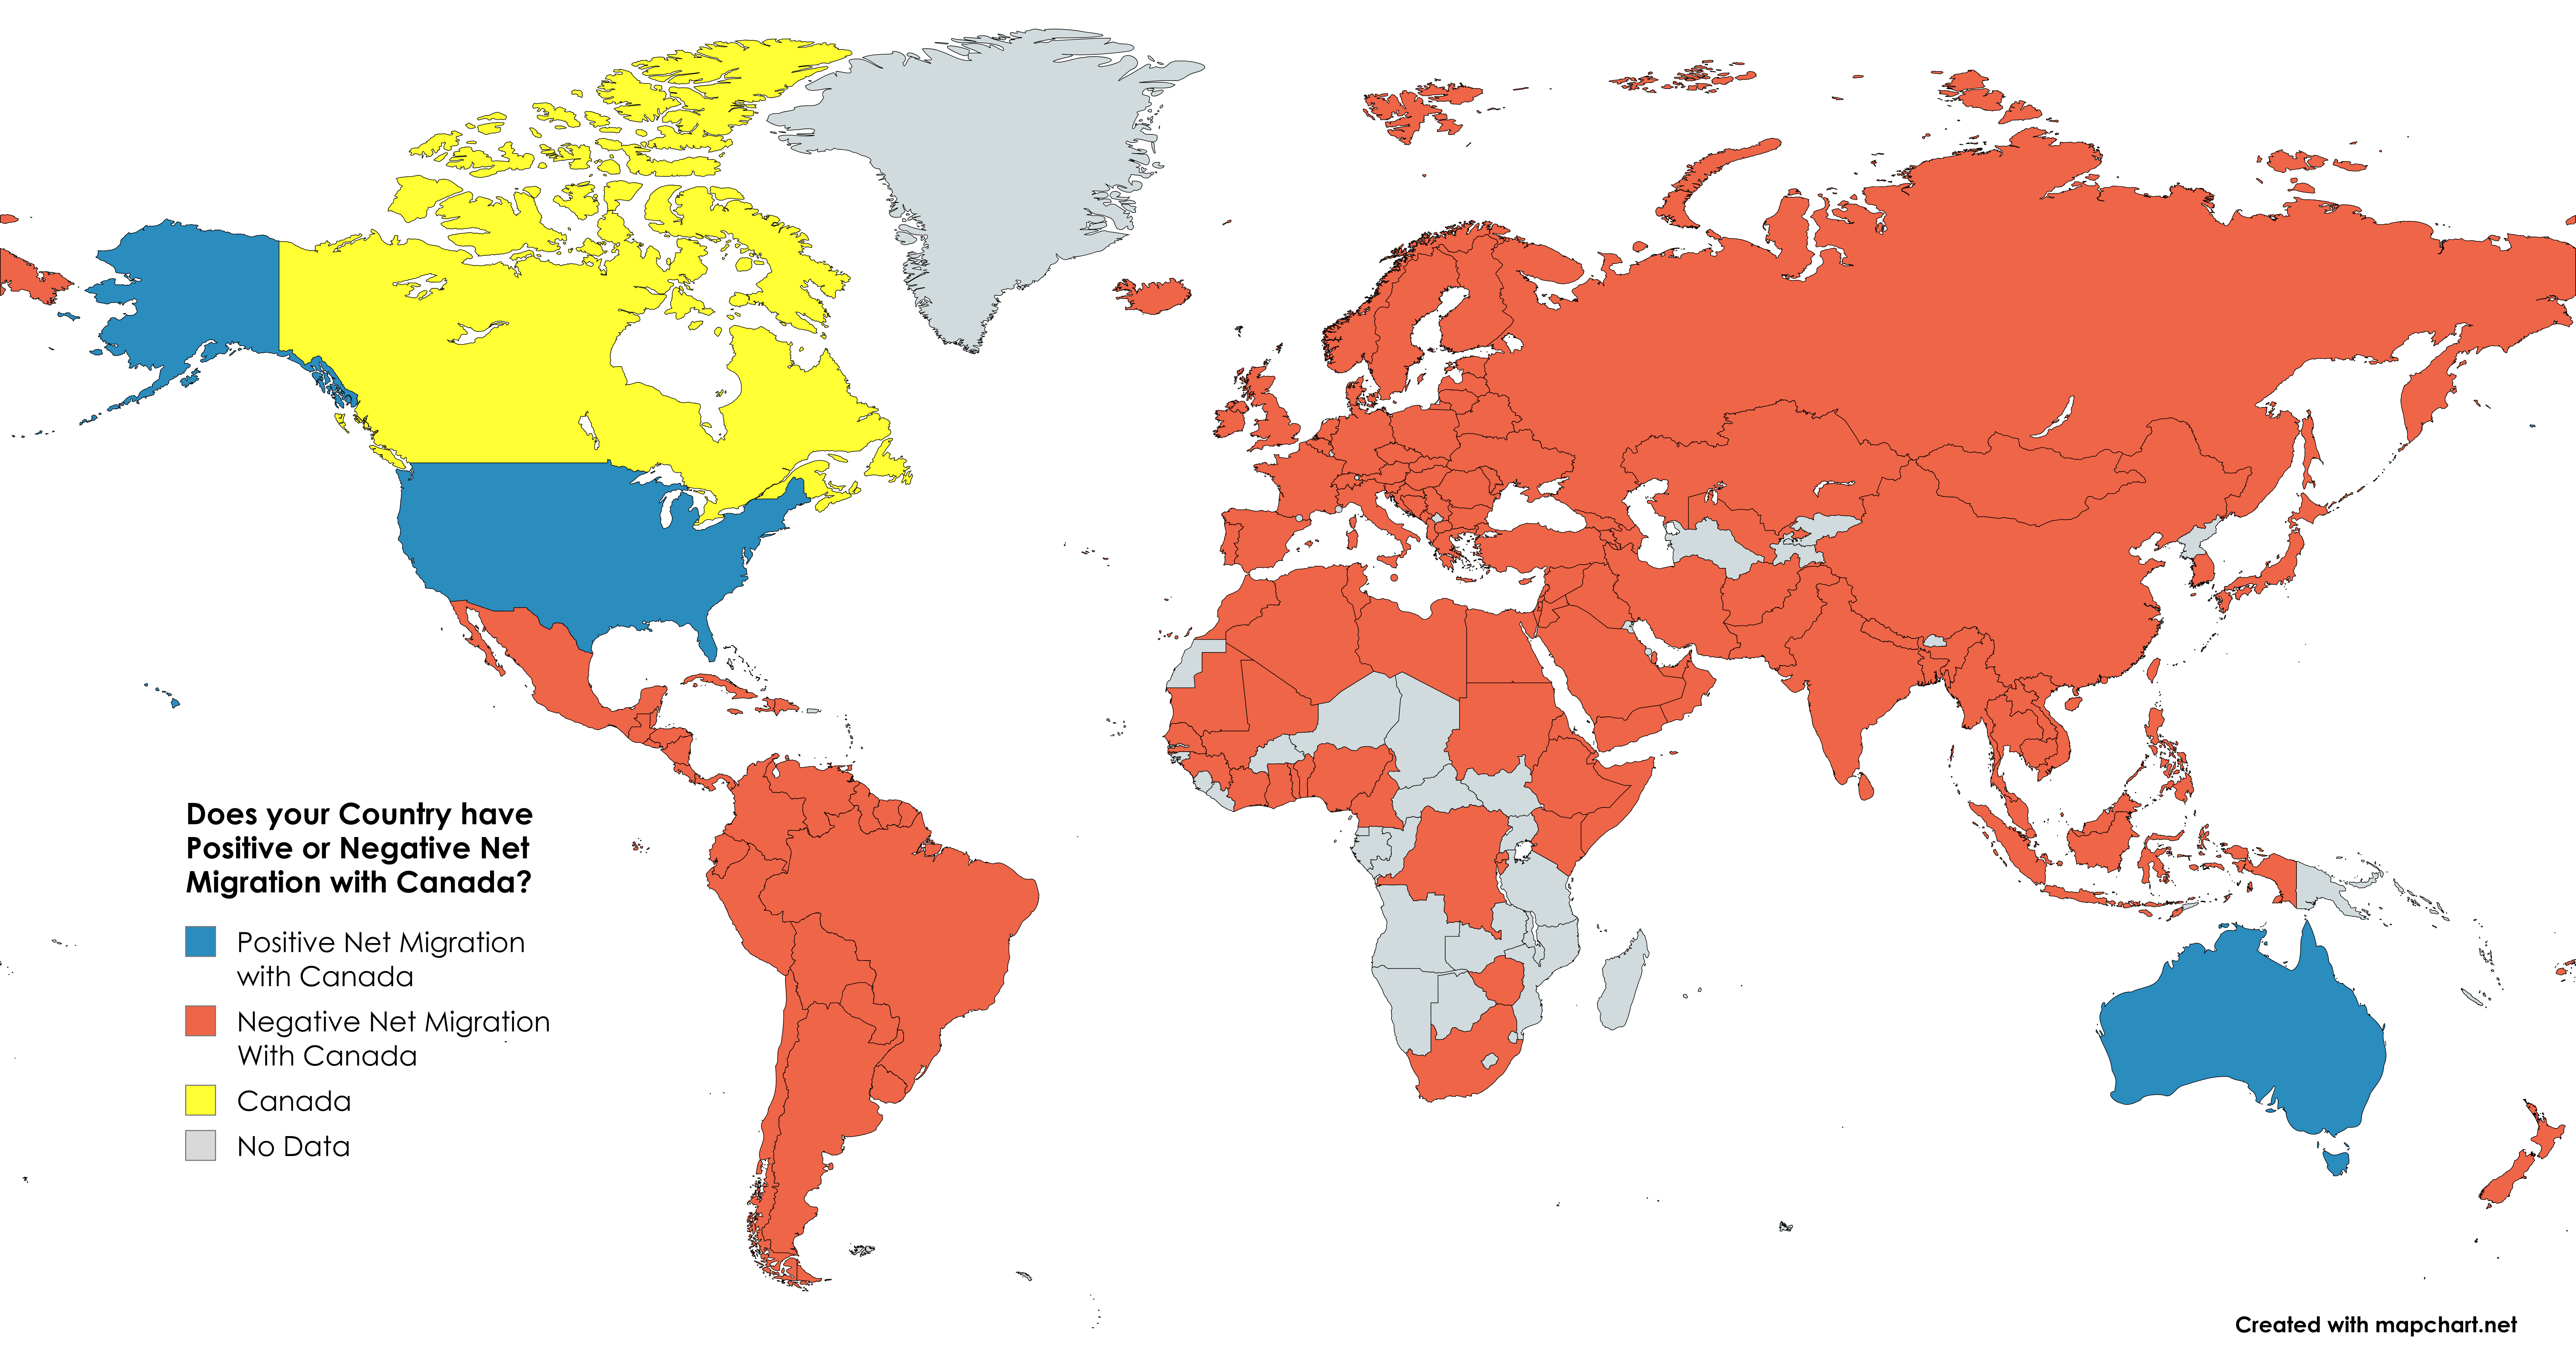
Net Migration to Canada Map 2021
The visualization titled "The United States & Australia are the Only Countries with a Positive Net Migration with Canada...
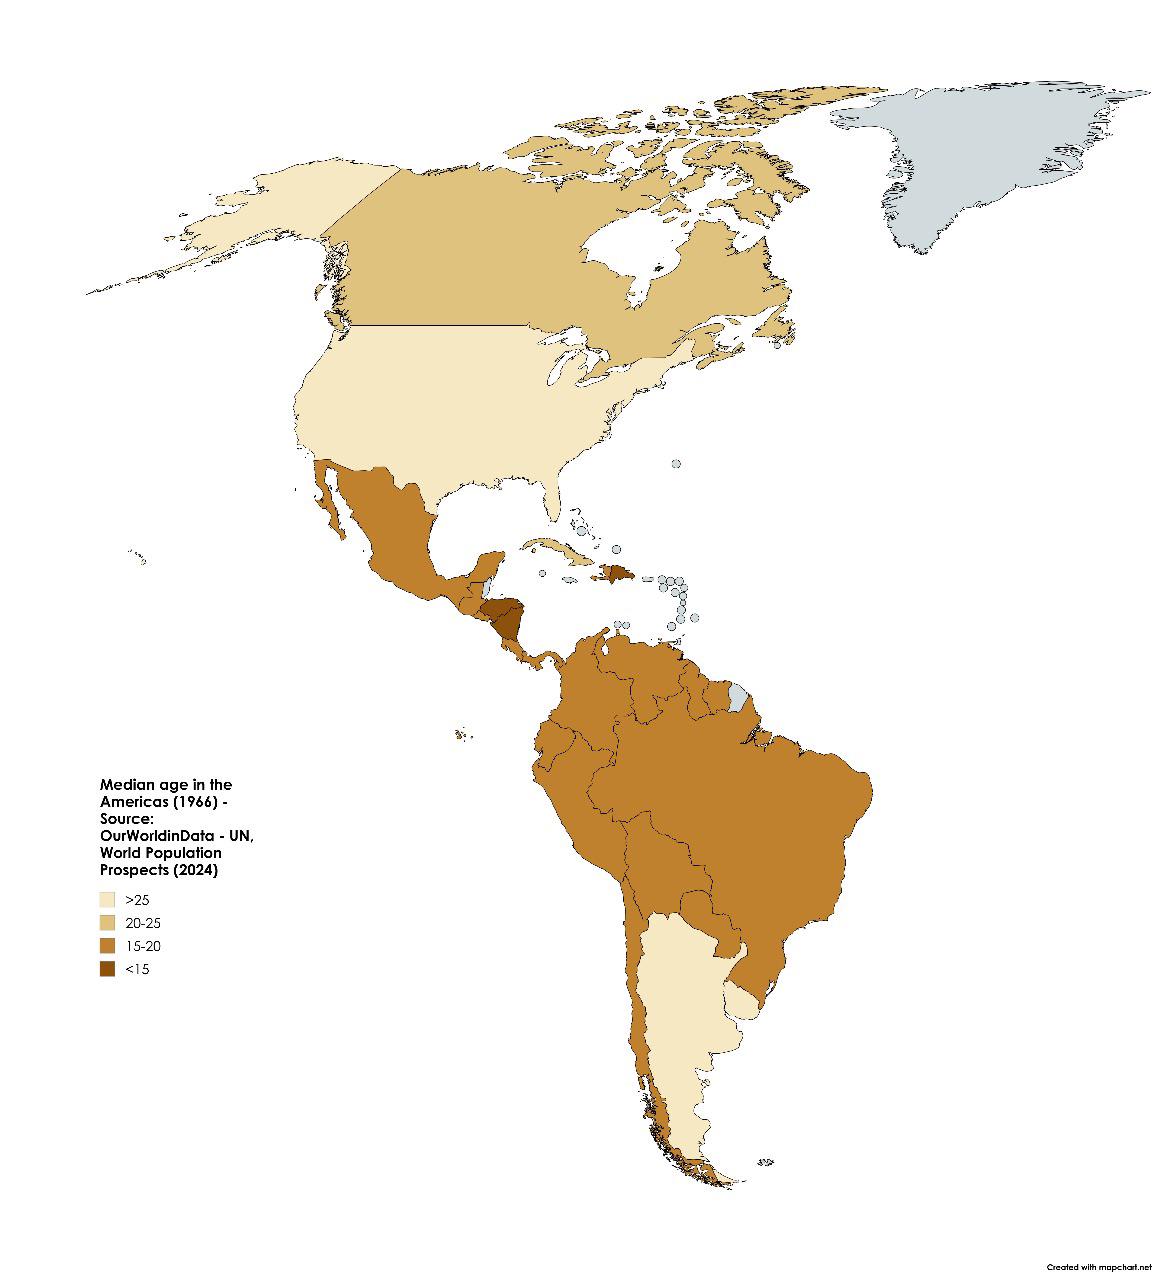
Median Age in the Americas Map 1966
The visualization of median age in the Americas in 1966 provides a striking snapshot of demographic trends across the co...