Belgium's Changing Demographics Over Time Map

David Chen
Data Visualization Specialist
David Chen is an expert in transforming complex geographic datasets into compelling visual narratives. He combines his background in computer science ...
Geographic Analysis
What This Map Shows
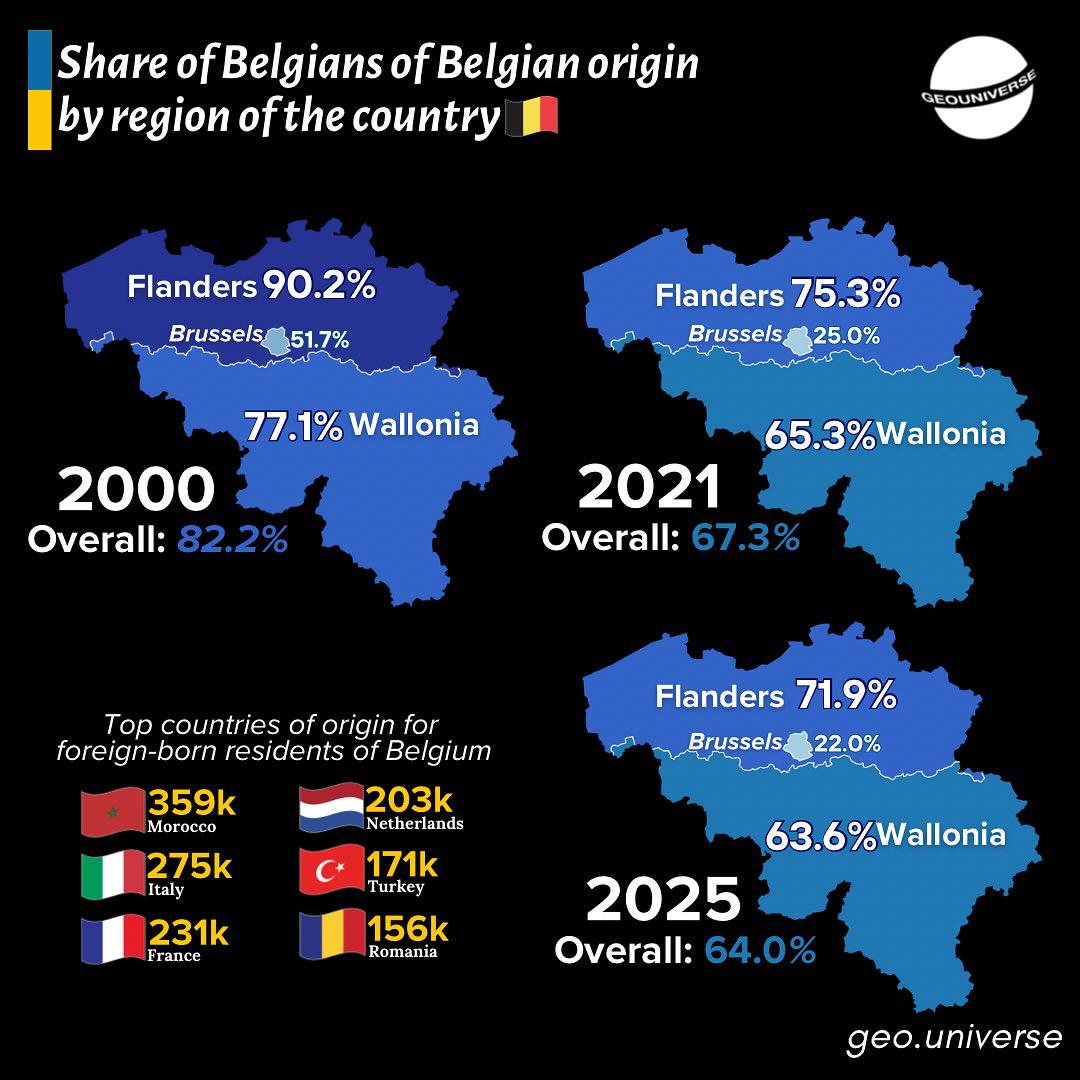
The "Belgium's Changing Demographics Over Time Map" presents a detailed visualization of the shifts in population distribution across the country over several decades. It highlights key demographic trends, including population density, urbanization, and migration patterns. By illustrating how communities have evolved, the map serves as a vital tool for understanding the broader socio-economic changes in Belgium.
Deep Dive into Belgium's Demographics
Belgium, a small yet diverse country in Western Europe, has seen significant demographic changes over the years. Its population dynamics are influenced by a combination of factors, including economic opportunities, immigration, and regional differences. As of 2023, Belgium's population is approximately 11.5 million, showcasing a steady increase from the previous decades.
One of the most striking features of Belgium's demographics is the concentration of population in urban areas. Cities like Brussels, Antwerp, and Ghent are not only cultural hubs but also economic powerhouses. For instance, Brussels, the capital, is home to around 1.2 million people, making it the largest city and a focal point for both national and international affairs. Its population density stands at about 7,500 people per square kilometer, significantly higher than the national average.
Interestingly, the map reveals a stark contrast between urban and rural areas. While cities are experiencing growth, many rural regions, particularly in Wallonia, are witnessing population decline. This shift can be attributed to factors such as job availability and the allure of city life, prompting younger populations to migrate to urban centers for better career prospects.
Another critical aspect of Belgium's demographics is its multicultural composition. The country has a long history of immigration, particularly from North Africa, Eastern Europe, and more recently, from the Middle East. This has resulted in a rich tapestry of cultures, languages, and traditions that coexist within the Belgian society. According to recent statistics, about 20% of the population consists of foreign nationals, making Belgium one of the most multicultural countries in Europe.
Furthermore, the demographic map indicates an aging population, a trend that's common across many European nations. The proportion of individuals aged 65 and older has increased significantly, raising concerns about healthcare and pension systems. As of 2023, this demographic group accounts for nearly 20% of the total population, prompting discussions on how to support an aging society while maintaining economic growth.
Regional Analysis
Looking closely at the map, we can observe notable regional differences in Belgium's demographic landscape. In Flanders, the northern region where Dutch is predominantly spoken, there’s a marked increase in population density. Cities like Antwerp and Ghent are expanding rapidly, benefitting from robust economic growth and investment. In contrast, Wallonia, the French-speaking region in the south, is facing challenges, with several municipalities showing negative population growth. Areas such as Charleroi and Liège have experienced declining industries, leading to outmigration and a shrinking workforce.
Brussels, being the capital, stands out not only for its size but also for its unique demographic makeup. Its population is increasingly diverse, with significant communities from various ethnic backgrounds. This diversity enriches the city's cultural scene but also presents challenges in terms of social cohesion and integration.
Interestingly, the map also highlights suburbanization trends around major cities. As urban living becomes more expensive, many families are opting to move to the suburbs, leading to population increases in areas surrounding Brussels and Antwerp. This suburban growth is reshaping local economies and necessitating improvements in infrastructure and services to accommodate the influx.
Significance and Impact
Understanding the changing demographics of Belgium is crucial for various reasons. Policymakers rely on this data to make informed decisions regarding infrastructure, healthcare, and education. As the population ages, there will be an increasing demand for healthcare services, which can strain existing systems unless adequately addressed.
Moreover, the ongoing trends in urbanization and migration have significant implications for social policies and urban planning. With a growing immigrant population, integration and community support are paramount to ensure social harmony and economic participation.
Looking ahead, projections indicate that Belgium’s demographics will continue to evolve. The younger generation's migration to urban centers is expected to persist, while the aging population will necessitate adaptations in public policy. How Belgium responds to these changes will undoubtedly shape its future socio-economic landscape.
The demographic dynamics illustrated in the map are not just numbers; they represent the lived experiences of individuals and communities across the country. As Belgium navigates these changes, understanding the implications is essential for fostering a cohesive and prosperous society.
Visualization Details
- Published
- October 10, 2025
- Views
- 4
Comments
Loading comments...