Average Annual Precipitation World Map

Alex Cartwright
Senior Cartographer & GIS Specialist
Alex Cartwright is a renowned cartographer and geographic information systems specialist with over 15 years of experience in spatial analysis and data...
Geographic Analysis
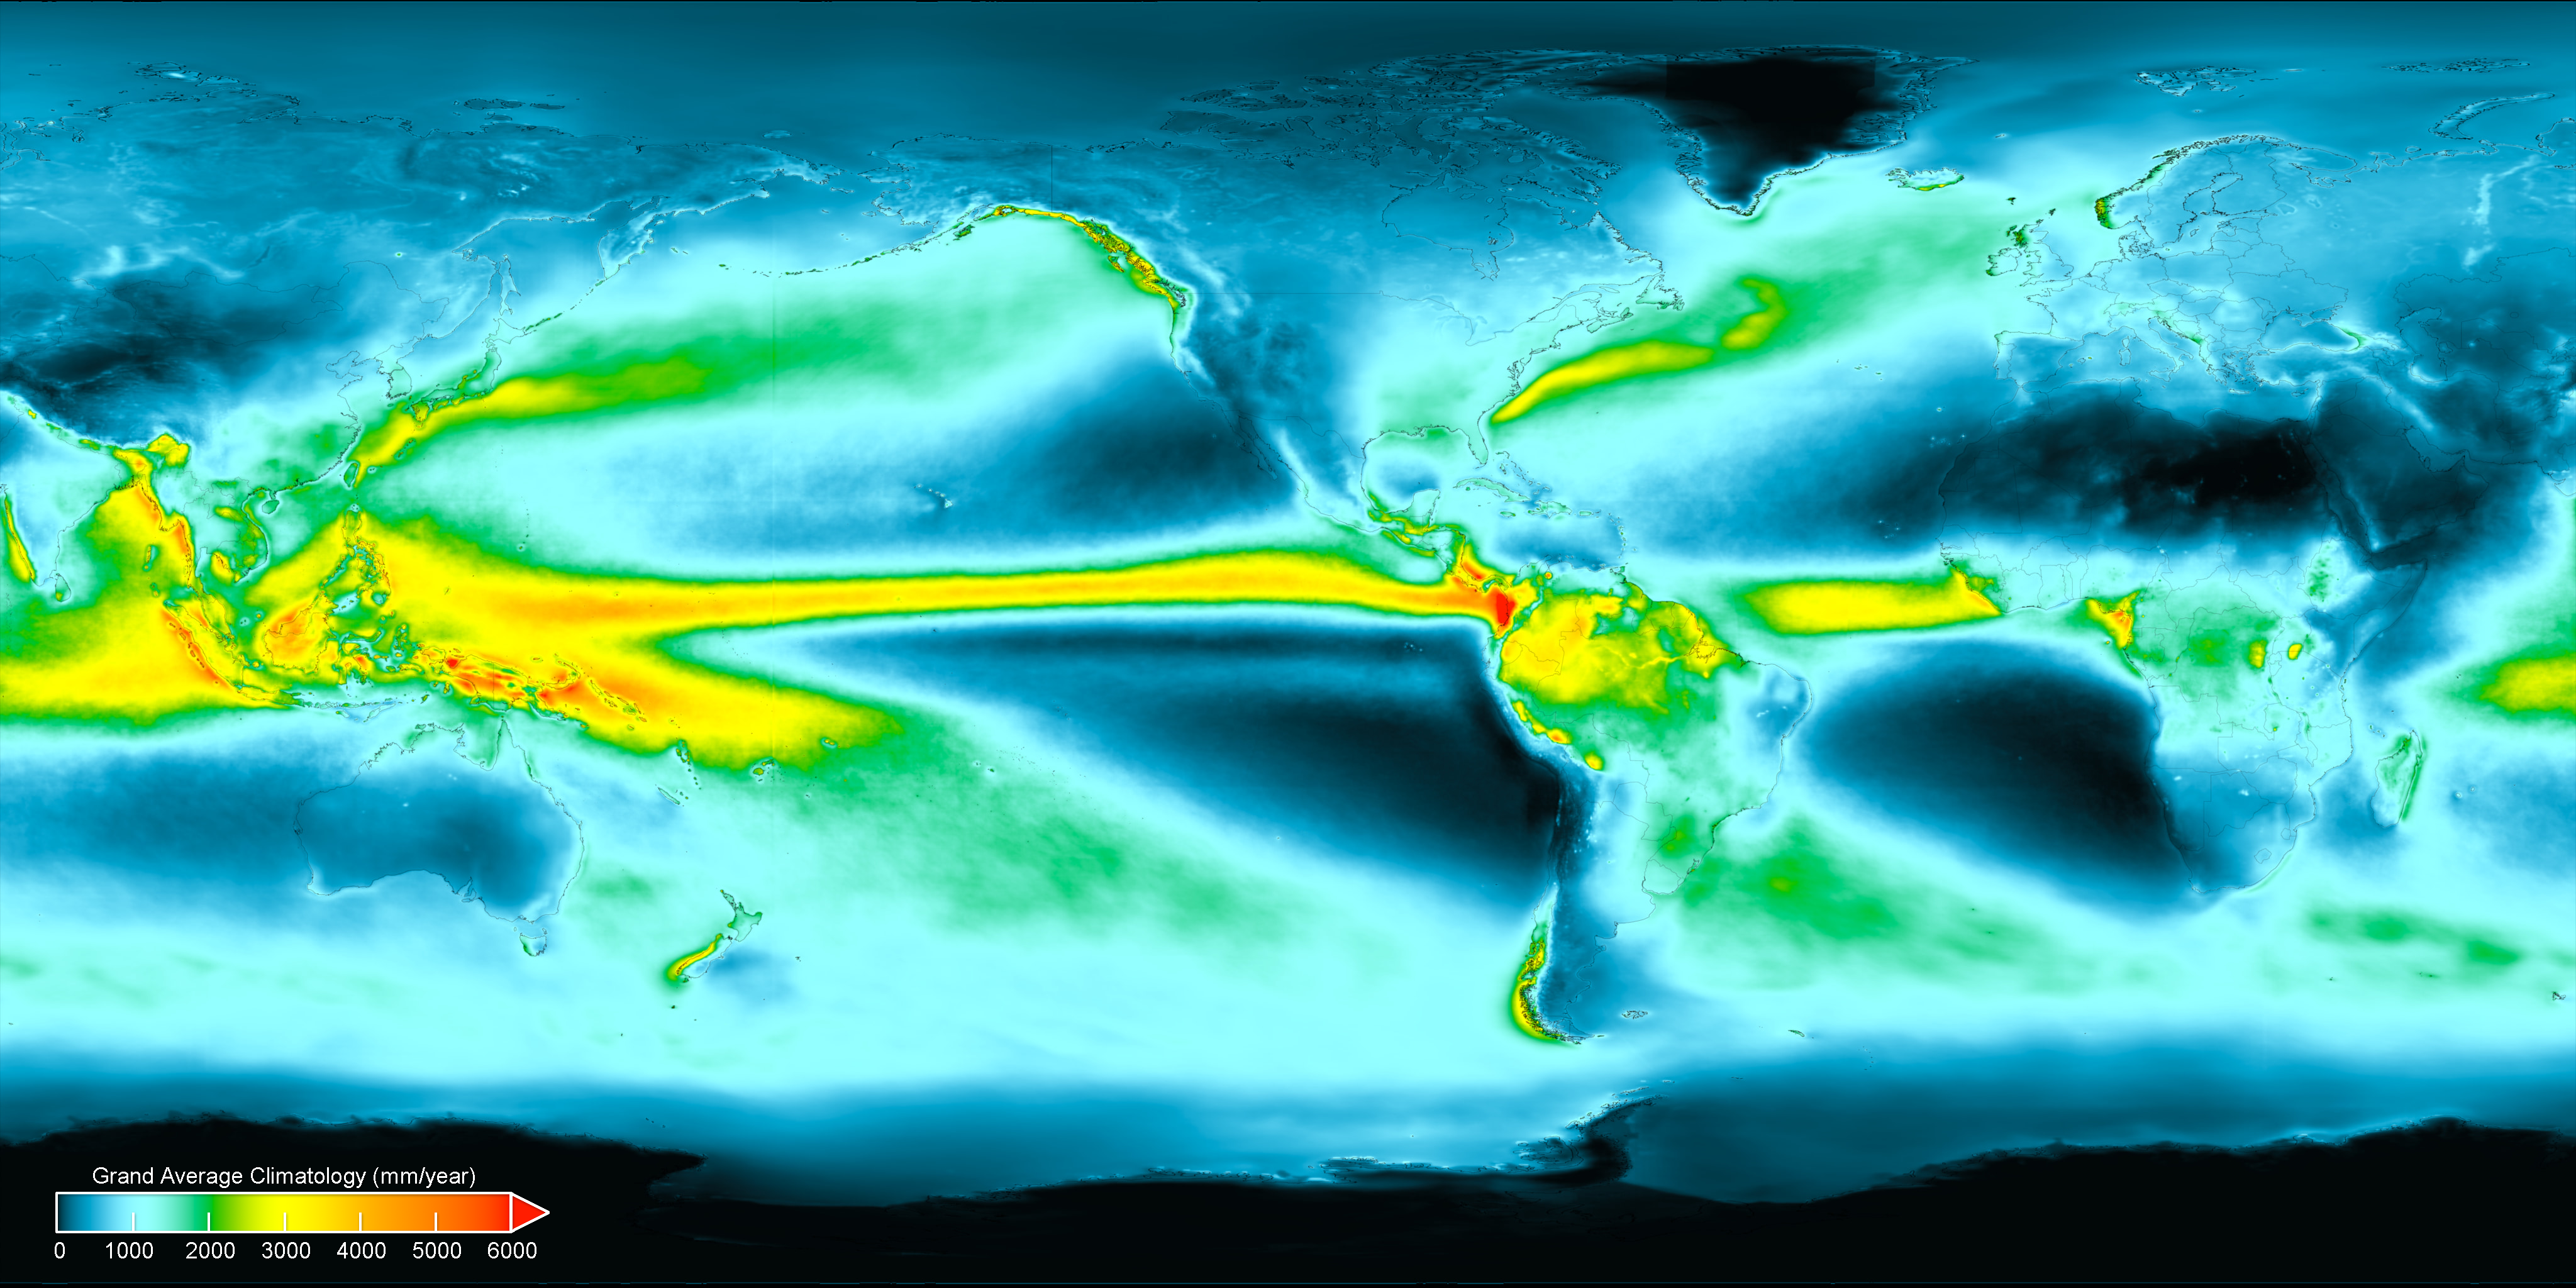
What This Map Shows\nThe Average Annual Precipitation World Map is a comprehensive visualization that illustrates the varying levels of rainfall across the globe, including both land and oceanic regions. This map helps us understand not just where the rain falls, but also the broader implications of these patterns on climate, ecosystems, and human activity. Rainfall is a crucial component of the Earth’s hydrological cycle, influencing everything from agriculture to urban planning.
Deep Dive into Global Precipitation Patterns\nPrecipitation is a key driver of climate systems and can significantly affect biodiversity and human livelihoods. On average, the Earth receives about 990 millimeters (39 inches) of precipitation per year, but this number varies dramatically from one region to another. For instance, while tropical rainforests like the Amazon Basin may receive upwards of 2,500 millimeters (98 inches) annually, arid regions such as deserts can see less than 250 millimeters (10 inches) in the same timeframe.
Interestingly, precipitation can be categorized into two main types: rain and snow. In warmer climates, rain is the primary form of precipitation, while in colder regions, snowfall is more prevalent. This distinction is essential, as it affects not only the water availability but also the types of vegetation that can thrive in a given area.
What’s fascinating is how global wind patterns and ocean currents influence these precipitation levels. The trade winds, for example, play a crucial role in distributing moisture around the Earth. Areas near the equator experience high humidity, leading to frequent rainfall, whereas locations at higher latitudes may have drier air, which results in less precipitation.
Moreover, precipitation is not evenly distributed throughout the year; many regions experience seasonal rainfall. Monsoons in South Asia are a prime example, where a significant portion of the annual rainfall occurs within a few months, impacting agriculture and water resources for the entire year. Understanding these patterns is vital for planning in sectors such as agriculture, water management, and urban development.
Regional Analysis\nExamining the Average Annual Precipitation World Map reveals stark contrasts between different geographical regions. For instance, the map highlights the following:\n- **Tropical Regions**: Areas like the Congo Basin and Southeast Asia receive abundant rainfall, often exceeding 2,000 millimeters (79 inches) annually. This high moisture level supports vast biodiversity, including dense rainforests.\n- **Temperate Zones**: Regions such as parts of Europe and the eastern United States typically receive moderate rainfall, averaging between 750 to 1,500 millimeters (30 to 59 inches). This variability supports diverse ecosystems, from deciduous forests to agricultural lands.\n- **Arid and Semi-Arid Regions**: The Sahara Desert and the Middle East show minimal precipitation, often below 250 millimeters (10 inches) annually. Interestingly, these areas have adapted to the lack of water through unique flora and fauna, showcasing nature’s resilience.\n- **Polar Regions**: Antarctica and parts of Greenland experience very low precipitation, primarily as snow, leading to unique ice-covered environments. The average precipitation in these regions can be less than 200 millimeters (8 inches), making them some of the driest places on Earth.
Significance and Impact\nUnderstanding annual precipitation patterns is crucial for several reasons. Firstly, it directly impacts agriculture—regions with reliable rainfall can support varied crops and livestock, while those with erratic precipitation patterns face challenges in food security. For example, the Sahel region in Africa experiences variability in rainfall, which has led to severe droughts and famine in the past decades.
Moreover, as climate change continues to alter weather patterns, monitoring precipitation becomes increasingly important. Changes in rainfall intensity and distribution are already being observed, with some areas experiencing heavier downpours while others suffer prolonged droughts. These shifts can lead to devastating consequences, including flooding, soil erosion, and water scarcity.
In conclusion, the Average Annual Precipitation World Map serves not just as a depiction of rainfall but as a vital tool for understanding our planet’s climate system. By recognizing the intricacies of precipitation patterns, we can better prepare for the challenges of the future, ensuring sustainable development and environmental conservation.\n
Visualization Details
- Published
- September 5, 2025
- Views
- 112
Comments
Loading comments...