
Marcus Rodriguez
Historical Geography Expert
Marcus Rodriguez specializes in historical cartography and geographic data analysis. With a background in both history and geography, he brings unique...
Geographic Analysis
What This Map Shows
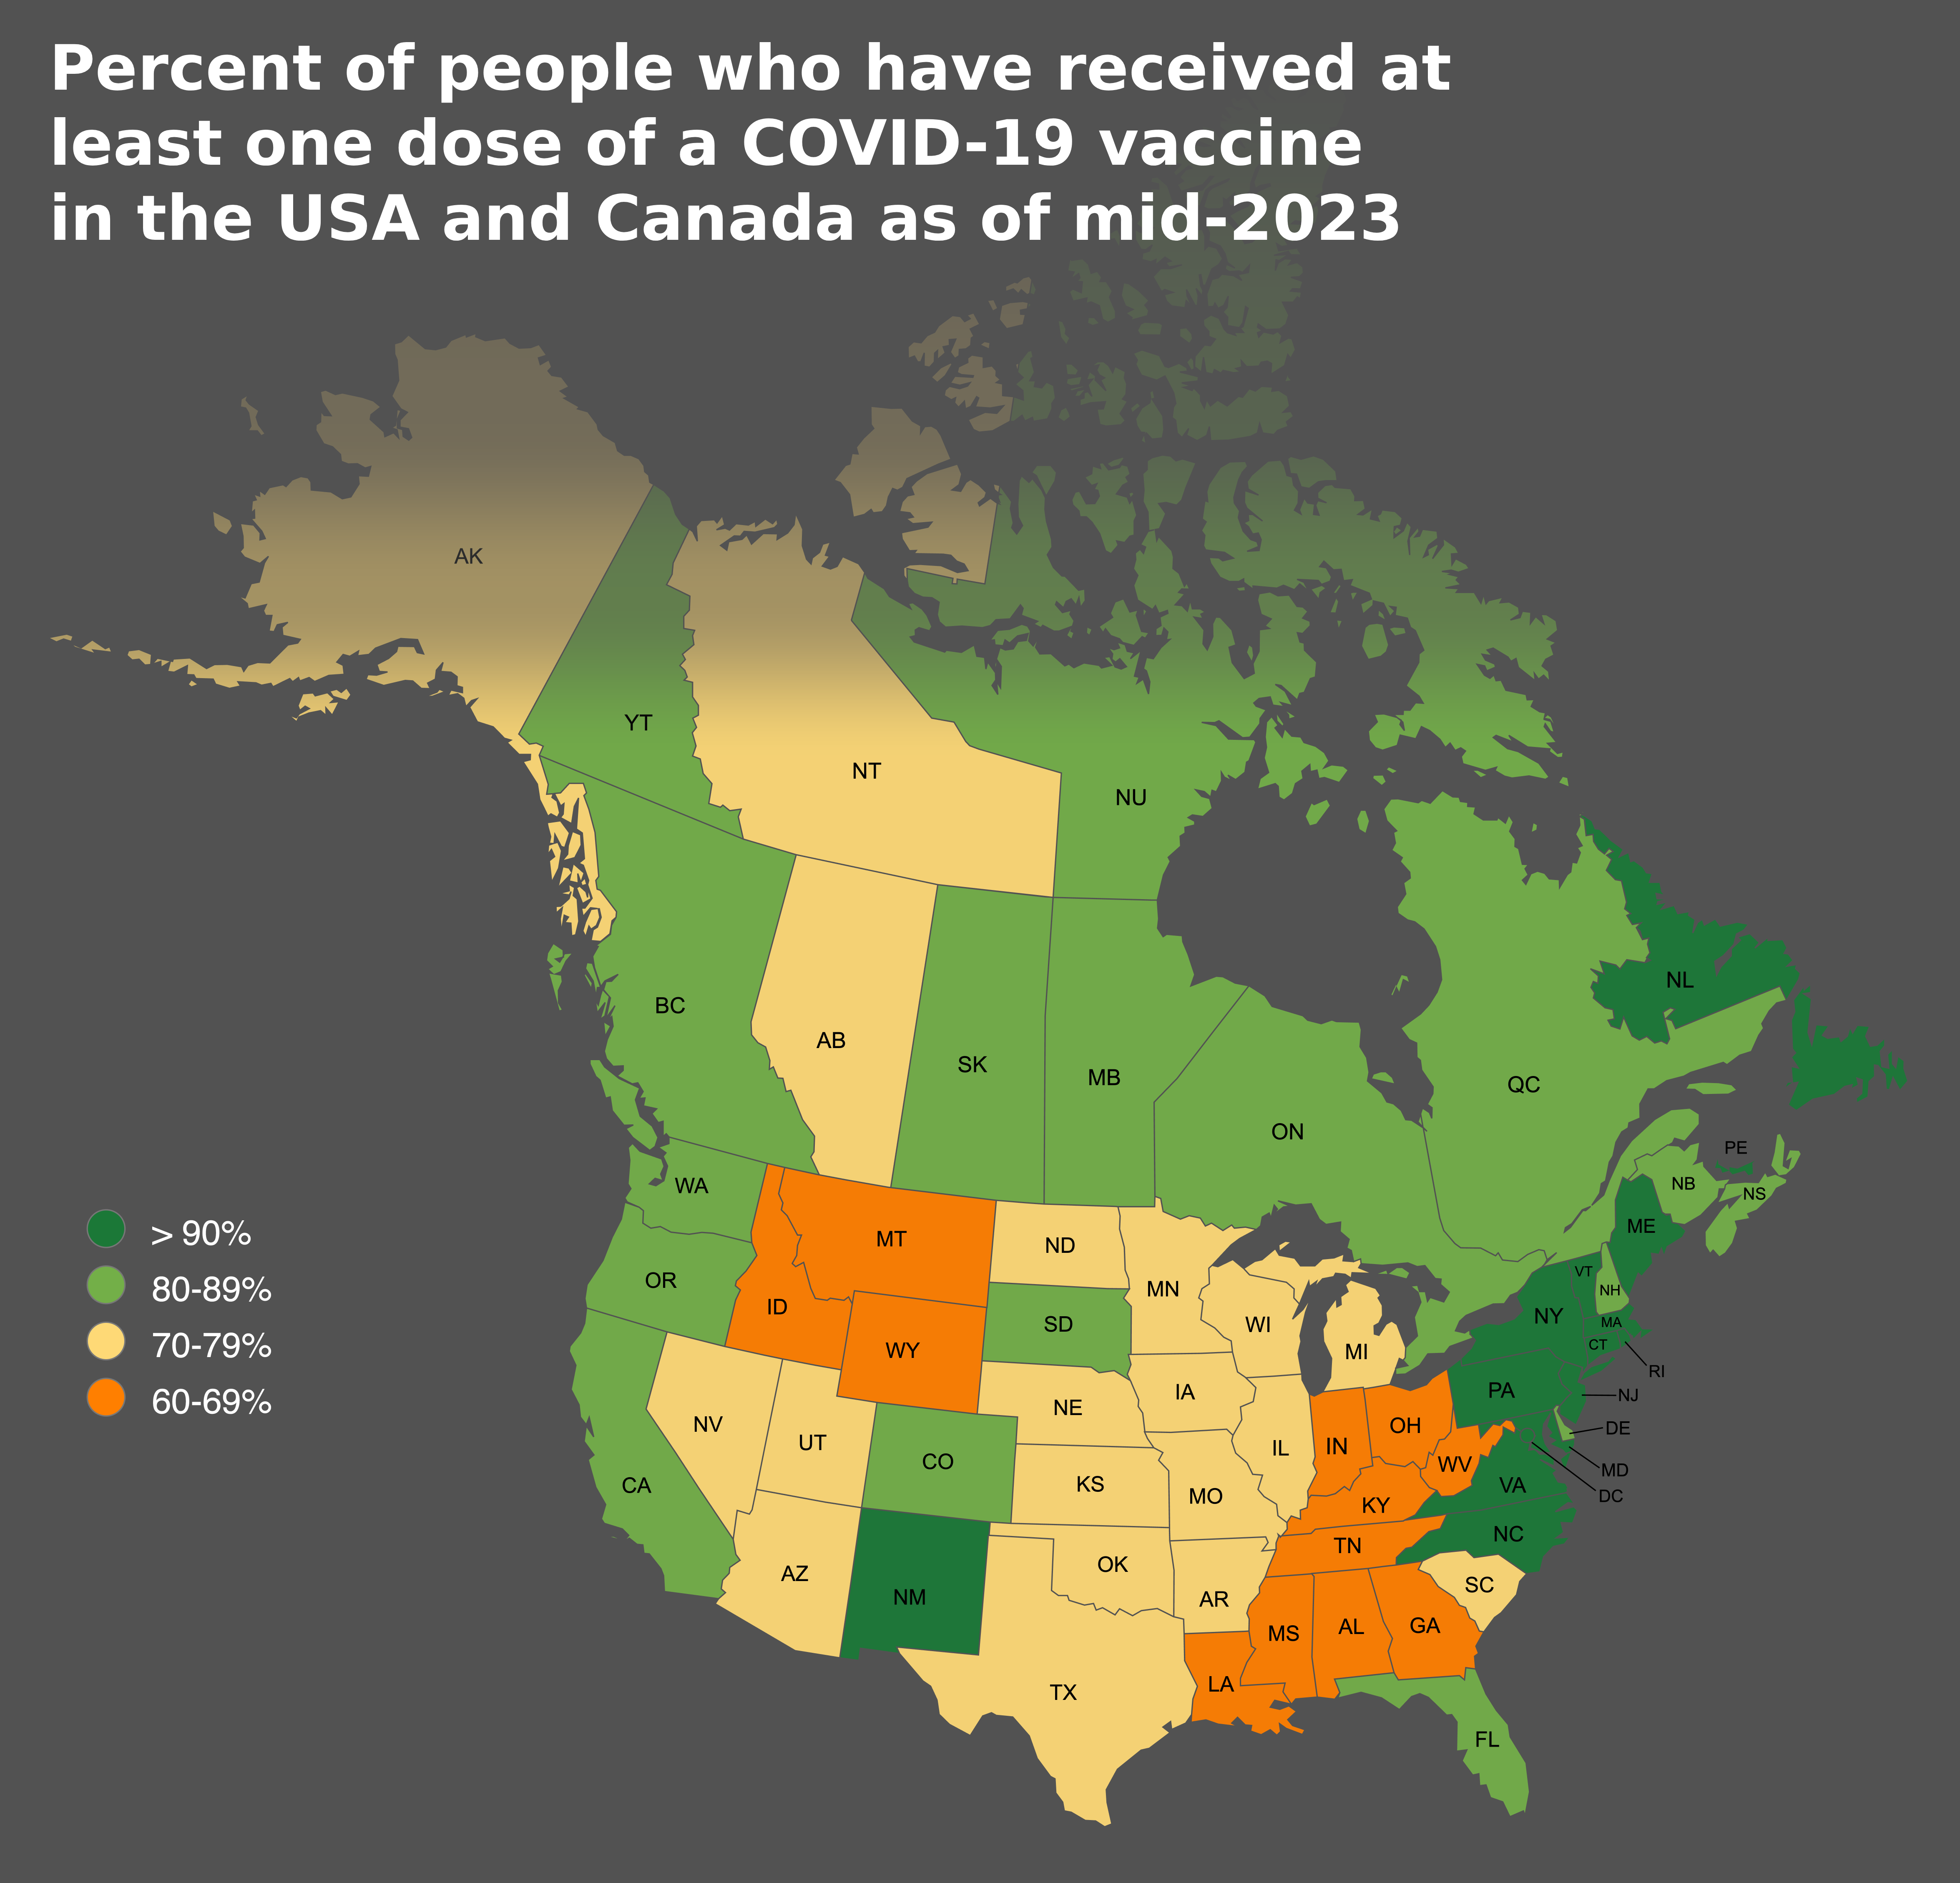
This map provides a clear visualization of the percentage of people who have received at least one dose of a COVID-19 vaccine across the United States and Canada as of mid-2023. As the World Health Organization (WHO) declared the pandemic over in May 2023, understanding vaccination coverage is essential for assessing public health resilience and readiness for future health challenges. The data presented here highlights the efforts made by both countries in combating the COVID-19 pandemic, showcasing the different vaccination rates that have emerged throughout various regions.
Deep Dive into Vaccine Coverage
Vaccination coverage is a critical factor in controlling infectious diseases, and COVID-19 is no exception. The map illustrates the percentage of individuals who have received at least one dose of a COVID-19 vaccine, indicating the level of public health engagement and the effectiveness of vaccination campaigns in both countries. As of mid-2023, the United States reported varying vaccination rates across states, with some areas achieving over 80% coverage while others lagged behind. For instance, states like Vermont and Connecticut boasted impressive vaccination rates, attributing their success to strong public health policies and community outreach initiatives.
In Canada, the vaccination strategy was similarly robust. The nation implemented a coordinated approach, leveraging both federal and provincial resources to ensure that vaccines were accessible to all Canadians. By mid-2023, many provinces had reported vaccination rates exceeding 80%, with British Columbia and Ontario leading the charge. The Canadian government’s approach emphasized the importance of equity in vaccine distribution, addressing disparities in access among marginalized communities.
Interestingly, the differences in vaccination rates can reflect broader social and economic factors. Regions with higher education levels and better access to healthcare facilities tend to show higher vaccination rates. Conversely, areas with lower rates often coincide with higher levels of vaccine hesitancy, misinformation, and logistical challenges in accessing vaccination centers. Have you noticed how these trends parallel other public health initiatives?
Beyond just the numbers, vaccination coverage plays a significant role in shaping community health dynamics. Areas with higher vaccination rates tend to experience fewer hospitalizations, thereby reducing the strain on healthcare systems. This is particularly important given the potential for new variants of COVID-19 to emerge. The data suggests that maintaining high vaccination rates is key to preventing future outbreaks, making this topic not just relevant but crucial for public health discourse.
Regional Analysis
When we delve deeper into the map, regional variations become apparent. In the United States, the Northeast generally shows higher vaccination rates compared to the South and parts of the Midwest. For example, states like New York and Massachusetts reported vaccination rates around 85%, while states like Mississippi and Alabama struggled to exceed 60%. This discrepancy raises questions about healthcare access and public health messaging effectiveness in different cultural contexts.
Canada, on the other hand, presents a more uniform picture, with all provinces showing relatively high vaccination coverage. However, there are still notable differences; for instance, remote Indigenous communities faced unique challenges that impacted their vaccination rates. The federal government has since prioritized vaccination efforts in these regions, aiming to close the gap that exists due to geographical and socio-economic barriers.
Interestingly, the pandemic has also led to a reevaluation of healthcare infrastructure and policies in both countries. In the U.S., the disparities in vaccination rates have sparked discussions about healthcare reform and the need for more equitable access to medical services. Similarly, Canada’s experience has highlighted the importance of a robust public health system that can respond effectively to emergencies.
Significance and Impact
Understanding the percentage of individuals vaccinated against COVID-19 is vital for several reasons. It not only reflects public health success but also serves as a bellwether for societal trust in health authorities. As we move beyond the pandemic phase, the focus on vaccination will likely shift towards maintaining immunity, monitoring for vaccine-resistant variants, and preparing for future public health emergencies.
Moreover, high vaccination rates contribute to herd immunity, reducing the overall spread of the virus within communities. This is crucial for protecting vulnerable populations who may not be able to receive vaccines due to medical conditions. In this light, the map serves as a reminder of the collective responsibility we hold in safeguarding public health. As we look to the future, the lessons learned from this pandemic should guide our approach to vaccination and healthcare policy, ensuring resilience against any future health crises.
In conclusion, the COVID-19 vaccine coverage map for the USA and Canada as of mid-2023 encapsulates a significant aspect of our ongoing public health journey. It highlights not just numbers, but the stories and challenges behind those statistics, emphasizing the need for continued vigilance and commitment to health equity in the years to come.
Visualization Details
- Published
- August 24, 2025
- Views
- 176
Comments
Loading comments...