1944 Presidential Election Results Map of NYC

Alex Cartwright
Senior Cartographer & GIS Specialist
Alex Cartwright is a renowned cartographer and geographic information systems specialist with over 15 years of experience in spatial analysis and data...
Geographic Analysis
What This Map Shows
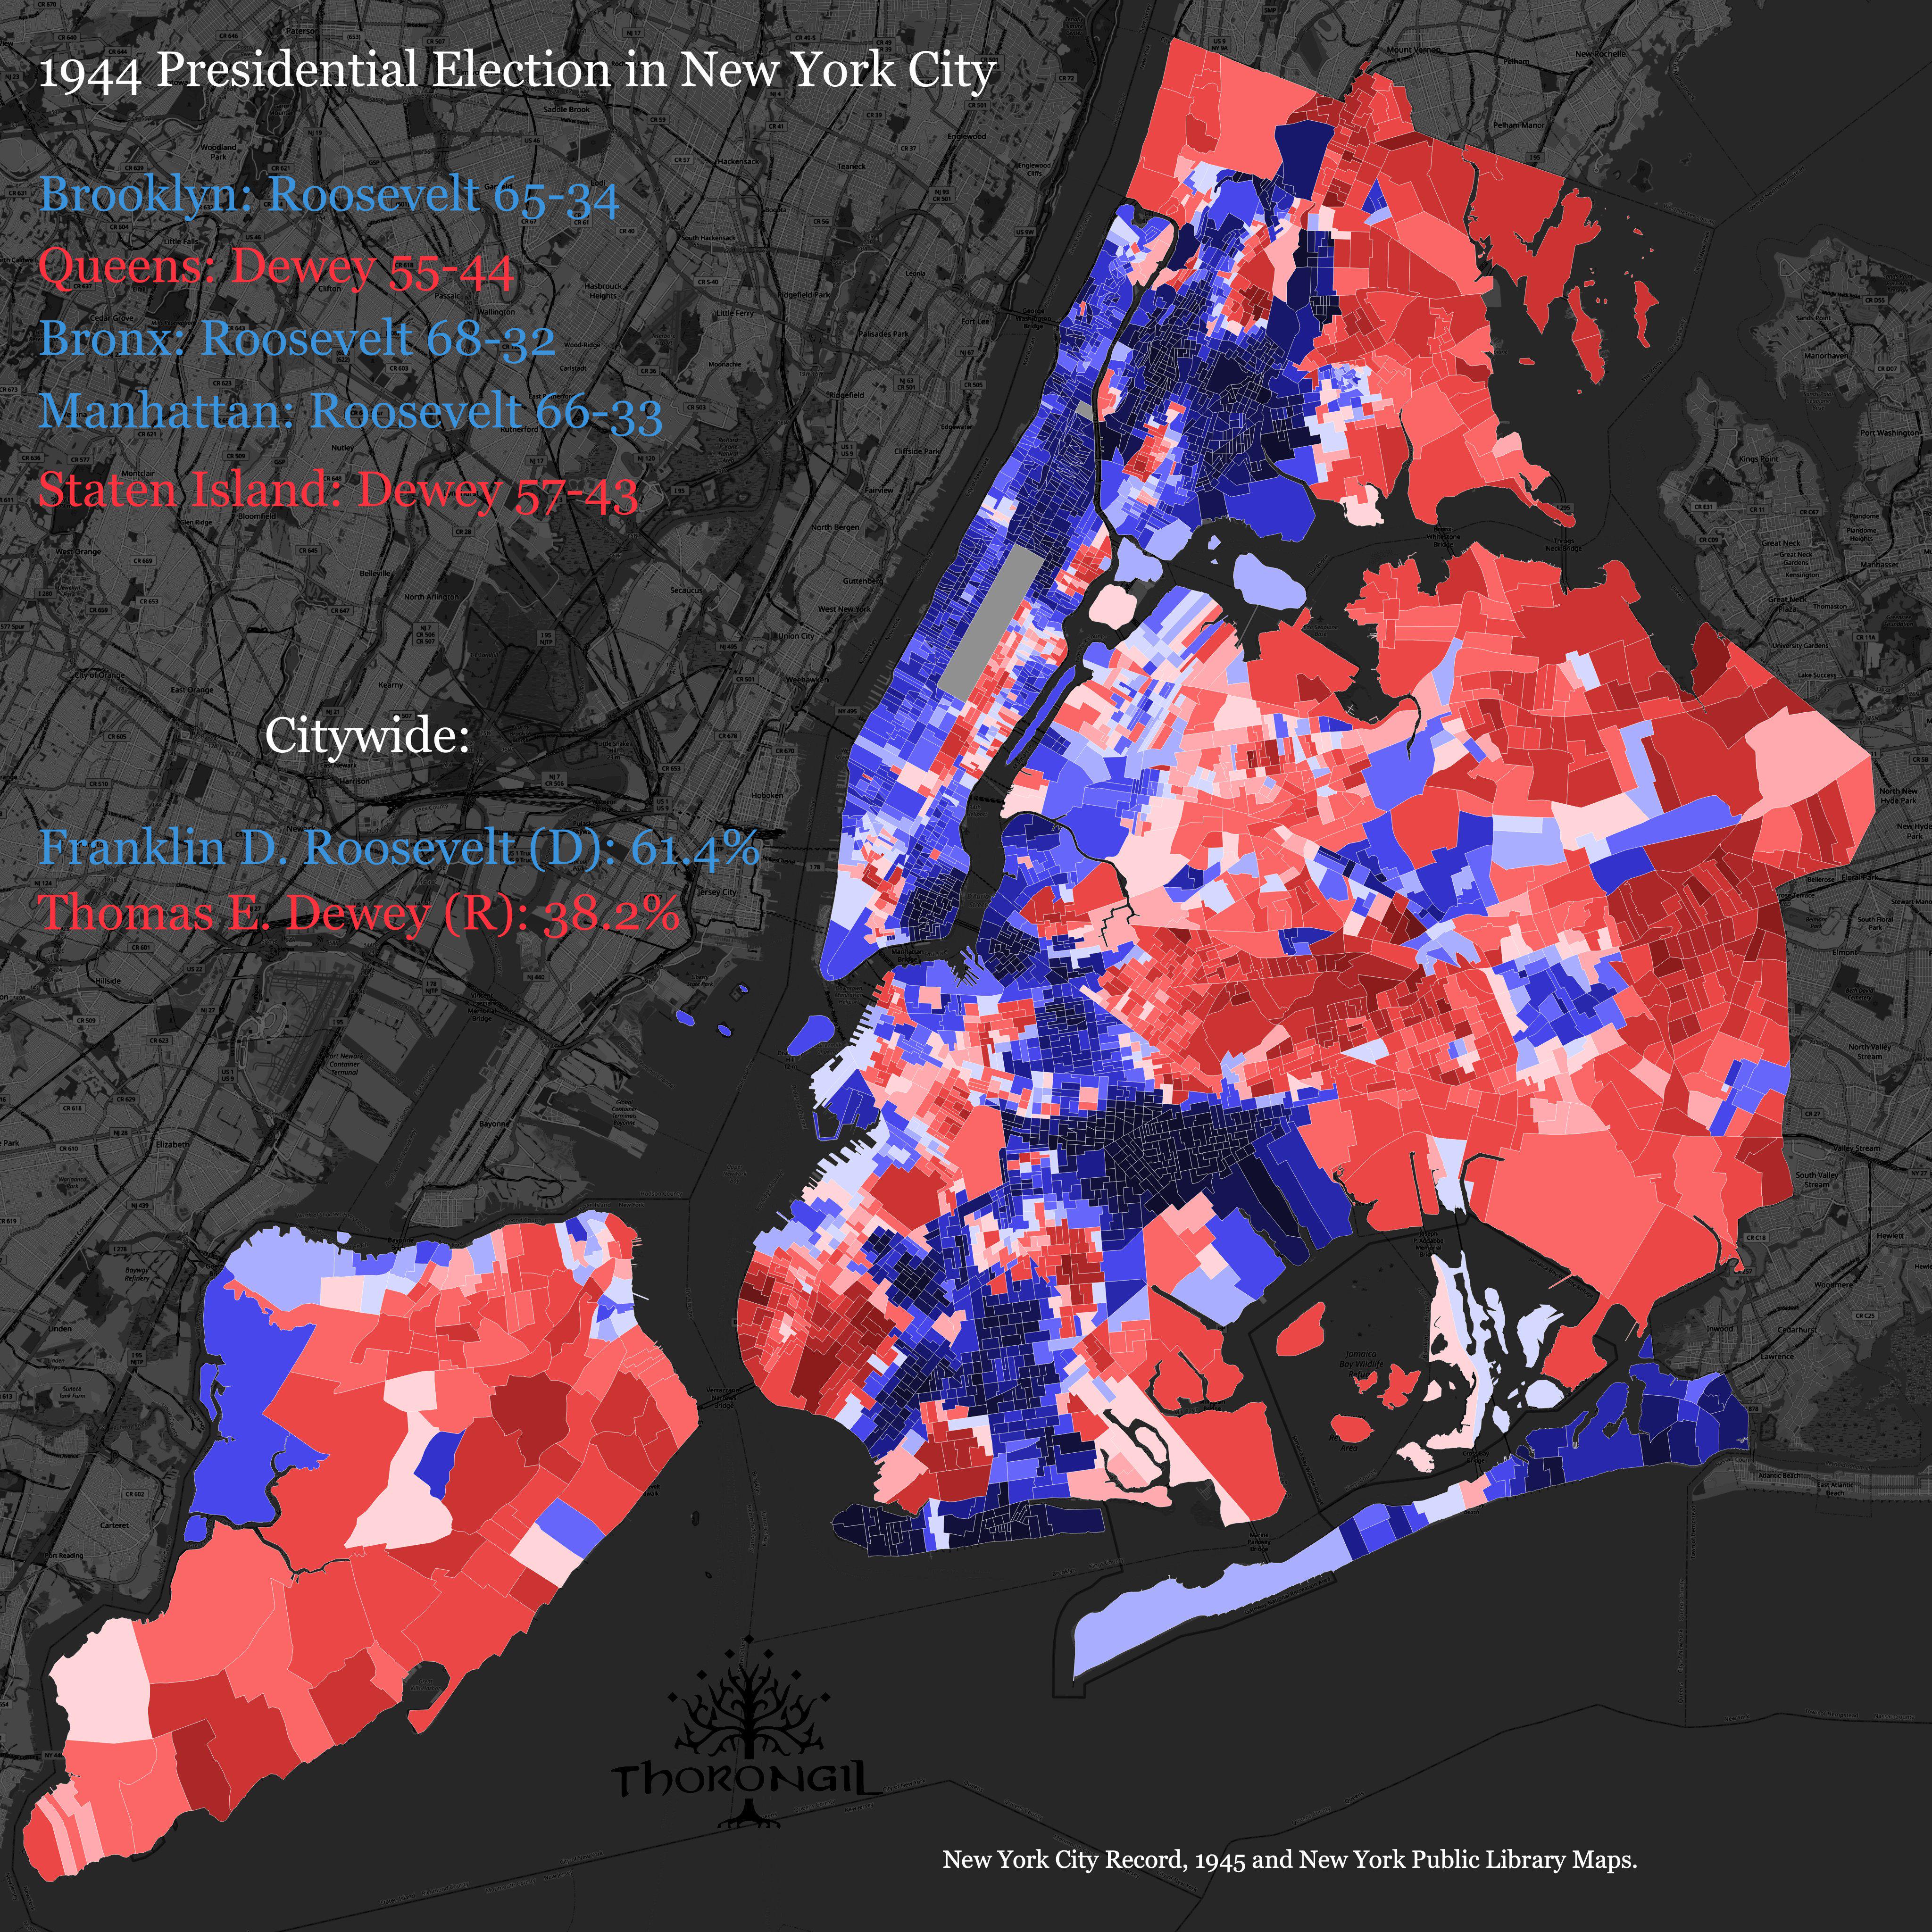
The "1944 Presidential Election Results Map of NYC" provides a visualization of how different neighborhoods and boroughs in New York City voted during the 1944 presidential election. This election saw Franklin D. Roosevelt, the incumbent president, running for a fourth term against Republican challenger Thomas E. Dewey. The map illustrates the distribution of votes across the city, revealing the political leanings of various areas. Understanding these voting patterns offers insight into the social and political landscape of New York City during a pivotal moment in American history.
Deep Dive into the 1944 Presidential Election
The 1944 presidential election occurred amid World War II, a backdrop that greatly influenced voter sentiment and priorities. Franklin D. Roosevelt, who had already been president since 1933, was seeking an unprecedented fourth term. His New Deal policies and leadership during the war were critical factors in garnering support. Interestingly, Roosevelt's platform emphasized continued wartime efforts and economic recovery, appealing to a populace still grappling with the effects of the Great Depression and the ongoing global conflict.
In New York City, Roosevelt's stronghold was evident. The borough of Manhattan, particularly neighborhoods with significant working-class and immigrant populations, overwhelmingly supported him. Areas like Harlem and the Lower East Side were key contributors to Roosevelt's victories, reflecting the support he garnered from diverse ethnic and socioeconomic groups.
On the other hand, Dewey's support was less concentrated but still notable in certain regions. For instance, parts of Queens and Staten Island showed stronger voting patterns for Dewey, highlighting a contrast in political preferences across boroughs. This division can be attributed to a variety of factors, including socio-economic status, demographic shifts, and local political dynamics.
What’s fascinating is that these voting patterns not only reflect the political climate of the time but also serve as a historical snapshot of New York City’s demographics. The city was a melting pot of cultures, and Roosevelt's appeal to the working class was crucial to his success. According to records, approximately 53% of the total vote in NYC went to Roosevelt, while Dewey managed about 47%. This close result indicates the competitive nature of the election, particularly in an era characterized by significant political engagement.
Regional Analysis
When examining the map in detail, we can break down the voting patterns further by borough. In Manhattan, Roosevelt's support was strongest, particularly in neighborhoods like Harlem, which had a large African American population. This demographic was vital in rallying support for Roosevelt, who was seen as a champion of civil rights, even if the progress was slow and ongoing.
In Brooklyn, the vote was more mixed. While many areas leaned towards Roosevelt, pockets of conservative voters showed support for Dewey, particularly in neighborhoods with established middle-class demographics. This illustrates how different communities within the same borough can hold varying political ideologies.
Queens displayed a more balanced voting pattern, with significant support for both candidates. Areas like Astoria, with its working-class residents, favored Roosevelt, whereas more affluent neighborhoods leaned towards Dewey. Staten Island, often considered a more conservative enclave, showed a stronger inclination towards Dewey, reflecting its more suburban character compared to the urban core of the city.
Significance and Impact
The 1944 presidential election was not just a pivotal moment in American politics; it also had lasting implications for New York City and the nation. Roosevelt's victory solidified the Democratic Party's dominance in the city for decades to come. However, it also highlighted the emerging political divisions that would shape future elections.
Understanding the voting patterns of 1944 provides context for the evolving demographics and political landscapes of New York City. As we look at current trends, the city continues to grapple with its identity as a diverse urban center. The lessons from the 1944 election resonate today, as political affiliations and voter turnout remain influenced by factors such as ethnicity, socioeconomic status, and regional issues.
In conclusion, the 1944 Presidential Election Results Map of NYC does more than display historical data; it encapsulates a transformative period in American history. Analyzing these patterns allows us to appreciate the complexity of urban politics and the ever-changing fabric of New York City. It raises questions about how history shapes our current political climate and how future elections may reflect the city’s dynamic identity.
Visualization Details
- Published
- August 22, 2025
- Views
- 112
Comments
Loading comments...