Light Map of Europe

Alex Cartwright
Senior Cartographer & GIS Specialist
Alex Cartwright is a renowned cartographer and geographic information systems specialist with over 15 years of experience in spatial analysis and data...
Geographic Analysis
What This Map Shows
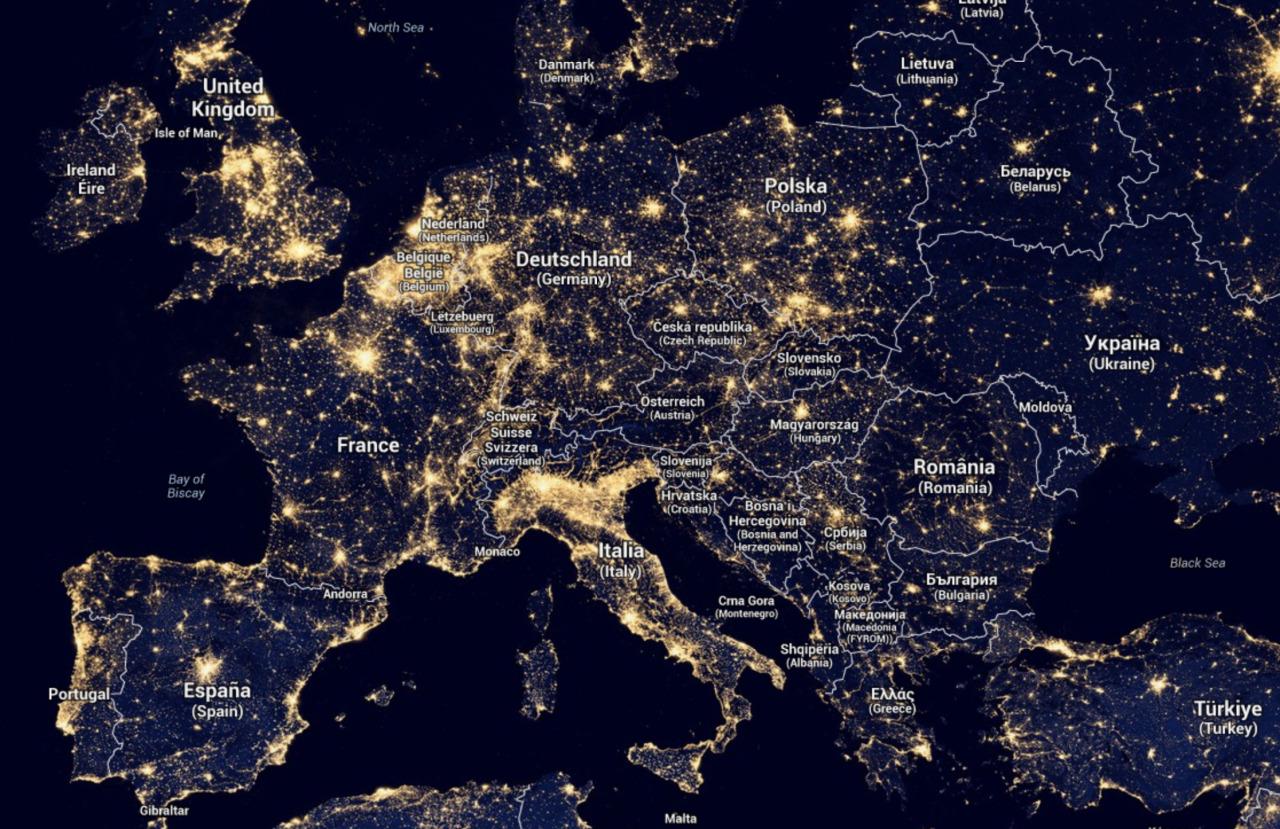
The 'Light Map of Europe' provides a stunning visual representation of nighttime illumination levels across the continent. This striking visualization highlights the density and distribution of artificial light, allowing us to infer various socio-economic and environmental indicators. The brighter areas on the map correlate with urban centers, while darker regions often indicate rural or less developed areas. By analyzing this map, we can gain insights into population distribution, urbanization trends, and even environmental impacts of light pollution.
Deep Dive into Artificial Light and Urbanization
Artificial light has transformed our world, especially in urban environments. It plays a crucial role in daily life, influencing everything from safety to productivity. Interestingly, the map reveals that light intensity is not just about sheer numbers; it reflects the human footprint on Earth. Urban areas, such as London, Paris, and Berlin, radiate bright light, which signifies high population densities and economic activity. For instance, London’s vibrant glow is not just from its sheer size, but also from its status as a global financial hub, housing numerous businesses, institutions, and cultural activities.
However, the implications of this illumination stretch beyond human convenience. Light pollution, a byproduct of excessive or misdirected artificial lighting, poses significant environmental challenges. It disrupts ecosystems, affects wildlife behavior, and even impacts human health by interfering with sleep patterns. Have you noticed how many stars you can see in a city compared to the countryside? The stark difference is largely due to this light pollution. According to the International Dark-Sky Association, nearly 80% of the world’s population lives under light-polluted skies, with Europe being no exception.
In terms of energy consumption, brighter areas typically indicate higher usage of electricity for lighting, which raises questions about sustainability. Countries like Norway, despite their high levels of urbanization, manage to maintain lower light pollution levels due to their emphasis on sustainable energy sources. Interestingly, this contrast can be seen when comparing urban areas in Southern Europe, such as Madrid, with those in Northern Europe, like Stockholm. Both cities are vibrant and bustling, yet their approaches to urban lighting and energy consumption vary greatly.
Regional Analysis
When we dissect Europe further, we can observe significant variations in light density across its regions. For instance, Western Europe displays the highest levels of artificial light, primarily due to its dense population and extensive urban development. Countries like Germany, France, and the Netherlands not only have vibrant cities but also robust infrastructure that supports high energy consumption. In Germany, cities like Frankfurt are hubs for finance and commerce, contributing to their bright spots on the map.
Conversely, Eastern Europe displays a more mixed picture. While cities such as Warsaw and Prague show a decent level of illumination, many surrounding rural areas remain dim, reflecting lower population densities and economic activity. Countries like Romania and Bulgaria, although they have urban centers, still have vast areas that are under-illuminated, pointing towards ongoing developmental challenges.
Interestingly, Scandinavia offers a unique case study. Countries like Finland and Sweden, while urbanized, have implemented initiatives to combat light pollution. Their cities are bright, yet they prioritize sustainable lighting solutions, balancing urban needs with environmental considerations. This not only enhances the quality of life for residents but also protects the natural night sky, which is crucial for local wildlife.
Significance and Impact
Understanding the implications of the 'Light Map of Europe' is essential for several reasons. First, it serves as a visual tool that can inform urban planning and policies aimed at reducing light pollution. As cities continue to grow, it becomes increasingly important to manage the urban glow effectively. The brighter the city, the more energy is consumed, and with that comes a significant carbon footprint.
Moreover, as we face pressing environmental challenges, addressing light pollution can be a step towards achieving sustainability goals. Have you ever considered how reducing light pollution could enhance our night skies while also saving energy?
Looking ahead, trends indicate a growing awareness of the negative impacts of light pollution. Many European cities are adopting 'dark sky' initiatives, promoting responsible lighting practices and awareness campaigns. These efforts are not merely about aesthetics; they also reflect a broader commitment to preserving natural ecosystems and enhancing the quality of life for both humans and wildlife.
In summary, the 'Light Map of Europe' is much more than a mere representation of nighttime illumination; it is a reflection of societal development, environmental challenges, and the ongoing quest for sustainability in an increasingly urbanized world.
Visualization Details
- Published
- August 18, 2025
- Views
- 138
Comments
Loading comments...