Climate Change Performance Index 2025 Map

David Chen
Data Visualization Specialist
David Chen is an expert in transforming complex geographic datasets into compelling visual narratives. He combines his background in computer science ...
Geographic Analysis
What This Map Shows
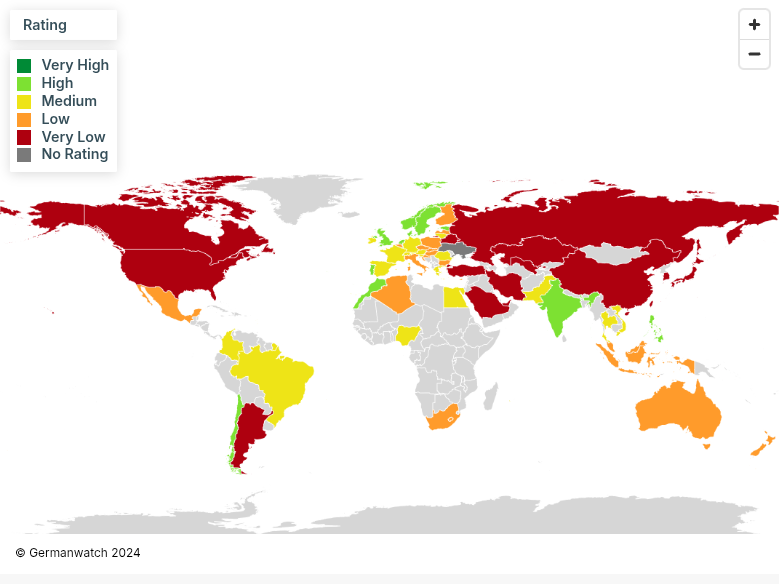
The Climate Change Performance Index (CCPI) 2025 Map visualizes the performance of countries in combating climate change. This map is based on a comprehensive assessment of various indicators, including greenhouse gas emissions, renewable energy usage, and climate policy effectiveness. Essentially, it provides a visual representation of how effectively nations are addressing the pressing issue of climate change, allowing viewers to easily identify which countries are leading the charge and which are lagging behind.
Deep Dive into Climate Change Performance
Climate change is one of the most significant challenges facing humanity today. The CCPI assesses countries based on their efforts to mitigate climate change and promote sustainability. The map is divided into four categories: high performers, moderate performers, low performers, and very low performers. Countries that are classified as high performers have made significant strides in reducing emissions and transitioning to renewable energy sources.
Interestingly, the CCPI uses a range of indicators to determine a country's score. For instance, one of the key metrics is the reduction of greenhouse gas emissions. Countries like Sweden and Denmark have been recognized for their ambitious targets and successful implementation of policies aimed at reducing their carbon footprints. In fact, Sweden has committed to achieving net-zero emissions by 2045, a goal that highlights its proactive stance on climate initiatives.
Additionally, the index evaluates the share of renewable energy in the overall energy mix. Nations such as Germany and Costa Rica have excelled in this aspect, showcasing the potential of wind and solar energy to contribute significantly to their energy needs. Costa Rica is particularly noteworthy, as it has run on more than 99% renewable energy for several consecutive years, proving that a transition to sustainable energy sources is possible on a national scale.
Another critical aspect of the CCPI is climate policy effectiveness. This evaluates how well countries have integrated climate change into their national strategies. For instance, New Zealand has been recognized for its robust climate policies, including its Zero Carbon Act, which aims to reduce emissions to net-zero by 2050. This effective governance shows that political will is crucial in the fight against climate change.
However, not all countries are making headway. Some nations are classified as low or very low performers, often due to a lack of political commitment or resources. Countries like the United States, which was previously a leader in climate initiatives, have seen a decline in their performance due to policy shifts that prioritize fossil fuel production over sustainability. This raises questions about the long-term implications of such decisions for both the environment and global climate agreements.
Regional Analysis
When examining the CCPI map regionally, it’s fascinating to see variations in climate performance. For instance, Europe stands out as a leader in climate action, with many of its countries ranked as high performers. The European Union has set ambitious goals for carbon neutrality by 2050, and countries like Finland and Norway are leading by example, showcasing their commitment to sustainable practices.
In contrast, many nations in Asia face significant challenges. Countries like India and China, while making efforts in renewable energy, still rely heavily on coal and other fossil fuels. The CCPI highlights that while India has made notable investments in solar energy, its overall emissions remain high, indicating a complex balance between economic growth and environmental responsibility.
Africa presents another mixed picture. While some countries are making strides in renewable energy, others struggle with developmental challenges that hinder effective climate action. For example, Ethiopia has invested in large-scale renewable projects, such as the Grand Ethiopian Renaissance Dam, but still faces issues related to deforestation and resource management that complicate its climate performance.
Significance and Impact
The implications of the Climate Change Performance Index are profound. Understanding how countries perform in their climate commitments is crucial for global efforts to combat climate change. The map serves as a wake-up call for nations that have fallen behind, emphasizing the need for immediate action to improve their scores.
Moreover, the CCPI is more than just a scorecard; it reflects the urgent reality of climate change and its impacts. Countries that fail to take action now may face dire consequences, including increased natural disasters, food insecurity, and economic instability. As global temperatures rise, the need for cohesive international action becomes even more critical.
Looking ahead, the trends indicated by the CCPI will likely influence future climate policies and international agreements. With the upcoming COP conferences and a heightened focus on sustainability, the pressure is on for countries to step up their game. As we move towards 2030, a pivotal decade for climate action, the CCPI acts as both a progress report and a call to arms for nations worldwide. Every country's performance matters, and the map serves as a vital tool for understanding and improving our collective response to climate change.
Visualization Details
- Published
- August 14, 2025
- Views
- 198
Comments
Loading comments...