Percent Population Change by Greek Region Map

Alex Cartwright
Senior Cartographer & GIS Specialist
Alex Cartwright is a renowned cartographer and geographic information systems specialist with over 15 years of experience in spatial analysis and data...
Geographic Analysis
What This Map Shows
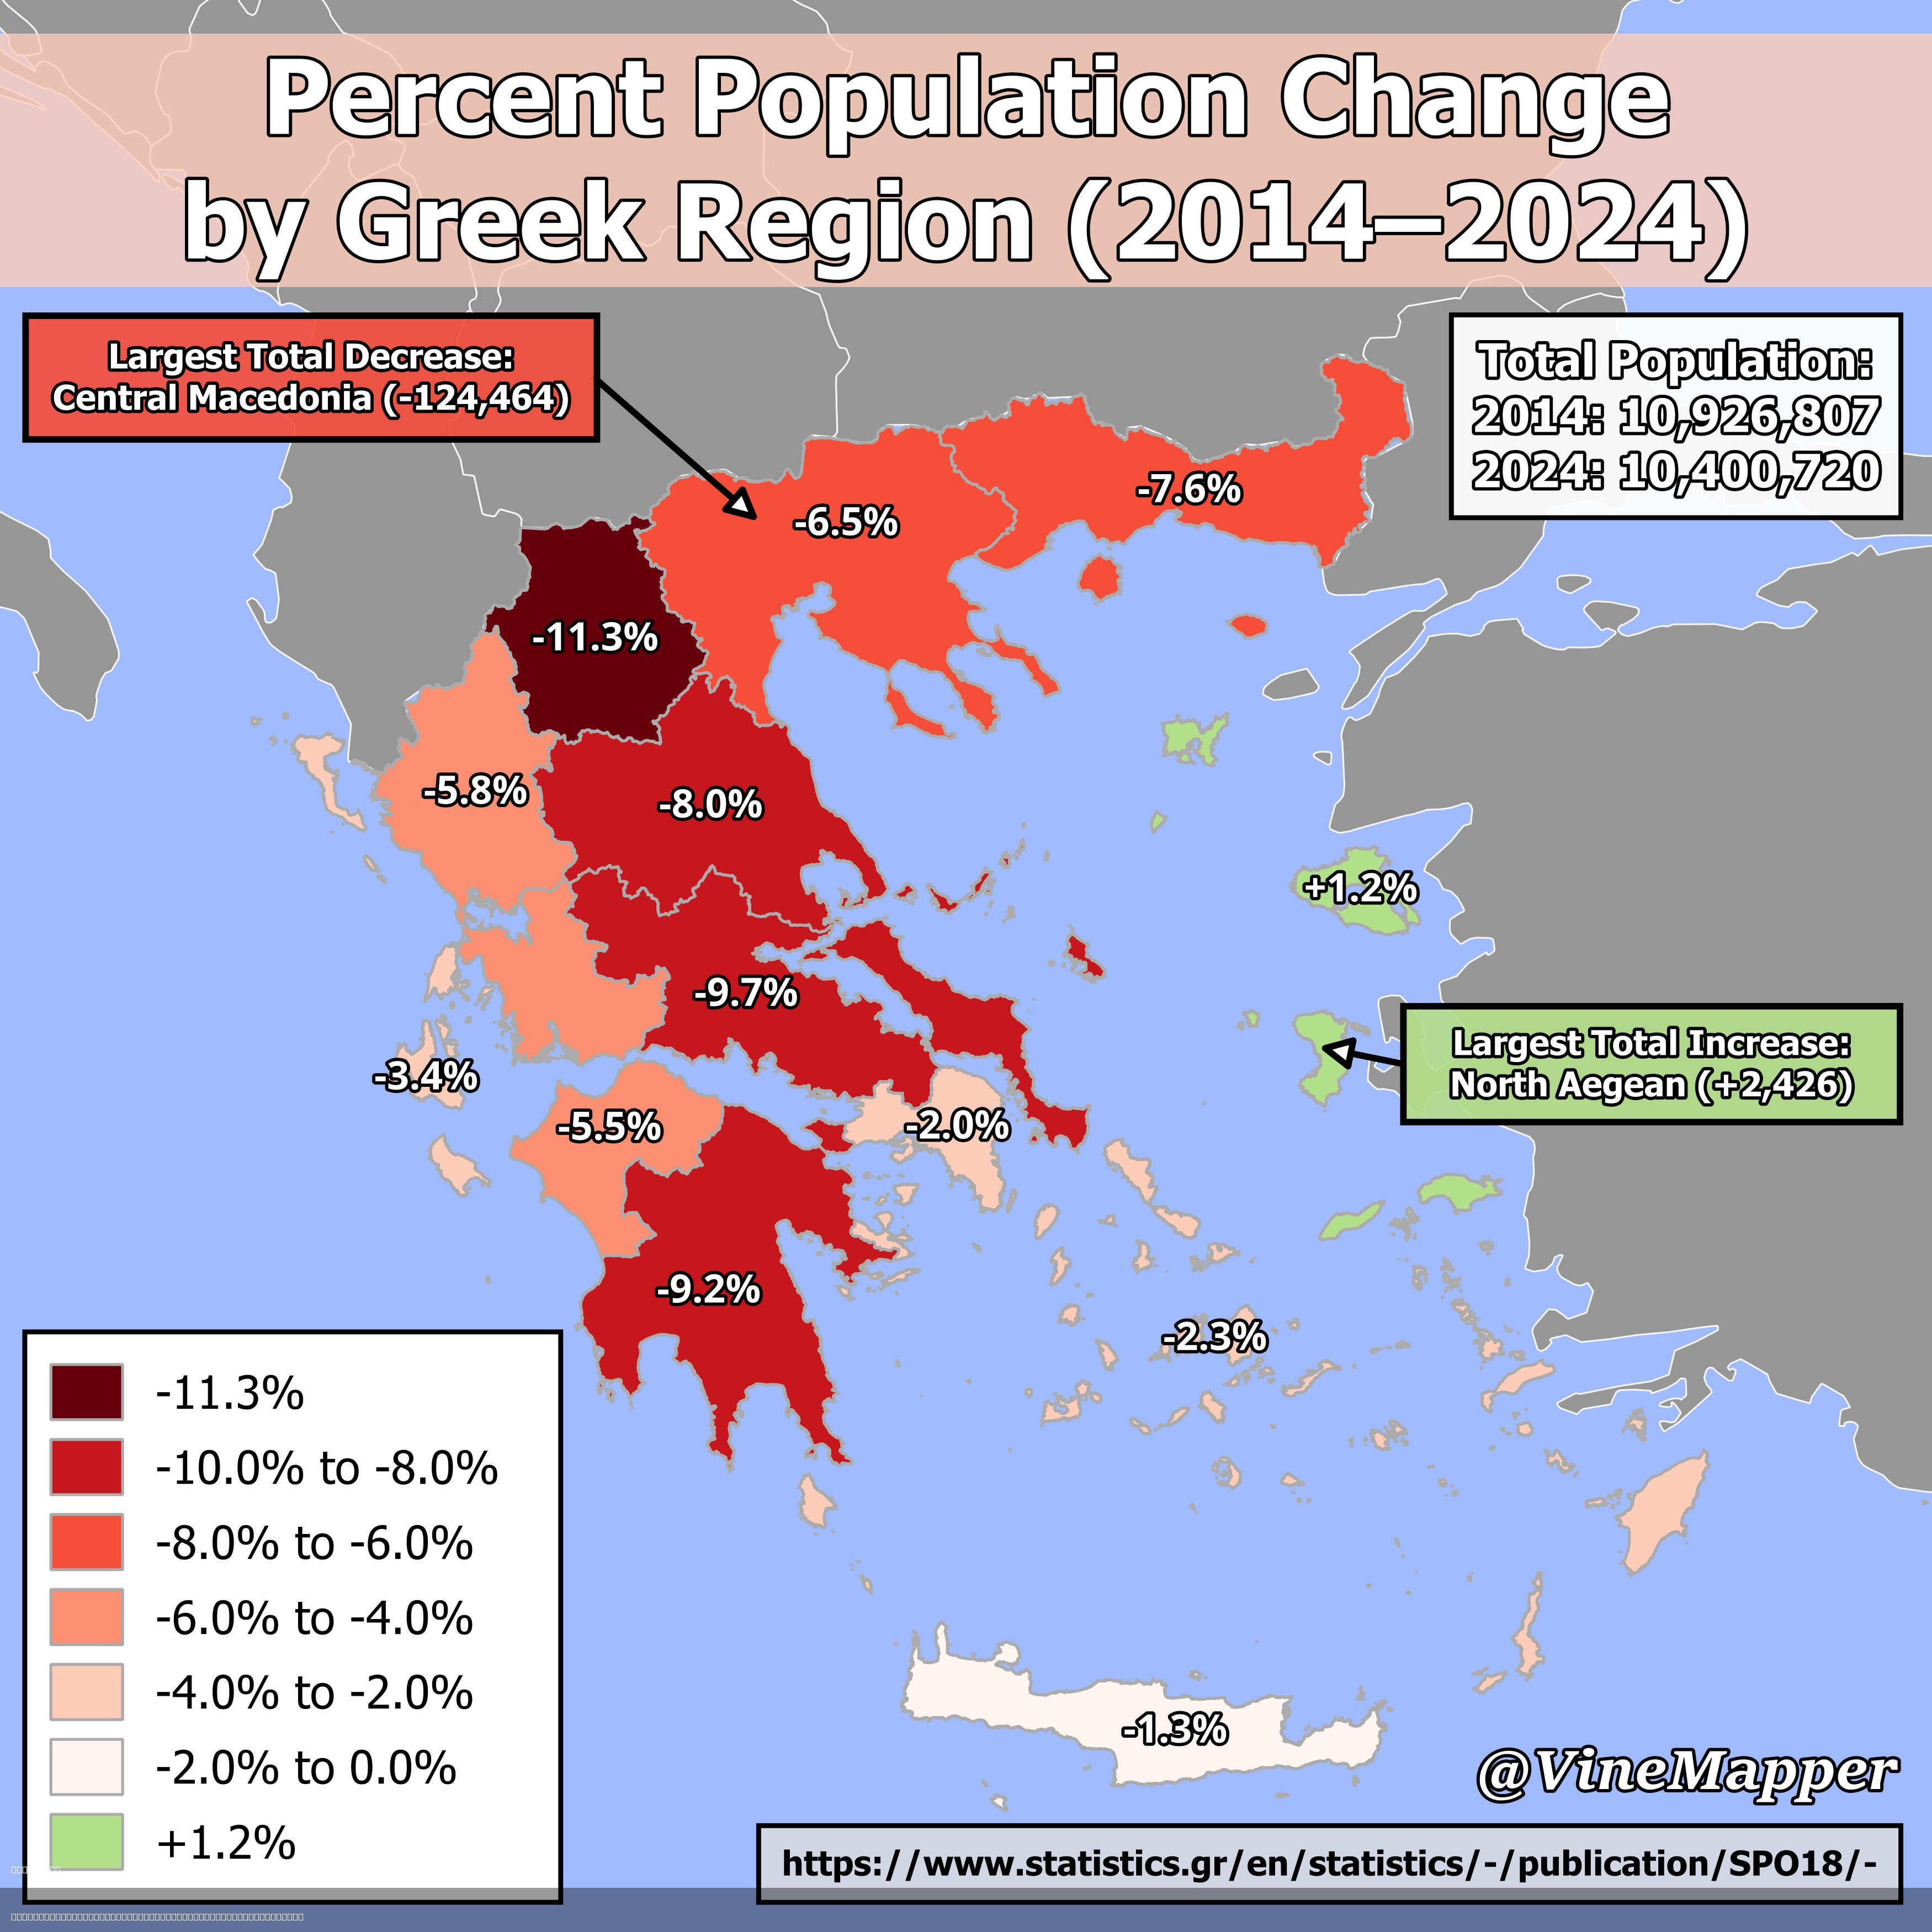
The "Percent Population Change By Greek Region (2014-2024)" map provides a clear visualization of how the population dynamics have shifted across various regions of Greece over a decade. By illustrating the percentage change in population from 2014 to 2024, this map enables us to analyze demographic trends, migration patterns, and urbanization effects in a country rich in history and cultural diversity.
While Greece is often celebrated for its ancient ruins and stunning landscapes, understanding its population trends is equally crucial. Shifts in population can indicate economic opportunities, social changes, and even shifts in political landscapes. With this map, we can delve into the underlying factors driving these changes and what they mean for the future of Greece.
Deep Dive into Population Dynamics
Population dynamics refer to the changes in population size, composition, and distribution over time. In Greece, various factors contribute to these dynamics, including migration, birth and death rates, economic conditions, and urban development. From 2014 to 2024, Greece has experienced significant changes influenced by both internal and external migration trends.
For instance, a notable aspect of population change in Greece has been the impact of the economic crisis that began in 2009. Many young Greeks sought opportunities abroad, leading to a noticeable decline in the population in certain regions. Interestingly, urban areas, particularly Athens and Thessaloniki, have seen a rise in population due to urban migration. These cities often offer better job prospects, educational opportunities, and social amenities, attracting individuals from more rural areas.
Moreover, Greece has also been a destination for migrants from other countries, especially during the ongoing refugee crisis. This influx has led to a population increase in some regions, significantly altering the demographic landscape. For example, the islands of the Aegean and areas near the mainland have experienced changes due to the arrival of asylum seekers and migrants, impacting local communities in various ways.
The map highlights these patterns effectively, showcasing regions with substantial growth versus those experiencing decline. For instance, regions such as Attica, home to the capital city of Athens, are likely to show a positive population change, while regions in the more rural parts of the country may find themselves grappling with population losses.
Regional Analysis
Breaking down the map by region reveals a complex tapestry of population changes across the country. In Attica, where urbanization is at its highest, the population has likely increased due to both internal migration and a burgeoning job market. The capital and its suburbs have become a magnet for individuals seeking employment, education, and a higher standard of living.
Conversely, regions such as the Peloponnese and parts of Central Greece might be facing a decline in population. Here, factors such as aging populations, lower birth rates, and outmigration can explain the negative percentage changes. For example, rural areas may struggle to retain younger generations as they move to cities for better opportunities, a trend seen in many parts of Europe.
Interestingly, some islands in the Aegean Sea may exhibit unique population dynamics, with certain areas experiencing growth due to tourism and seasonal migration. The increased demand for summer housing and services can lead to temporary population spikes, which can be reflected in the map’s data.
When comparing regions, it’s also essential to consider how local economies impact population changes. Regions that have diversified their economies, such as those investing in tourism, technology, or renewable energy, may benefit from population growth, while those reliant on traditional industries may struggle.
Significance and Impact
Understanding population change is not just an academic exercise; it has real-world implications for policy-making, urban planning, and resource allocation. The shifts illustrated in this map can help inform government decisions regarding infrastructure development, healthcare services, and educational resources. For instance, regions experiencing significant population growth may require more schools and healthcare facilities, while those in decline might need support for aging populations.
Furthermore, the implications of these changes can influence social cohesion and cultural dynamics within communities. Areas with increasing populations may face challenges related to integration and resource distribution, while declining regions may need to address issues related to economic stagnation and community support.
Looking ahead, the trends observed in this map may continue to evolve due to ongoing economic conditions, climate change, and geopolitical factors. The future of Greece's population distribution will likely reflect a combination of these influences, making it crucial for stakeholders to adapt and respond to these changes proactively. As we consider the next decade, one can only wonder how these evolving dynamics will shape the social and economic fabric of Greece.
Visualization Details
- Published
- August 4, 2025
- Views
- 100
Comments
Loading comments...