Maximum Solar Potential in the USA Map

David Chen
Data Visualization Specialist
David Chen is an expert in transforming complex geographic datasets into compelling visual narratives. He combines his background in computer science ...
Geographic Analysis
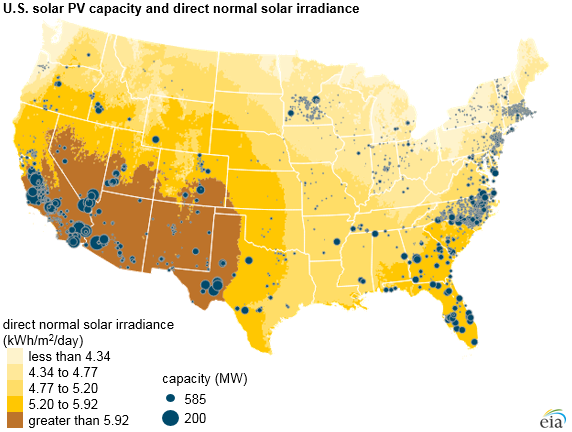
What This Map Shows
The "Maximum Solar Potential in the USA Map" visualizes the solar energy potential across different regions in the United States. This map highlights areas that receive the most sunlight throughout the year, thereby indicating where solar energy can be harnessed most effectively. It’s fascinating to see how geographical features, climate, and latitude contribute to varying levels of solar exposure, making solar energy a viable option in many parts of the country.
Deep Dive into Solar Energy Potential
Solar energy is derived from the sun's radiation, which can be converted into electricity or heat. The amount of solar energy that can be harvested in a specific location depends on several factors, including geographical location, local climate conditions, and the angle of sunlight at different times of the year. Interestingly, the United States is endowed with diverse climatic zones, ranging from the sunny deserts of the Southwest to the more temperate regions in the Northeast.
Did you know that solar panels are most effective in areas that receive consistent sunlight throughout the year? According to the National Renewable Energy Laboratory (NREL), regions like the Southwest, particularly Arizona and Nevada, boast some of the highest solar potential due to their clear skies and high solar irradiance. These areas can generate approximately 6 to 7 kilowatt-hours per square meter per day, making them prime candidates for large-scale solar farms.
However, what might come as a surprise to many is Florida's significant solar potential. Often dubbed the "Sunshine State," Florida ranks high in solar energy production, despite its humid subtropical climate. The state benefits from an abundance of sunny days and has made large investments in solar infrastructure. In fact, Florida is among the top five states in terms of installed solar capacity, demonstrating that solar energy can thrive in various climates.
The map also reveals that solar energy potential is not just limited to sunny states. Regions in the Midwest, for instance, show promising solar potential as well, primarily due to advancements in solar technology and decreasing costs of installation. States like Illinois and Ohio, which may not be known for their sunshine, have seen an increase in solar installations, driven by state policies and incentives that encourage renewable energy use.
Regional Analysis
When analyzing the map regionally, the West Coast stands out with California leading the charge in solar energy production. California's combination of high solar irradiance, supportive policies, and a robust economy has resulted in over 30% of the nation's total solar capacity. In contrast, the Pacific Northwest, with its cloudy weather, exhibits lower solar potential, yet it still contributes to renewable energy through hydropower, showcasing the diversity of energy resources across the country.
In the Northeast, states like New York and Massachusetts have made strides in solar energy despite having less sunlight than their southern counterparts. These states have implemented favorable regulations, tax incentives, and community solar programs to promote solar adoption. Interestingly, the increased focus on solar energy in these regions highlights a shift toward sustainability and energy independence.
In the South, Texas emerges as a leader in solar energy potential, thanks to its vast land area and ample sunshine. Texas is not just about oil; it’s also becoming a powerhouse for renewable energy, with solar farms sprouting up across the state. The sheer scale of sun exposure combined with a growing push for renewable energy sources makes Texas a key player in the national solar landscape.
Significance and Impact
Understanding the maximum solar potential across the USA is crucial as the nation moves toward a more sustainable energy future. Solar energy is not only environmentally friendly but also offers economic benefits, such as job creation in the renewable energy sector and decreased reliance on fossil fuels. As solar technology continues to improve and costs decrease, we can expect to see a significant uptick in solar installations across the country.
What's fascinating is that the push for solar energy aligns with global efforts to combat climate change. By harnessing solar power, the USA can significantly reduce greenhouse gas emissions, promoting a cleaner and healthier environment. Furthermore, as local governments implement policies supporting renewable energy, we may witness a paradigm shift in how energy is generated and consumed.
In conclusion, the "Maximum Solar Potential in the USA Map" serves as a powerful tool for understanding where solar energy can thrive, helping to guide investments and policies that pave the way for a more sustainable future. As we continue to explore renewable resources, the significance of solar energy will only grow, making this map not just a visualization but a roadmap to a brighter, greener future.
Visualization Details
- Published
- October 25, 2025
- Views
- 10
Comments
Loading comments...