GDP Per Capita PPP Map of Latin America 2025

Marcus Rodriguez
Historical Geography Expert
Marcus Rodriguez specializes in historical cartography and geographic data analysis. With a background in both history and geography, he brings unique...
Geographic Analysis
What This Map Shows
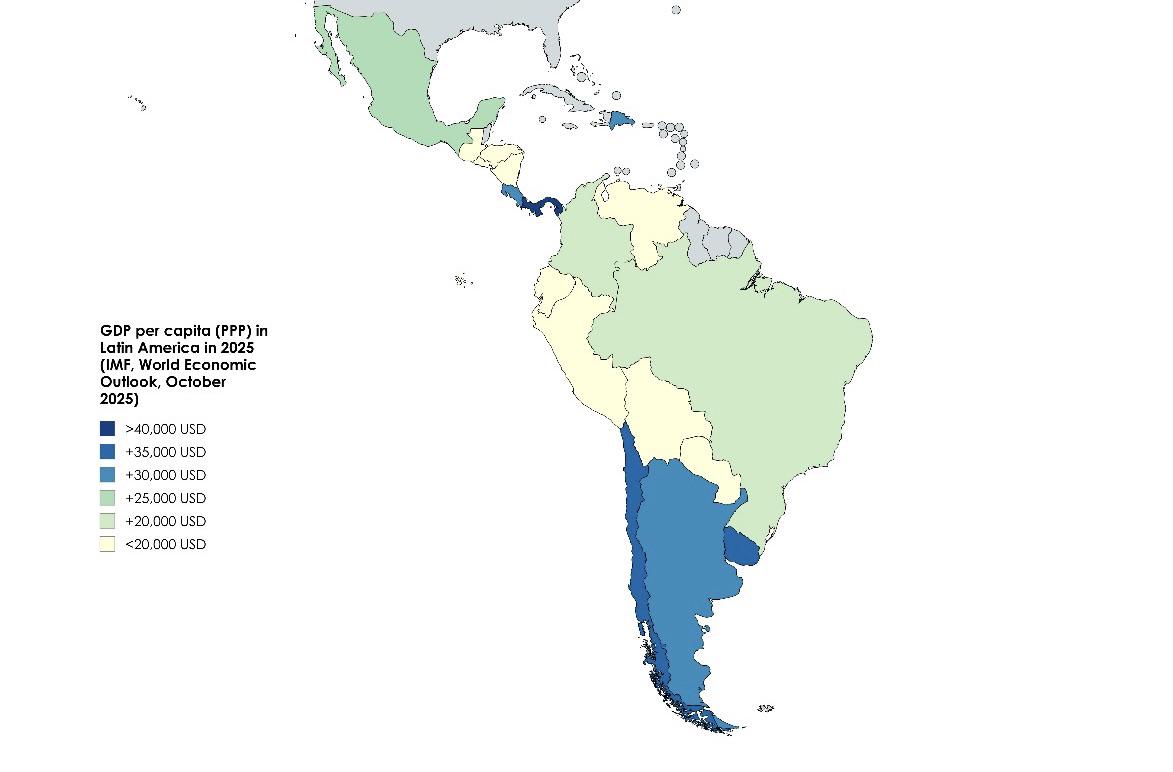
The GDP per capita (PPP) map of Latin America for 2025, as provided by the IMF World Economic Outlook report, offers a comprehensive view of the economic landscape across the region. This visualization highlights the purchasing power parity (PPP) adjusted GDP per capita, allowing us to understand not just how much wealth is generated in each country, but also how that wealth translates into the standard of living for individuals.
By focusing on GDP per capita (PPP), we can gain insights into the economic well-being of populations, taking into account local price levels and cost of living. This metric is particularly important in a diverse region like Latin America, where economic conditions can vary significantly from one country to another.
Deep Dive into GDP Per Capita (PPP)
GDP per capita (PPP) is a crucial indicator for evaluating the economic health of nations, particularly in developing regions. It reflects the average economic output per person, adjusted for purchasing power differences across countries. This adjustment is vital in Latin America, where currency fluctuations and varying costs of goods and services can paint a misleading picture if only nominal GDP figures are considered.
Interestingly, the disparities in GDP per capita (PPP) across Latin America reveal much about the region’s economic dynamics. For example, in 2025, countries like Chile and Uruguay are projected to maintain relatively high GDP per capita (PPP) values, signaling robust economies bolstered by stable political environments and diversified economic activities. Chile, known for its mining sector and agricultural exports, continues to capitalize on its natural resources, while Uruguay benefits from a strong emphasis on social welfare and education, which contribute to a productive workforce.
On the other end of the spectrum, nations such as Nicaragua and Honduras face challenges that impact their economic outputs. High levels of inequality, political instability, and reliance on agriculture make it difficult for these countries to elevate their GDP per capita (PPP) figures significantly. For instance, while Honduras has made strides in improving its economic conditions, the effects of natural disasters and socio-economic strife continue to impede consistent growth.
Moreover, what's fascinating is the role of urbanization in shaping these figures. As more people move to cities, we often see a corresponding rise in GDP per capita (PPP) due to increased access to jobs and services. However, this urban migration also brings challenges, such as overpopulation and inadequate infrastructure, which can offset the benefits of economic growth.
Regional Analysis
When we break down the map, it becomes clear that South America generally exhibits higher GDP per capita (PPP) values compared to Central America and the Caribbean. For example, in 2025, it is expected that Argentina, despite its economic volatility, will show a significant GDP per capita (PPP), benefiting from its industrial base and agricultural exports.
In Central America, the situation is more varied. Costa Rica stands out with a relatively high GDP per capita (PPP) due to its focus on ecotourism and education, while countries like El Salvador and Guatemala continue to struggle, with lower figures reflecting ongoing challenges related to crime and limited access to education.
Additionally, the Caribbean nations often showcase high GDP per capita (PPP) figures due to tourism, which serves as a significant economic driver. Countries like the Bahamas and Barbados have relatively high income levels, but they remain vulnerable to external shocks, such as global economic downturns or natural disasters.
Significance and Impact
Understanding GDP per capita (PPP) is crucial for various stakeholders, including policymakers, businesses, and foreign investors. For policymakers, these figures can guide economic reforms and resource allocation. High GDP per capita (PPP) may encourage investment in infrastructure and education, while areas with lower figures may require targeted interventions to stimulate growth.
Moreover, the implications of these economic indicators extend beyond numbers. They influence the quality of life for citizens, affecting access to healthcare, education, and employment opportunities. As we look toward the future, it’s essential to consider how current trends, such as technological advancement and globalization, will shape the economic landscape of Latin America. Will countries leverage their strengths to improve living standards, or will challenges such as inequality and environmental issues hinder progress? Only time will tell, but the GDP per capita (PPP) map serves as a vital tool in understanding the journey ahead for this diverse and dynamic region.
Visualization Details
- Published
- October 24, 2025
- Views
- 26
Comments
Loading comments...