Real GDP Growth Projection Map for Europe 2025

David Chen
Data Visualization Specialist
David Chen is an expert in transforming complex geographic datasets into compelling visual narratives. He combines his background in computer science ...
Geographic Analysis
What This Map Shows
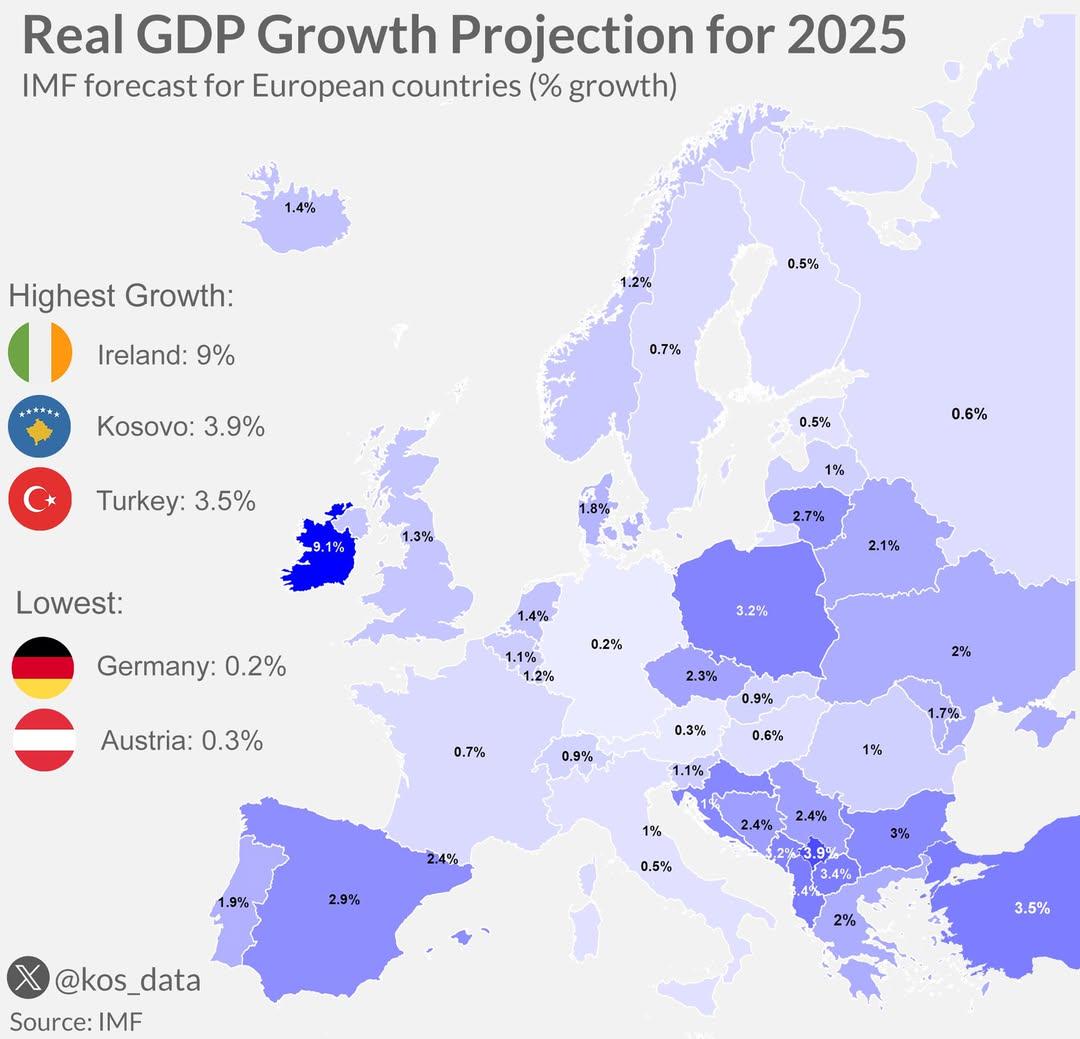
The "Real GDP Growth Projection for 2025 - Europe" map visualizes the anticipated economic growth across various European countries. It provides a snapshot of how different nations are expected to perform economically in the coming years, highlighting both potential growth leaders and laggards. This information is particularly relevant for policymakers, investors, and businesses looking to navigate the economic landscape of Europe in 2025.
Deep Dive into GDP Growth Projections
Gross Domestic Product (GDP) is a crucial measure of economic activity and overall health of a nation's economy. Real GDP takes into account inflation, providing a more accurate picture of economic performance over time. Understanding GDP growth projections is essential for assessing economic potential, investment opportunities, and the well-being of citizens.
Interestingly, projected GDP growth rates vary significantly across Europe, influenced by a myriad of factors including government policies, global economic conditions, and regional infrastructural developments. For instance, countries such as Ireland and Poland are often highlighted for their robust economic prospects due to favorable business environments and foreign investment inflows. Ireland, in particular, has seen its economy thrive due to its tech sector and favorable corporate tax rates, leading to a projected GDP growth rate that stands out among its European counterparts.
Conversely, countries like Italy and Greece have faced long-standing economic challenges, including high debt levels and structural inefficiencies. As a result, their growth projections are less optimistic, showcasing the diverse economic landscapes within the continent. The map illustrates these variances vividly, allowing stakeholders to identify which regions may present the best opportunities for growth or investment.
Another factor to consider is the impact of geopolitical events and global market trends on these projections. For example, the ongoing effects of the COVID-19 pandemic have led to significant shifts in economic activity and consumer behavior, which have been factored into these GDP growth forecasts. Additionally, the uncertainty surrounding trade negotiations and energy supply chains, especially in the context of the war in Ukraine, could greatly influence economic performance across various nations.
Regional Analysis
When examining the map, it’s clear that Northern and Western European countries often dominate the higher GDP growth projections. For instance, Germany, the continent's largest economy, is expected to maintain steady growth despite facing challenges such as labor shortages and energy transition policies. Meanwhile, Scandinavian countries like Sweden and Denmark are also poised for positive growth, buoyed by strong technology sectors and sustainable practices.
In contrast, Eastern European nations like Romania and Bulgaria are showing promising growth potential, driven by increasing foreign direct investment and labor market improvements. These countries have seen a shift in their economic models, moving from post-communist structures towards more market-oriented economies. The map makes it easy to identify these emerging players, encouraging further exploration and investment.
Southern Europe, particularly countries like Spain and Portugal, displays a mixed picture. While both nations have made significant strides in recovering from economic downturns, their growth projections reflect lingering vulnerabilities, particularly in tourism-dependent regions. The map highlights these distinctions, prompting discussions on how to bolster these economies further.
Significance and Impact
Understanding GDP growth projections is vital not just for economists but for everyday citizens. Economic growth directly impacts job creation, wage levels, and overall quality of life. For instance, higher GDP growth typically correlates with lower unemployment rates and increased public spending on healthcare and education.
Moreover, as Europe faces significant challenges such as climate change, energy transitions, and demographic shifts, the implications of these growth projections become even more profound. Countries that invest in sustainable practices and innovation are likely to reap the rewards of future economic growth, while those that do not may find themselves left behind in a rapidly evolving global economy.
In conclusion, the "Real GDP Growth Projection for 2025 - Europe" map serves as a critical tool for understanding the economic landscape of the continent. By analyzing these projections, stakeholders can make informed decisions that will shape not only their futures but also the economic trajectory of Europe as a whole. As we move closer to 2025, keeping an eye on these trends will be essential for navigating the complexities of the European economy.
Visualization Details
- Published
- October 23, 2025
- Views
- 24
Comments
Loading comments...