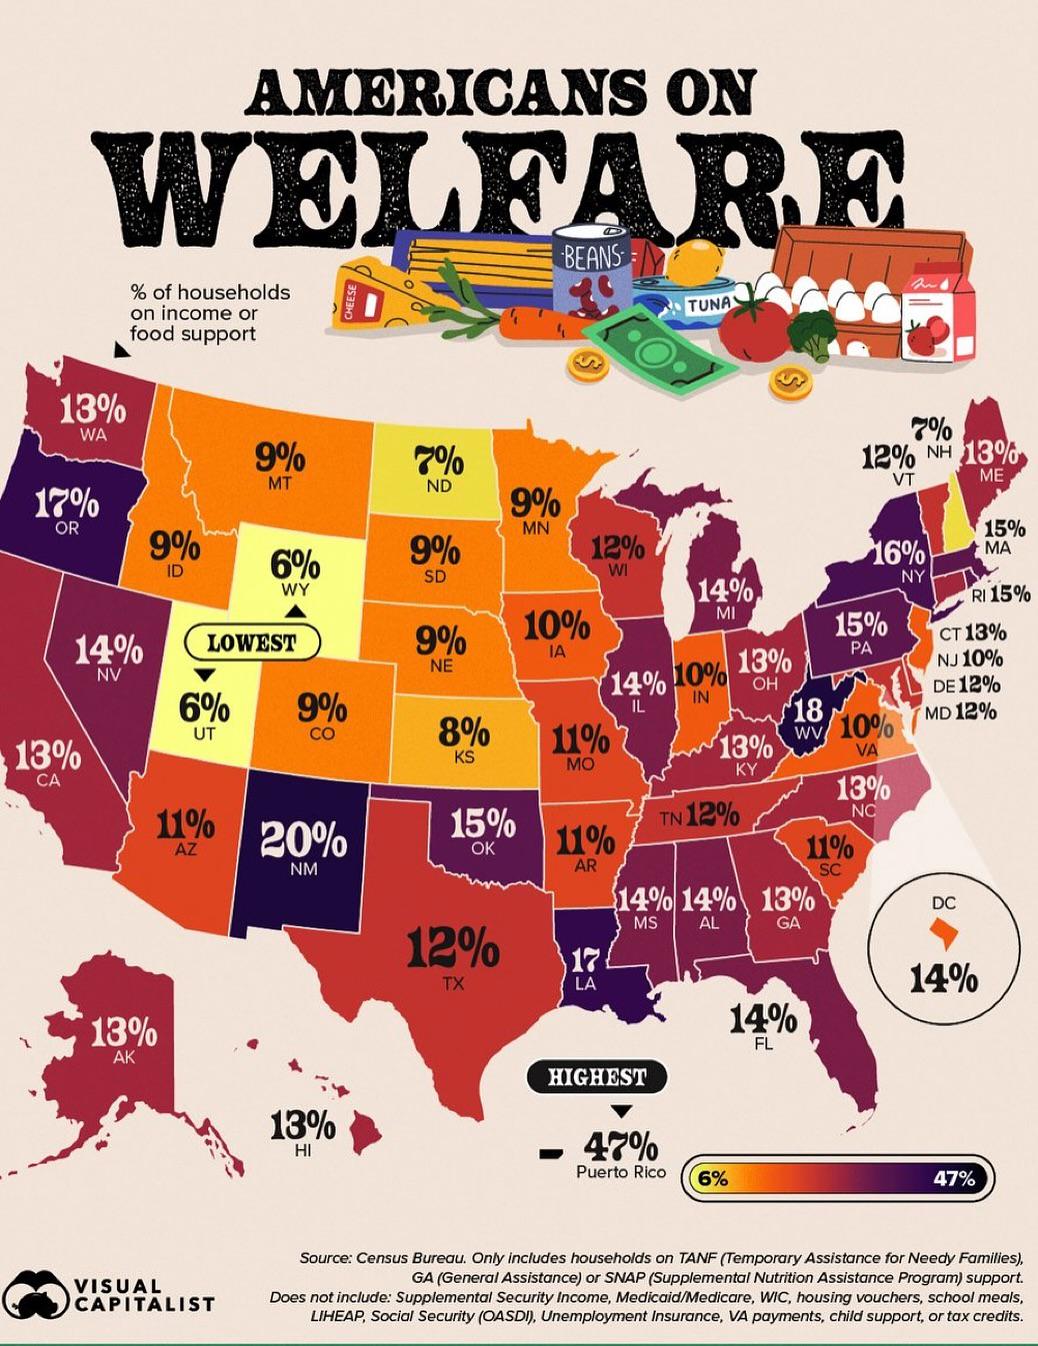
% of Households on Income or Food Support Map

Marcus Rodriguez
Historical Geography Expert
Marcus Rodriguez specializes in historical cartography and geographic data analysis. With a background in both history and geography, he brings unique...
Geographic Analysis
What This Map Shows
The "% of Households on Income or Food Support" map provides a visual representation of the percentage of households within various regions that rely on income or food assistance programs. This visualization illustrates the socioeconomic landscape of different areas, highlighting disparities in support systems and economic conditions. By examining these patterns, we can gain insights into the challenges faced by communities across the country and understand the factors that contribute to such reliance on support.
Deep Dive into Income and Food Support
Income and food support programs play a crucial role in alleviating poverty and ensuring food security for vulnerable populations. These programs include government-funded assistance initiatives such as the Supplemental Nutrition Assistance Program (SNAP), Temporary Assistance for Needy Families (TANF), and various local food banks and charities. The necessity for these programs often stems from factors such as unemployment, underemployment, high living costs, and economic downturns.
Interestingly, the reliance on food and income support can vary significantly across different demographics. For example, single-parent households, particularly those led by women, are disproportionately represented among those needing assistance. The U.S. Census Bureau reports that nearly 30% of single-mother families live below the poverty line, making them more likely to rely on these crucial programs for survival.
Moreover, economic factors play a significant role in determining the levels of support required. Regions experiencing high unemployment rates, such as parts of the Midwest and South, often show higher percentages of households relying on assistance. In contrast, areas with robust job markets and higher wages, such as coastal cities, tend to have lower percentages of households in need of support. The disparities in wealth and opportunity often lead to stark divides in the availability and accessibility of food and income assistance.
Another interesting aspect is the geographical distribution of households in need. Urban areas typically present a different landscape compared to rural regions. Urban centers may have a higher concentration of food support programs due to the population density, yet they also face challenges related to accessibility and competition for resources. In contrast, rural areas might have fewer resources available, leading to a different kind of struggle for those in need.
Regional Analysis
The map reveals notable regional differences in the percentage of households on income or food support. For instance, the southern United States often shows the highest percentages, with states like Mississippi and Louisiana frequently recording figures above 15%. These regions face systemic issues such as limited access to education and healthcare, which contribute to economic challenges.
Conversely, states in the Northeast, like New Hampshire and Massachusetts, typically exhibit lower percentages of households relying on assistance, often around 8% or less. These areas benefit from higher average incomes, better educational opportunities, and more significant investments in social services. Interestingly, even within states, urban areas may report higher reliance on food support than suburban or rural locales, showcasing the multifaceted nature of this issue.
In the West, states like California and Oregon show a mixed picture. While urban centers like Los Angeles and Portland have high support needs, more rural areas in these states might experience lower percentages, illustrating how local economies and job markets can differ dramatically within a single state.
Significance and Impact
Understanding the map of households on income or food support is vital for several reasons. Firstly, it highlights the urgent need for policy interventions aimed at reducing poverty and improving access to essential services. As the economy fluctuates and living costs rise, many households find themselves at risk of food insecurity. Programs that provide food assistance not only help families meet their basic nutritional needs but also have broader implications for public health and education.
Moreover, this map serves as a wake-up call regarding the ongoing economic disparities across regions. With rising costs of living and stagnant wages in many sectors, the future of income and food support programs is uncertain. Policymakers must consider innovative solutions to address these challenges, such as increasing the minimum wage, expanding access to education and job training, and ensuring that assistance programs are adequately funded.
As we look towards the future, it’s essential to monitor trends in household reliance on support. The COVID-19 pandemic has already shifted many economic paradigms, and the long-term effects on employment and assistance needs may redefine how we approach these issues moving forward. With continued advocacy and informed policymaking, there is hope that fewer households will need to rely on income and food support in the coming years.
Visualization Details
- Published
- October 18, 2025
- Views
- 36
Comments
Loading comments...