Life Expectancy in the United States Map

Marcus Rodriguez
Historical Geography Expert
Marcus Rodriguez specializes in historical cartography and geographic data analysis. With a background in both history and geography, he brings unique...
Geographic Analysis
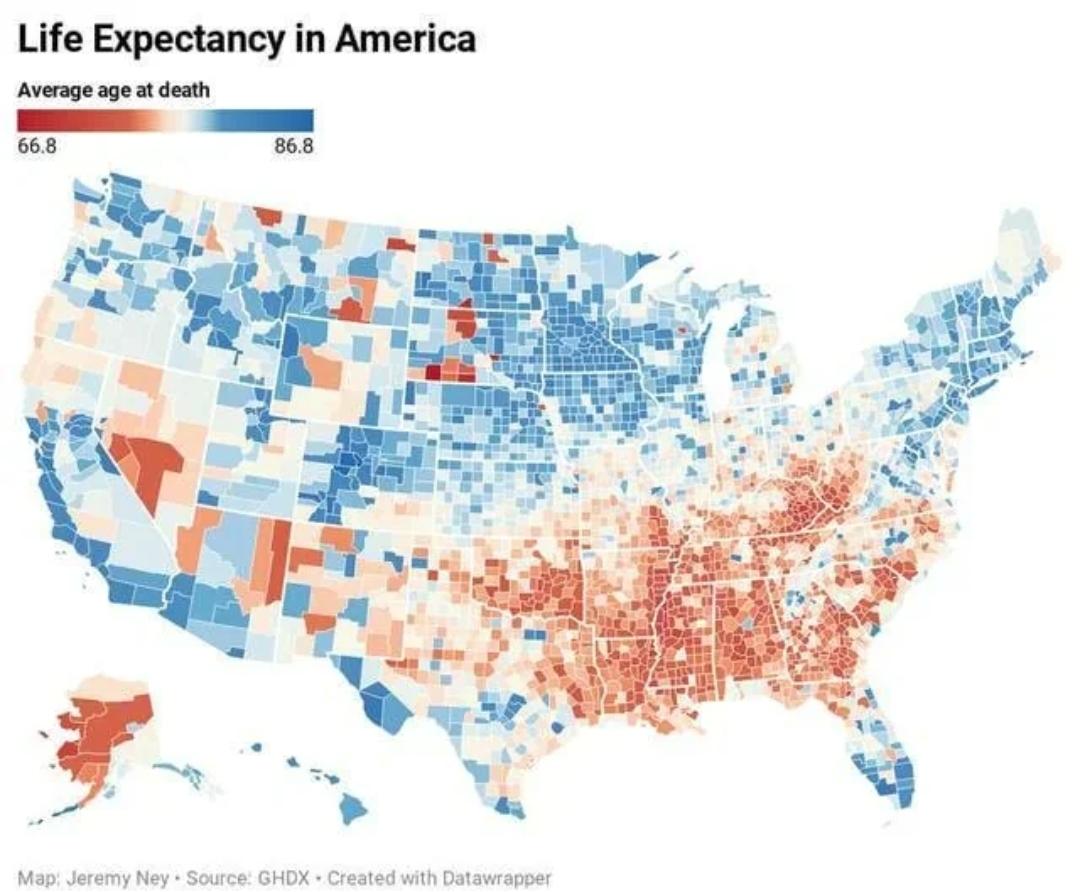
What This Map Shows
The "Life Expectancy in the United States Map" provides a visual representation of the average life expectancy across various regions in the country. This map illustrates how long individuals are expected to live based on statistical data, revealing significant variations across different states and communities. It’s not just a number; it reflects the overall health and wellbeing of populations, influenced by factors such as healthcare access, lifestyle choices, and socioeconomic conditions.
Deep Dive into Life Expectancy
Life expectancy is a crucial indicator of a population's health and quality of life. It is defined as the average number of years a newborn is expected to live if current mortality rates continue to apply. In the United States, life expectancy has seen substantial changes over the decades, often reflecting broader social, economic, and environmental trends.
Interestingly, the national average life expectancy in the U.S. has fluctuated recently, with a peak of around 78.8 years in 2019, which then decreased slightly due to various factors, including the COVID-19 pandemic. The reasons behind these fluctuations are multifaceted, often tied to healthcare access, lifestyle diseases, and other social determinants of health.
For example, states with robust healthcare systems, like Massachusetts and Hawaii, typically showcase higher life expectancies, often exceeding 80 years. In contrast, states like Mississippi and West Virginia struggle with lower life expectancies, sometimes dropping below 75 years. This disparity raises questions: What are the underlying causes of these differences?
One major factor is access to healthcare. States with expanded Medicaid and comprehensive healthcare services tend to have higher life expectancies. Chronic diseases such as obesity, diabetes, and heart disease also play significant roles. Notably, the prevalence of these conditions can often be traced back to lifestyle choices and socioeconomic factors, including education and income levels.
Moreover, environmental factors, such as pollution and access to clean water, further influence health outcomes. Regions with high pollution levels may see increased rates of respiratory diseases, significantly affecting life expectancy.
Furthermore, based on the latest data, life expectancy is also influenced by race and ethnicity. White Americans tend to have a higher life expectancy compared to African Americans and Hispanic populations, reflecting broader systemic inequalities in health access and quality of care.
Regional Analysis
When breaking down the map by region, distinct patterns emerge. In the Northeast, states like New York and New Jersey showcase higher life expectancies, often attributed to better healthcare infrastructures and higher median incomes. In contrast, the Southern states present a mixed bag. While states like Florida enjoy a reputation for high life expectancy due to a large retiree population, others like Alabama and Louisiana lag behind, grappling with higher rates of poverty and chronic illness.
Moving to the Midwest, states such as Minnesota and Wisconsin report some of the highest life expectancies in the country, often linked to strong public health initiatives and a focus on preventive care. Conversely, areas in the Appalachian region, including parts of Kentucky and West Virginia, struggle with health disparities rooted in economic challenges and limited access to healthcare services.
Interestingly, even within states, there can be significant variations. Urban areas often report higher life expectancies compared to rural areas, primarily due to differences in healthcare access, lifestyle, and educational opportunities. For instance, in Texas, urban residents in cities like Austin enjoy higher life expectancies compared to rural populations, who may face barriers to healthcare.
Significance and Impact
Understanding life expectancy is more than just analyzing a number; it has real-world implications for public health policy and resource allocation. Policymakers can use this data to identify areas in need of urgent intervention, focusing on improving healthcare access, promoting healthier lifestyles, and addressing social determinants of health.
Current trends indicate that life expectancy is not just a static measure; it evolves with societal changes. For instance, the impact of the COVID-19 pandemic revealed vulnerabilities in the healthcare system, leading to a reconsideration of health policies and priorities. As we move forward, it will be crucial to address these disparities and work towards a more equitable healthcare system that can improve life expectancy across all demographics.
In conclusion, the "Life Expectancy in the United States Map" serves as a vital tool for understanding public health trends and challenges. By examining the variations across regions, we can gain insights into the underlying factors that contribute to health outcomes, ultimately guiding efforts to enhance the quality of life for all Americans.
Visualization Details
- Published
- October 11, 2025
- Views
- 72
Comments
Loading comments...