socioeconomic factors Maps
20 geographic visualizations tagged with "socioeconomic factors"
Map of Households in USA with Air Conditioners
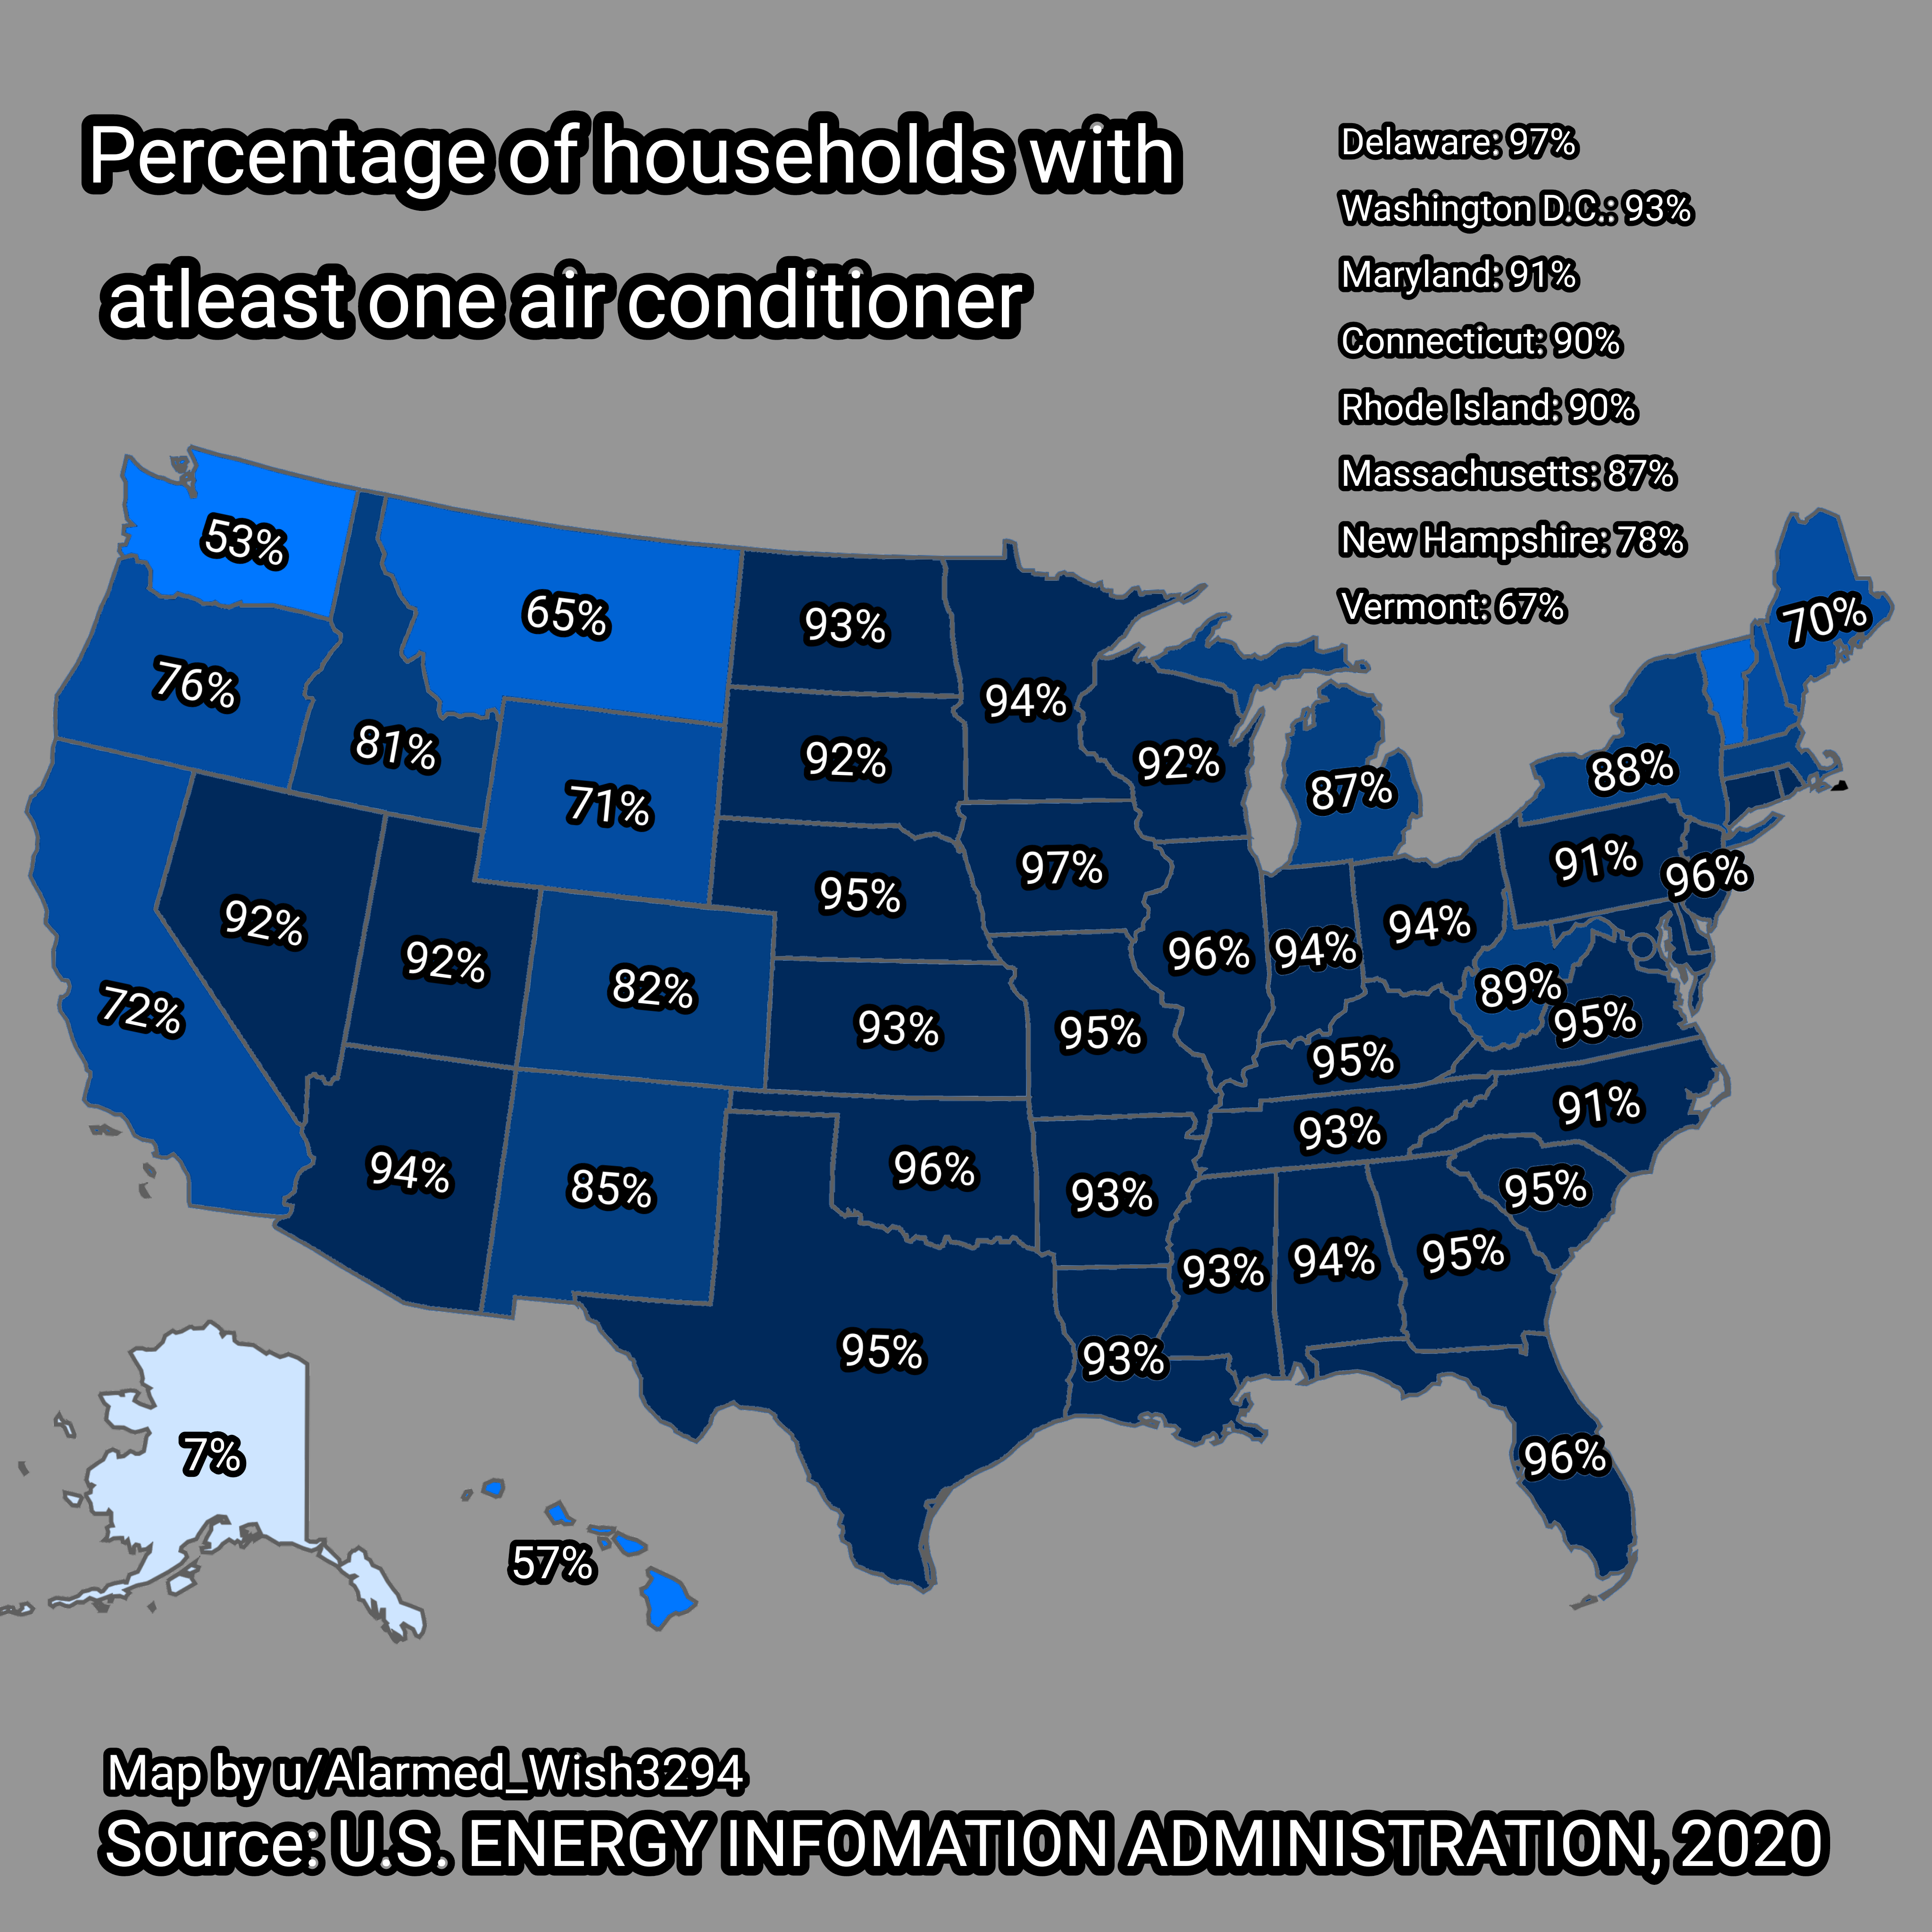
The visualization titled "Percent of Households in USA with at least One Air Conditioner" provides a clear overview of t...
Correlation Map of Socioeconomic Factors
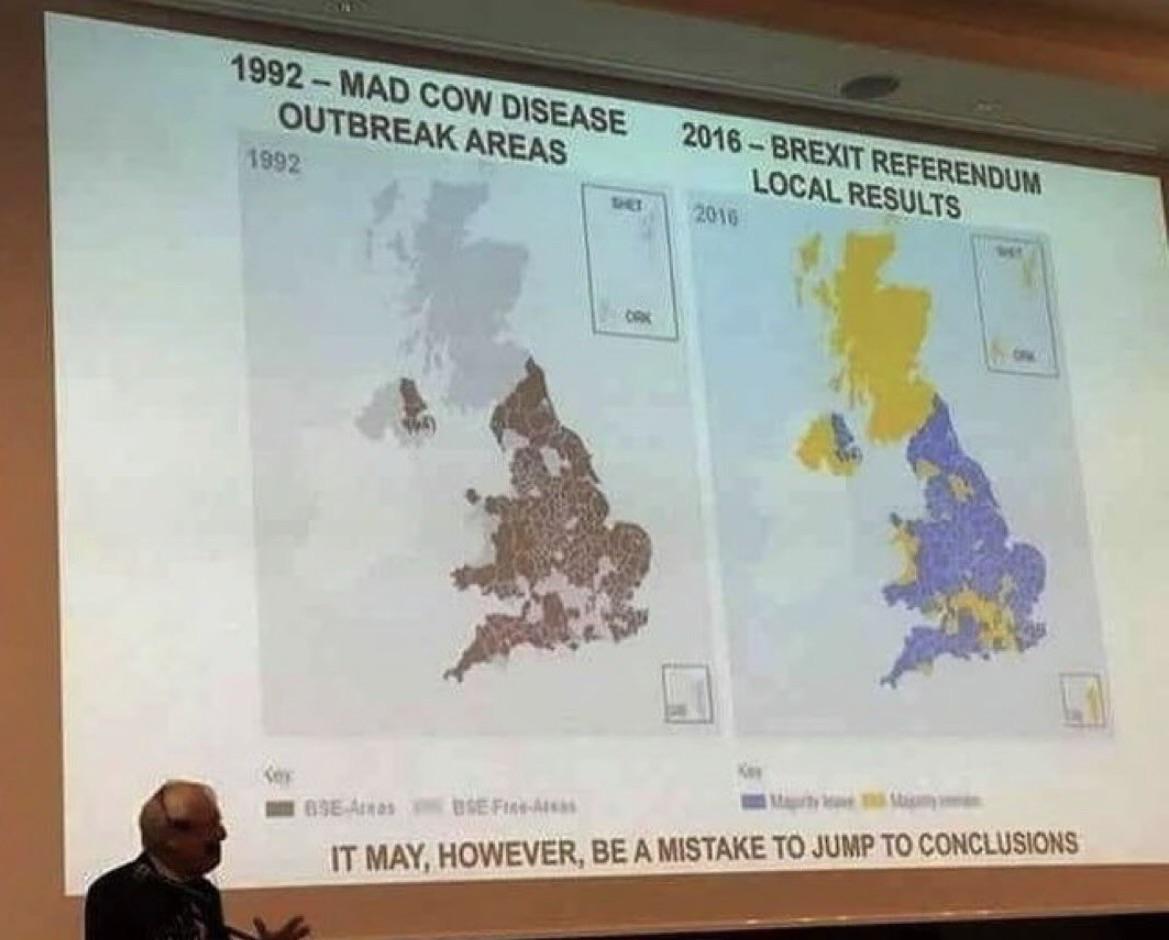
The "Correlation" map provides a visual representation of the relationships between various socioeconomic factors across...
2024 Election Results Map Amongst White Voters
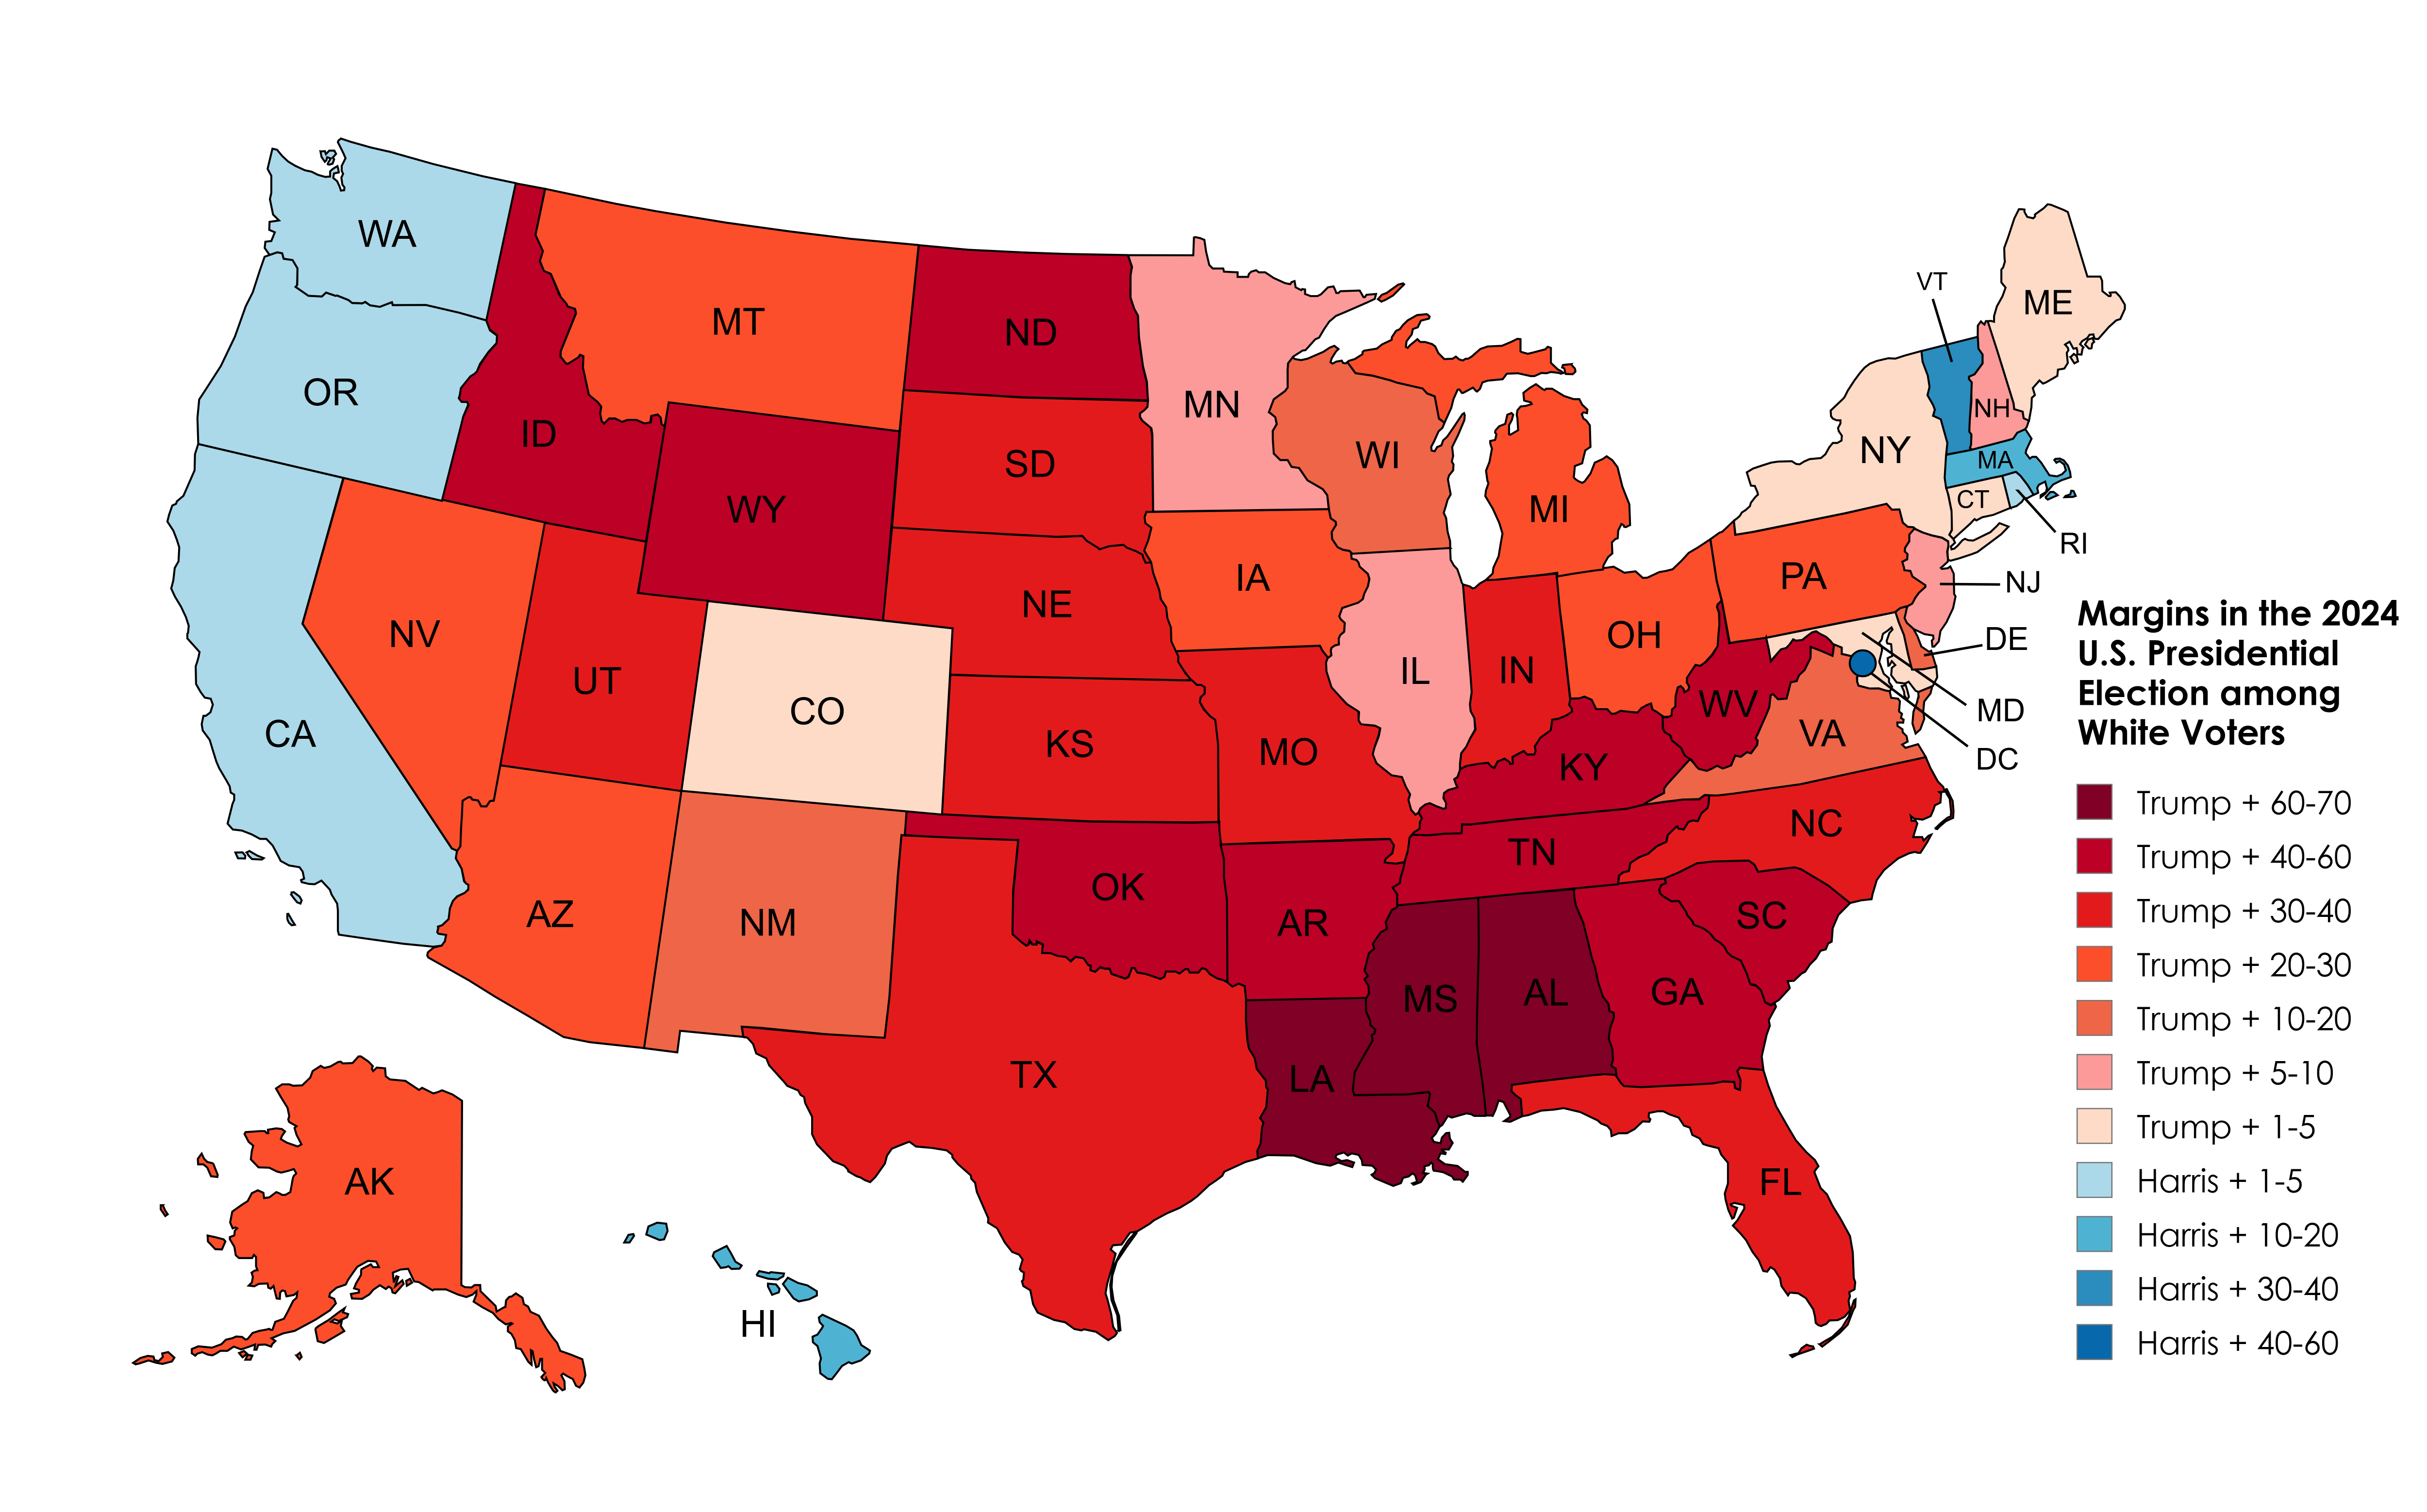
The 2024 Election Results Map Amongst White Voters offers a detailed representation of how this demographic voted across...
Marriage Age in the U.S. Map
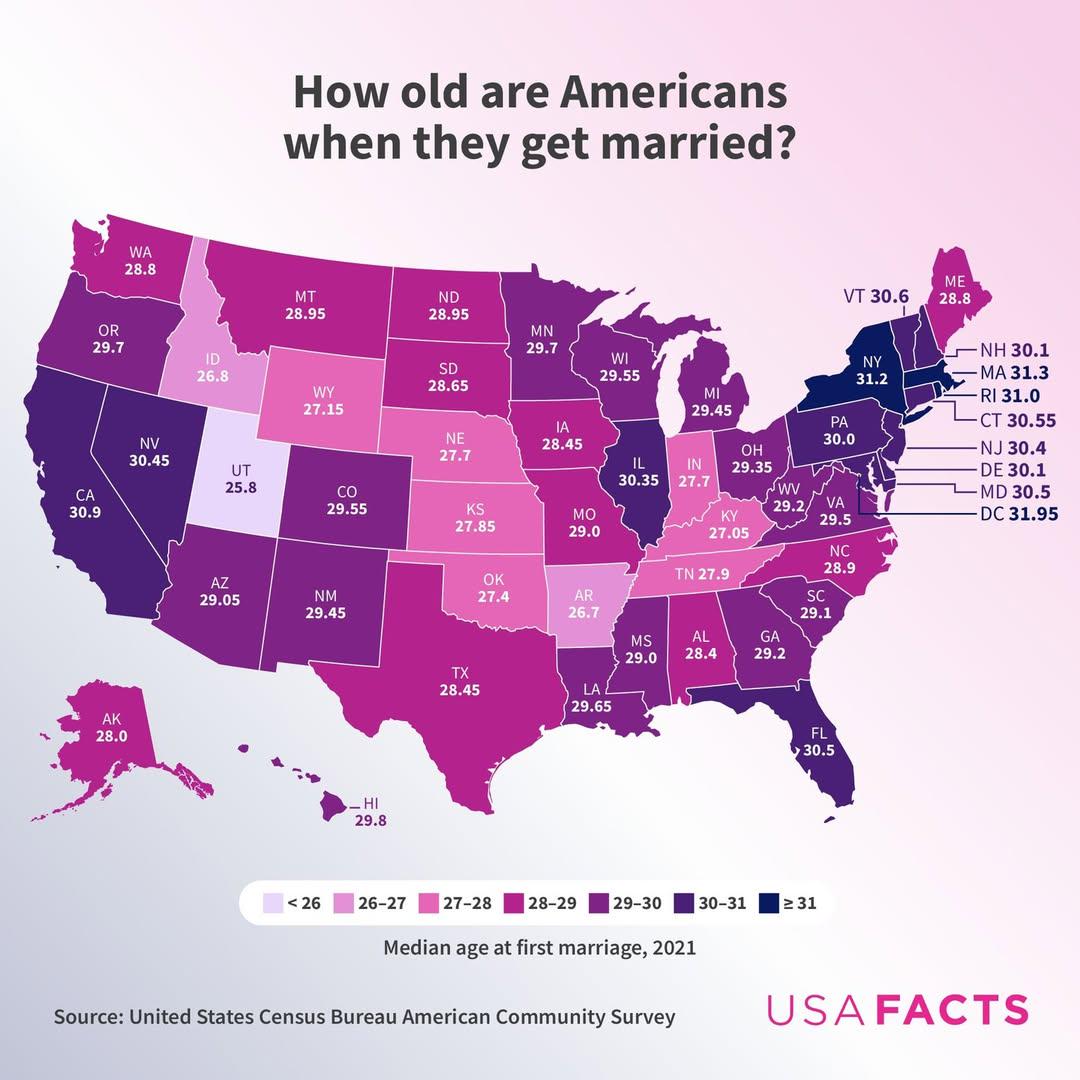
This visualization provides a clear representation of the average age at which Americans first marry across various stat...
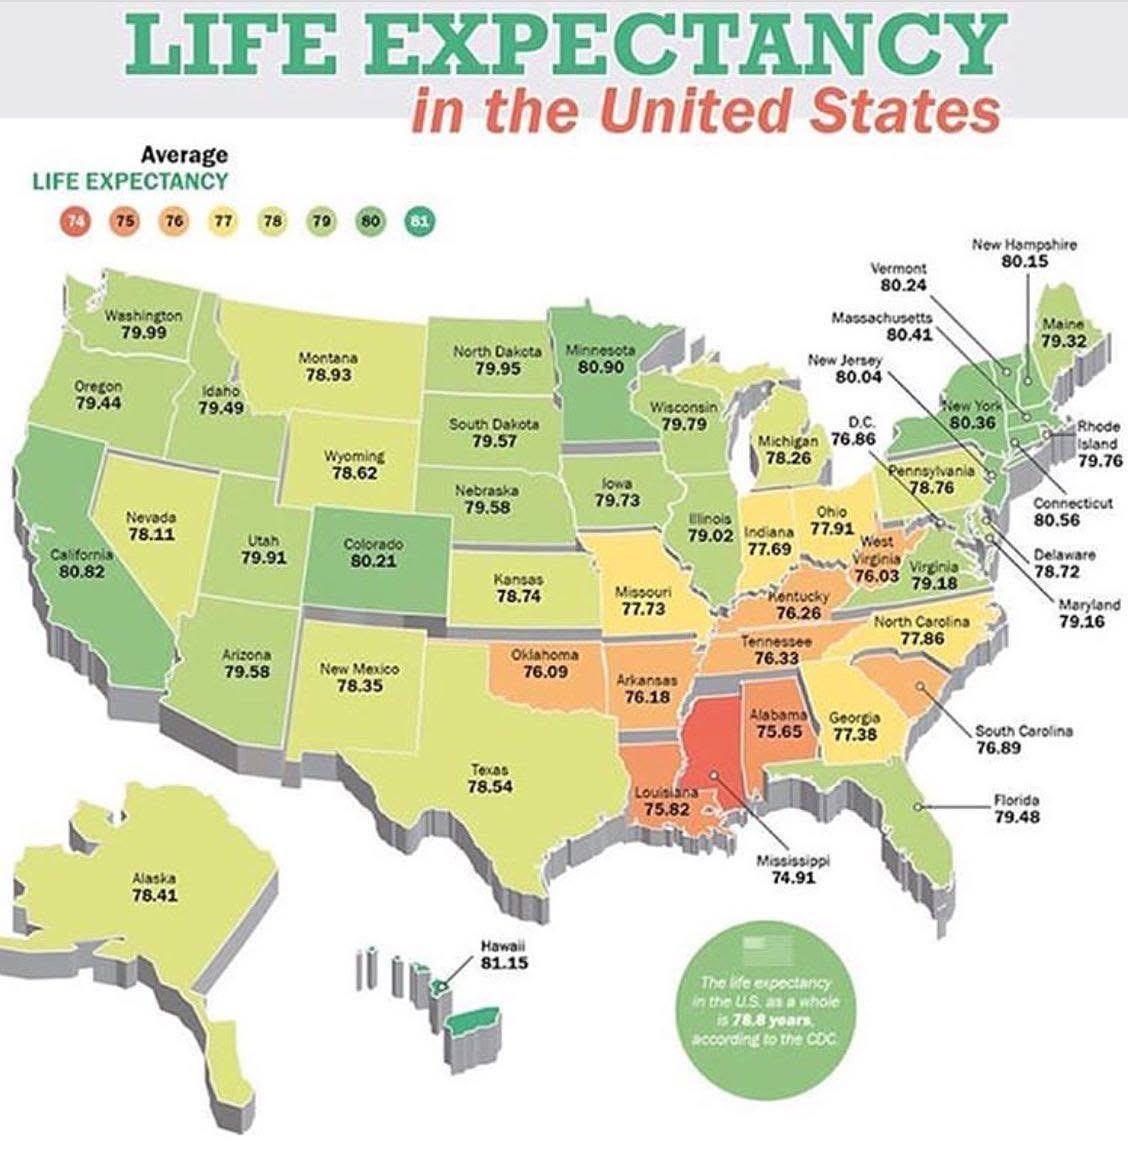
Life Expectancy by State in the USA Map
The \...
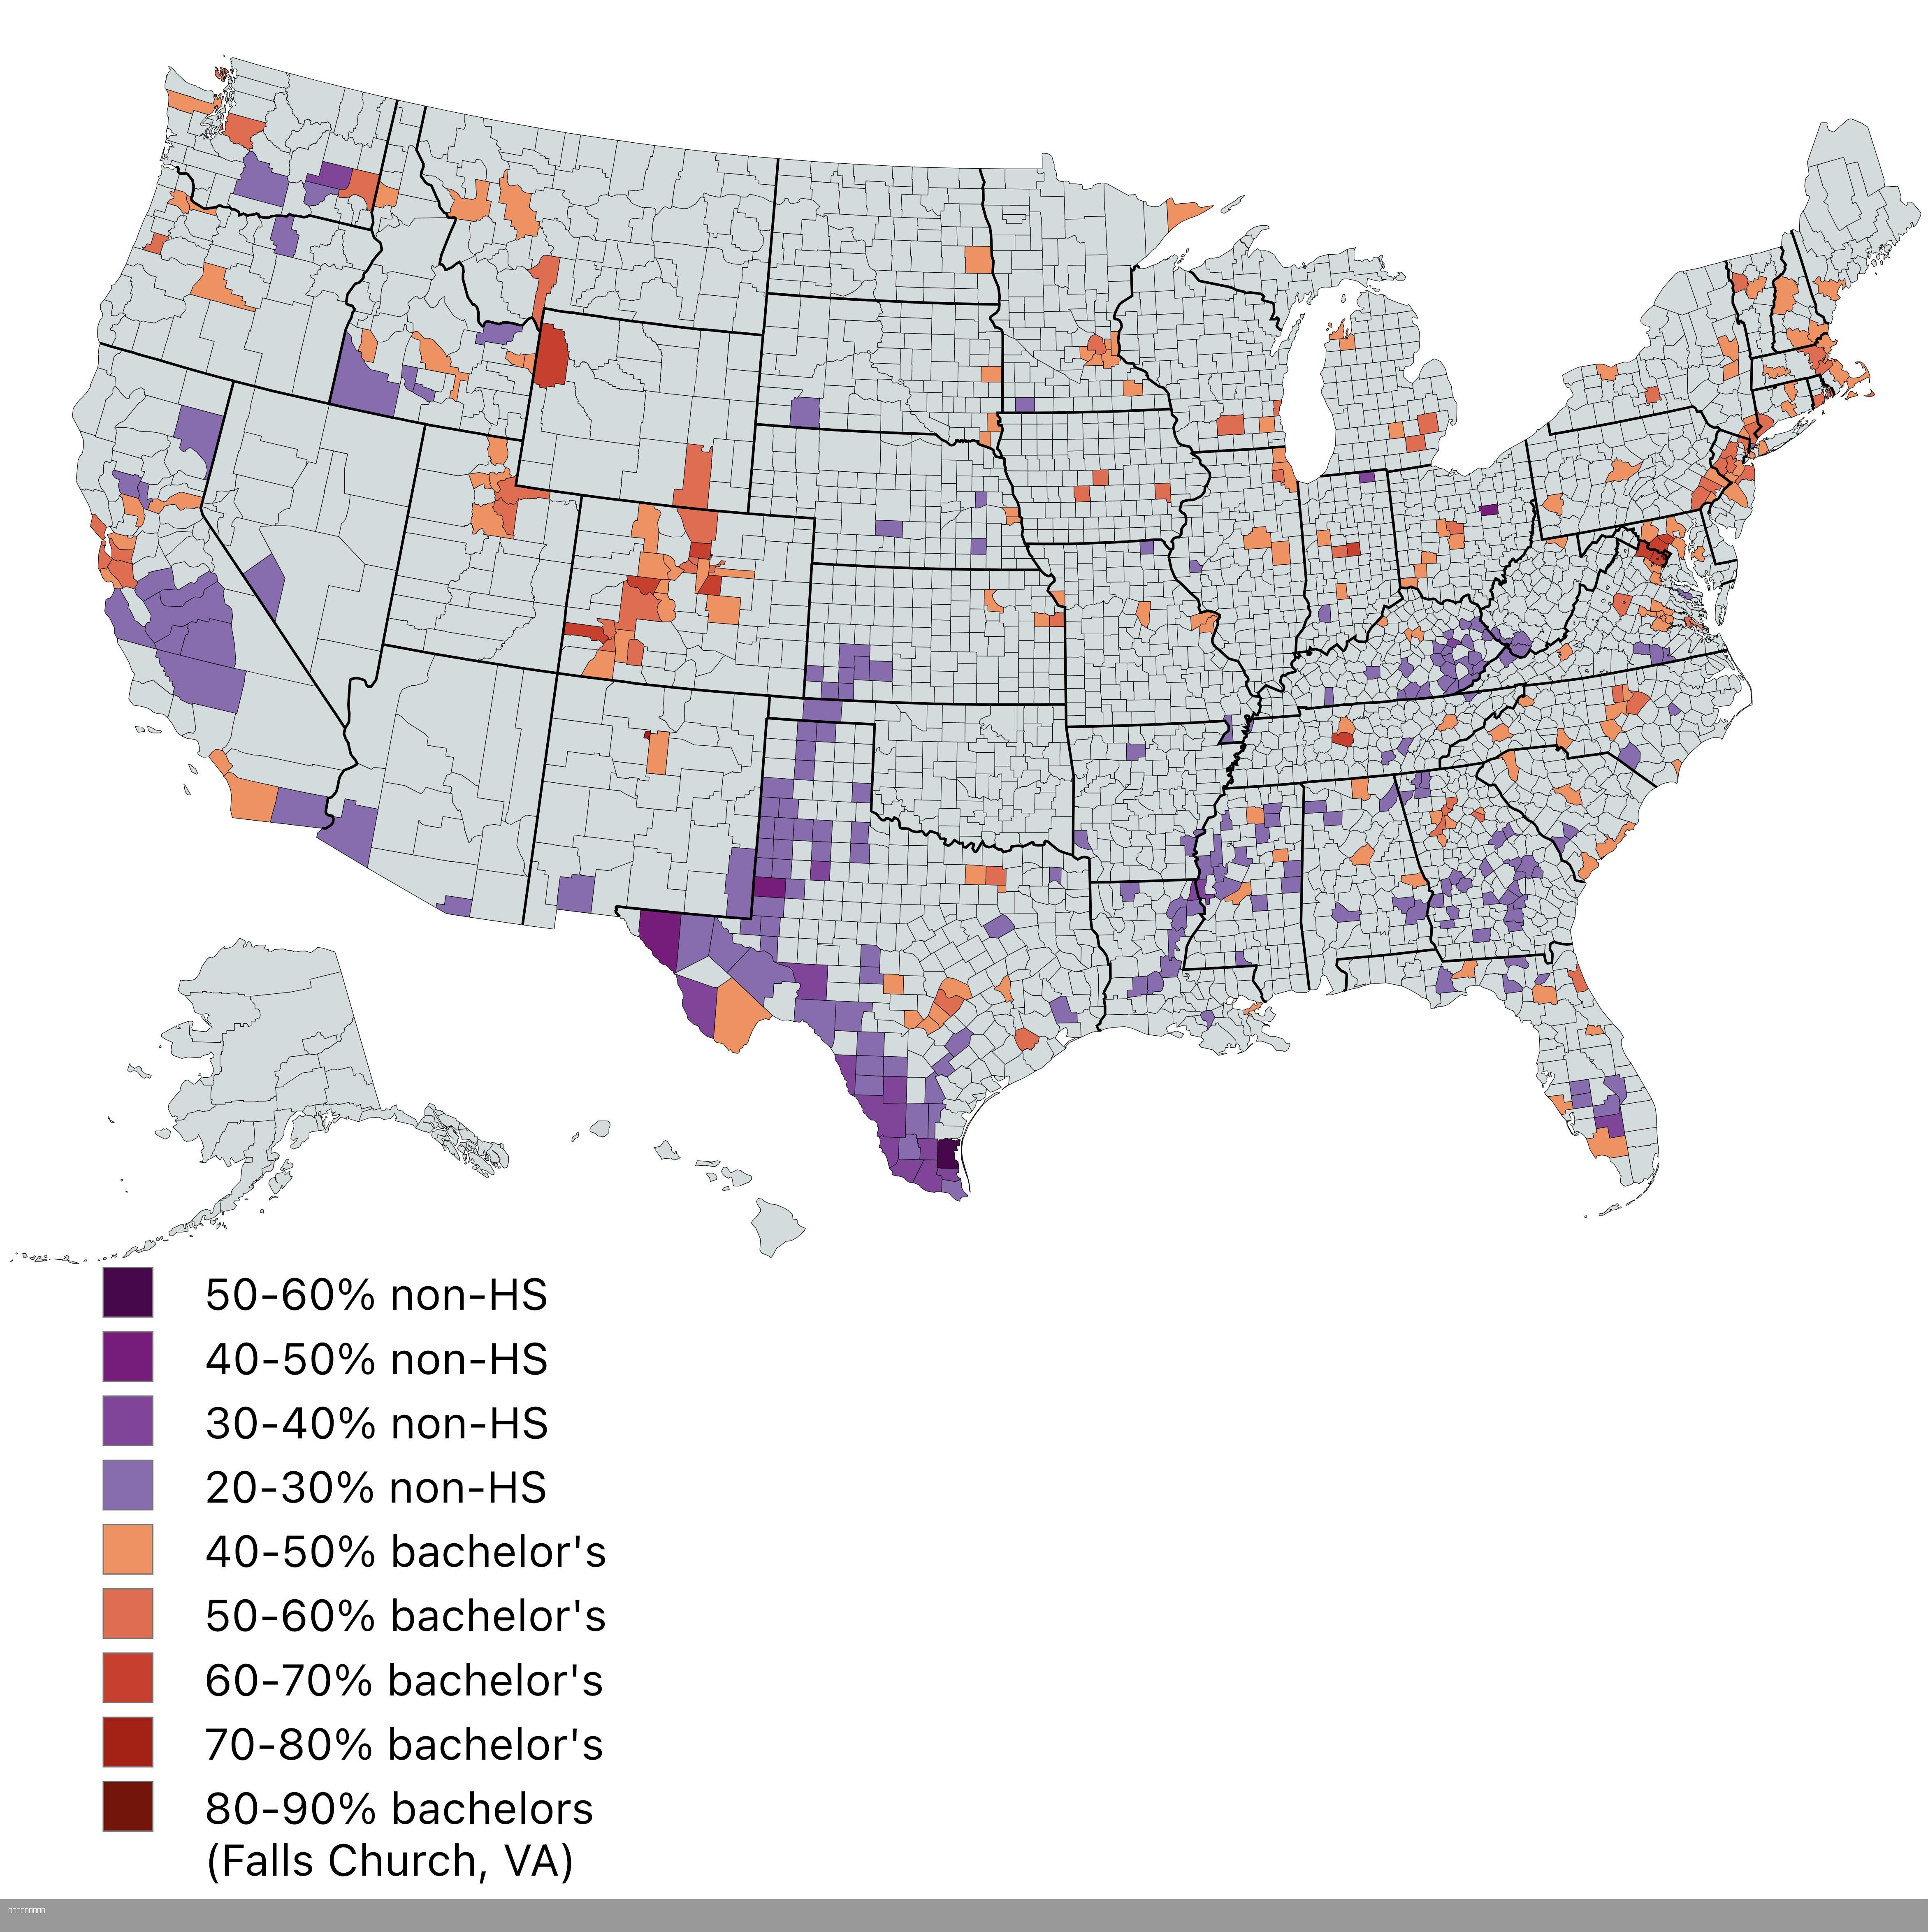
Map of Most and Least Educated US Counties
This map presents a striking contrast between the most and least educated counties in the United States, showcasing area...
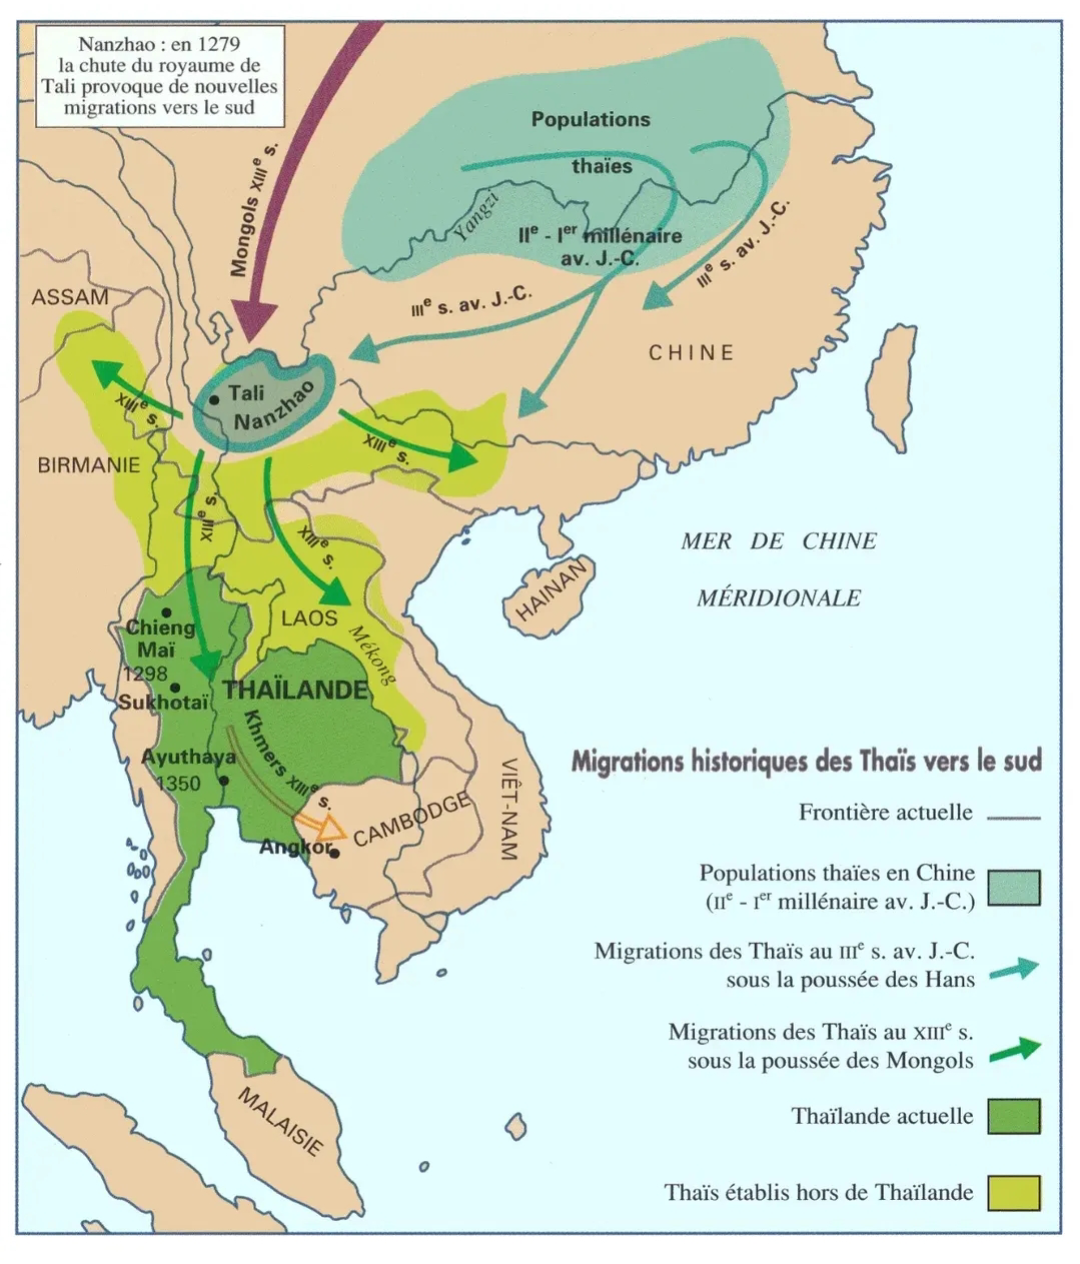
Migration of Thai People to the South Map
This map illustrates the migration patterns of the Thai people towards the southern regions of Thailand. It highlights k...
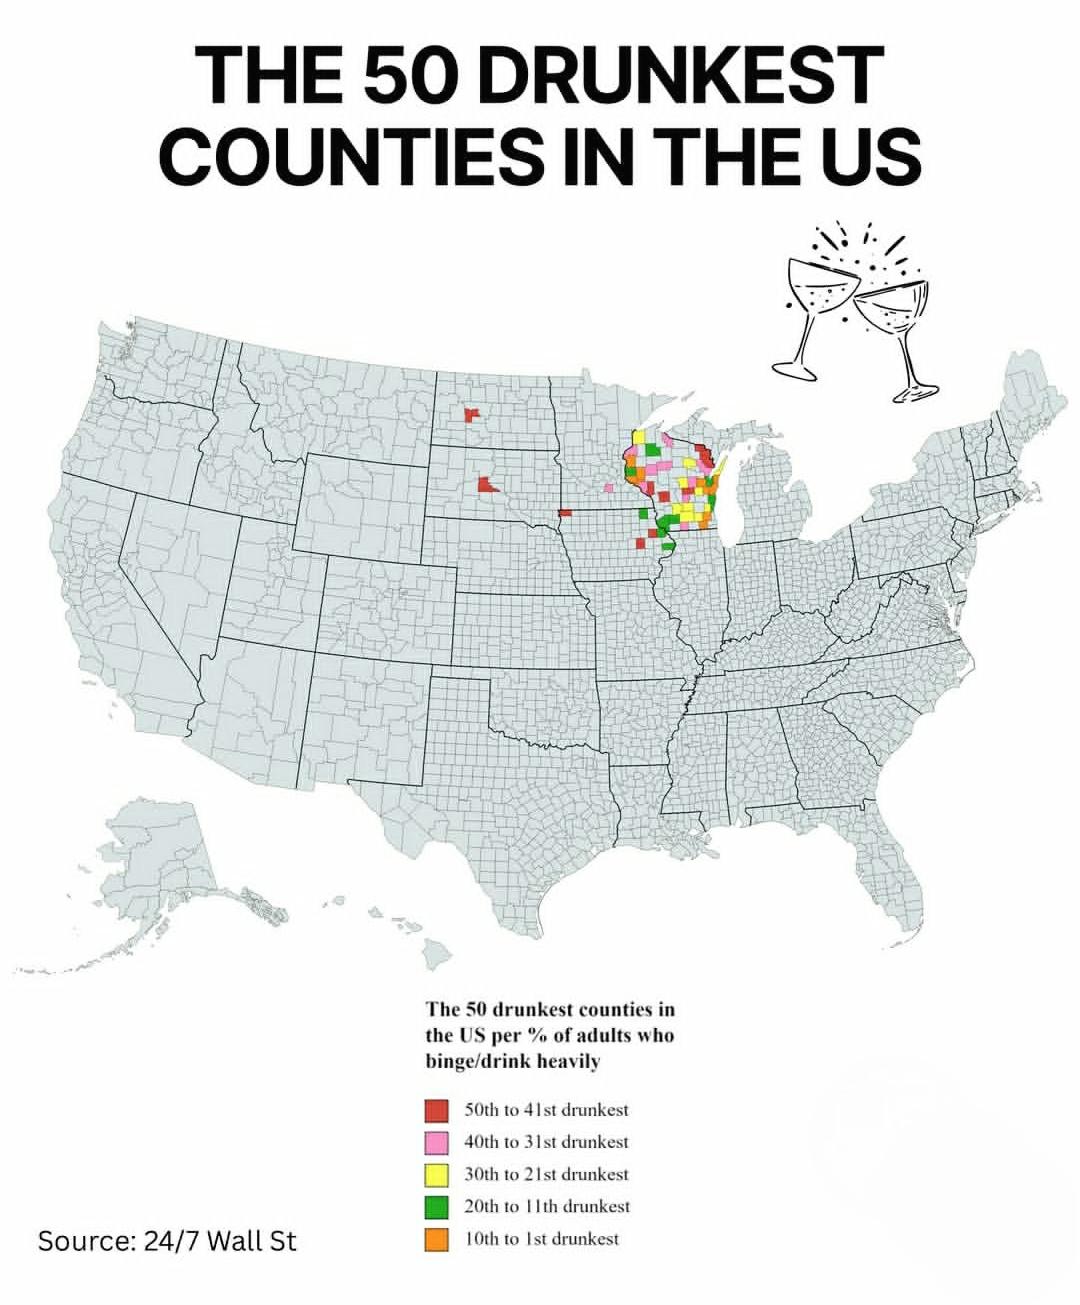
Drunkest Counties in the US Map
The "Drunkest Counties in the US" map provides a stark visual representation of alcohol consumption patterns across vari...

Children's Health Rankings by State Map
The "Best and Worst US States in Children's Health" map provides a comprehensive overview of the varying health outcomes...
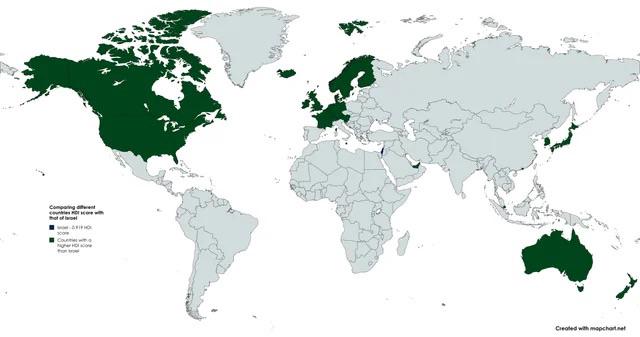
Countries with Higher HDI than Israel Map
The "Countries with Higher HDI than Israel Map" presents a visual representation of nations that boast a higher Human De...
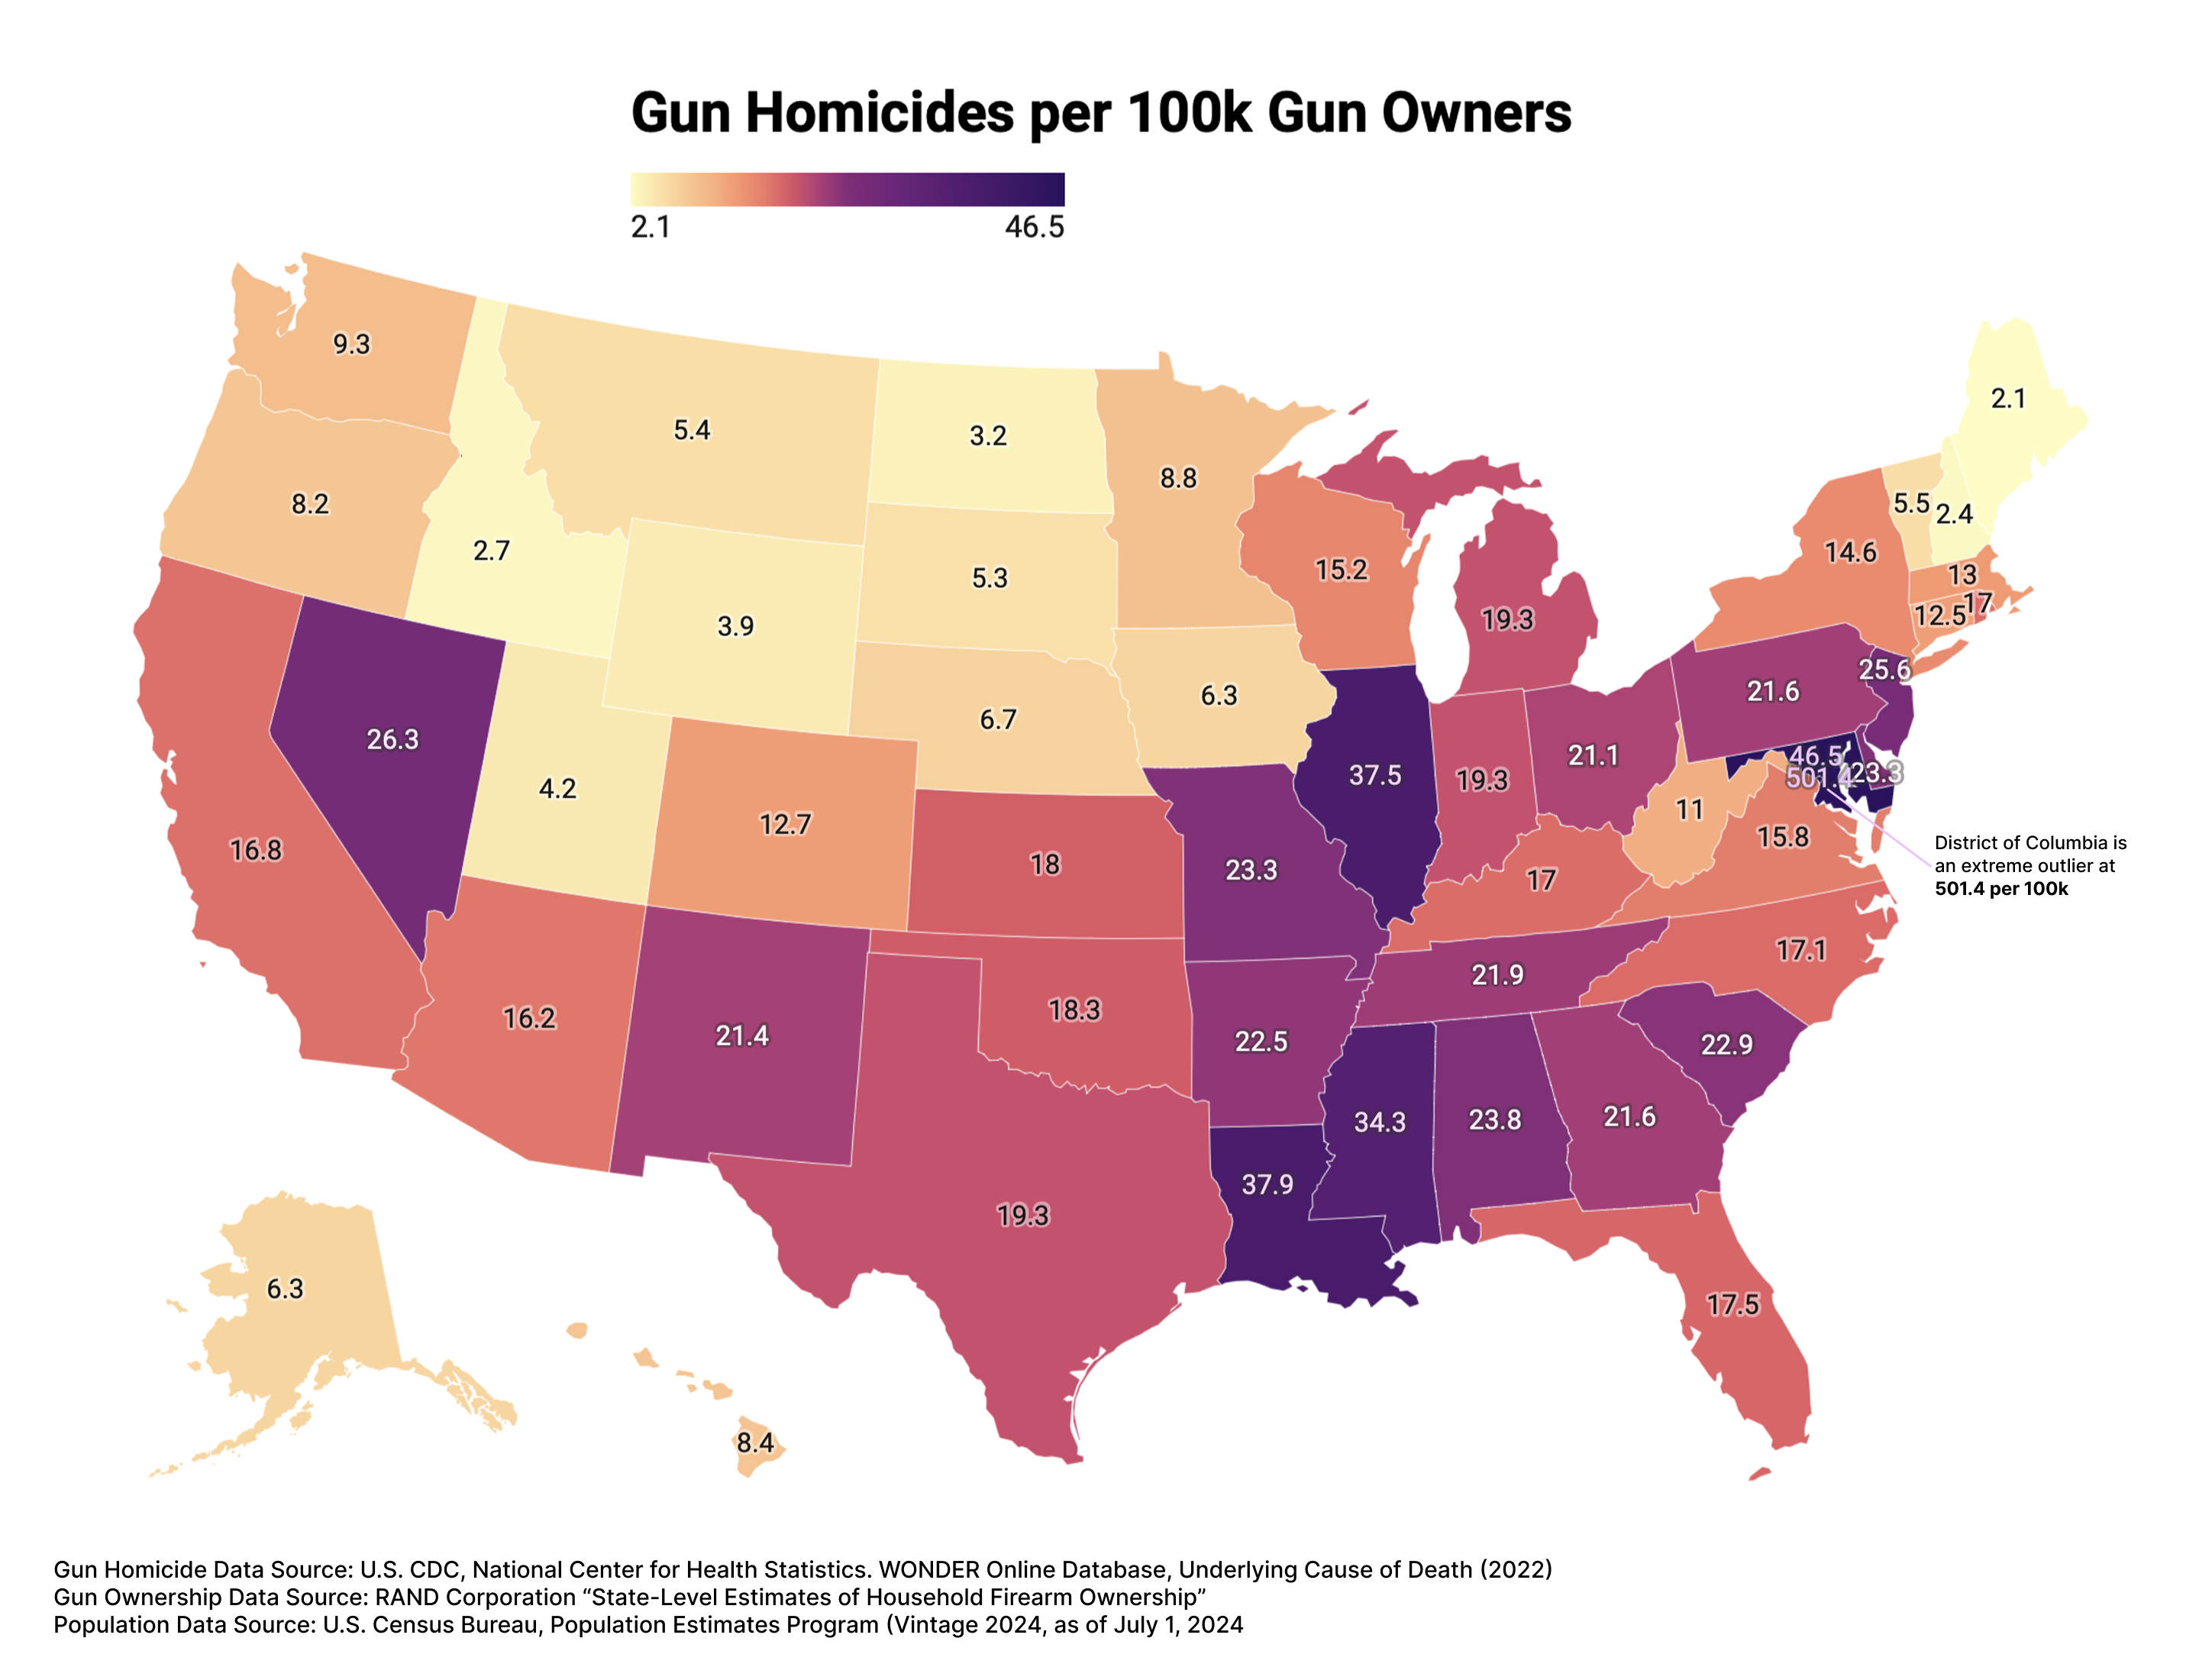
Gun Homicides per 100k Gun Owners Map
The "Gun Homicides per 100k Gun Owners" map provides a stark visualization of gun-related homicides across various regio...
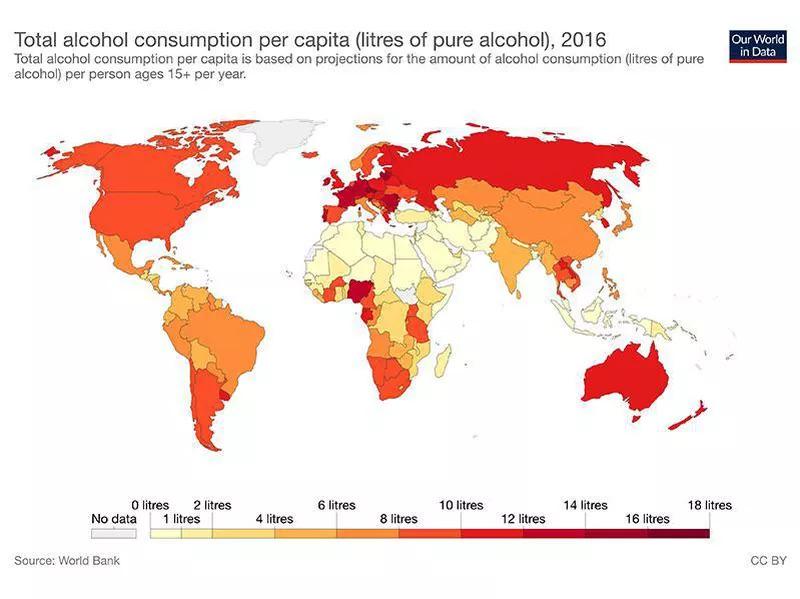
Total Alcohol Consumption Per Capita Map
The "Total Alcohol Consumption Per Capita Map" visually represents the average alcohol consumption in liters per person ...
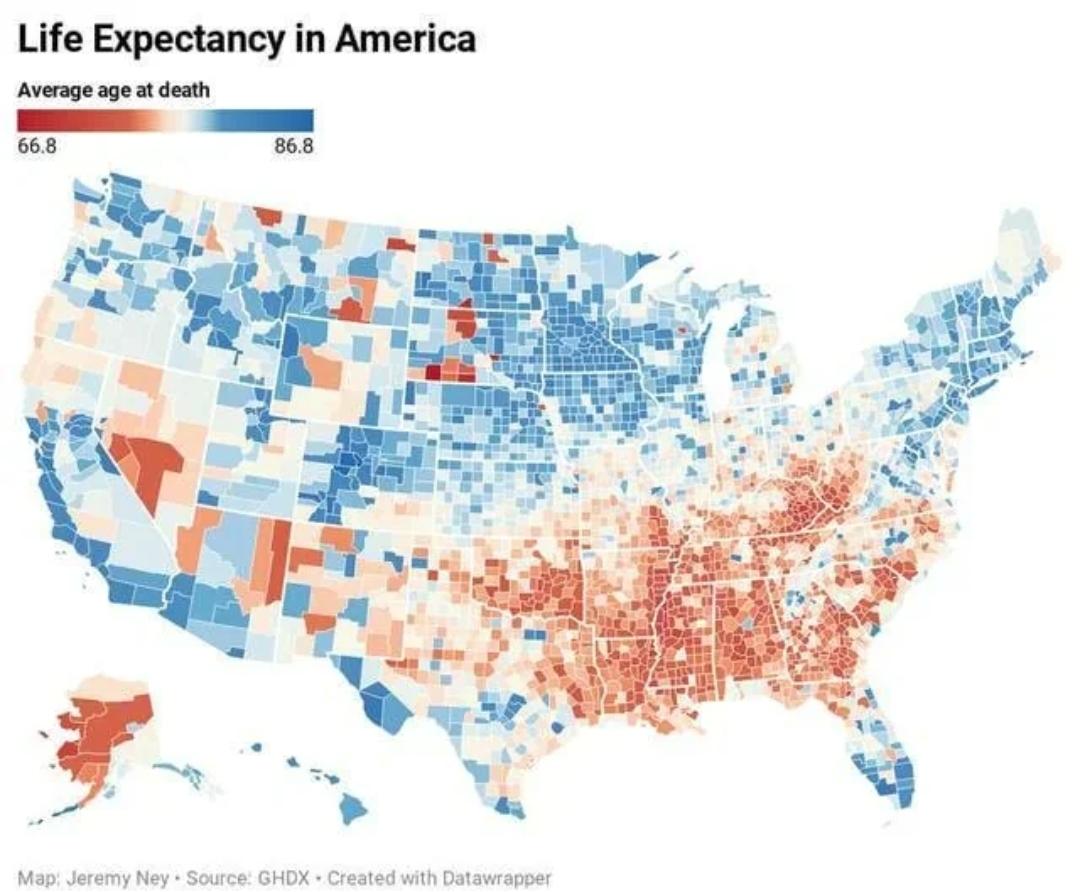
Life Expectancy in the United States Map
The "Life Expectancy in the United States Map" provides a visual representation of the average life expectancy across va...

Violent Crime Rates by U.S. State Map
The "Violent Crime Rates by U.S. State" map provides a clear visualization of the varying levels of violent crime across...

Power Outages by State Map
This map illustrates the frequency and duration of power outages experienced by customers across various U.S. states. By...
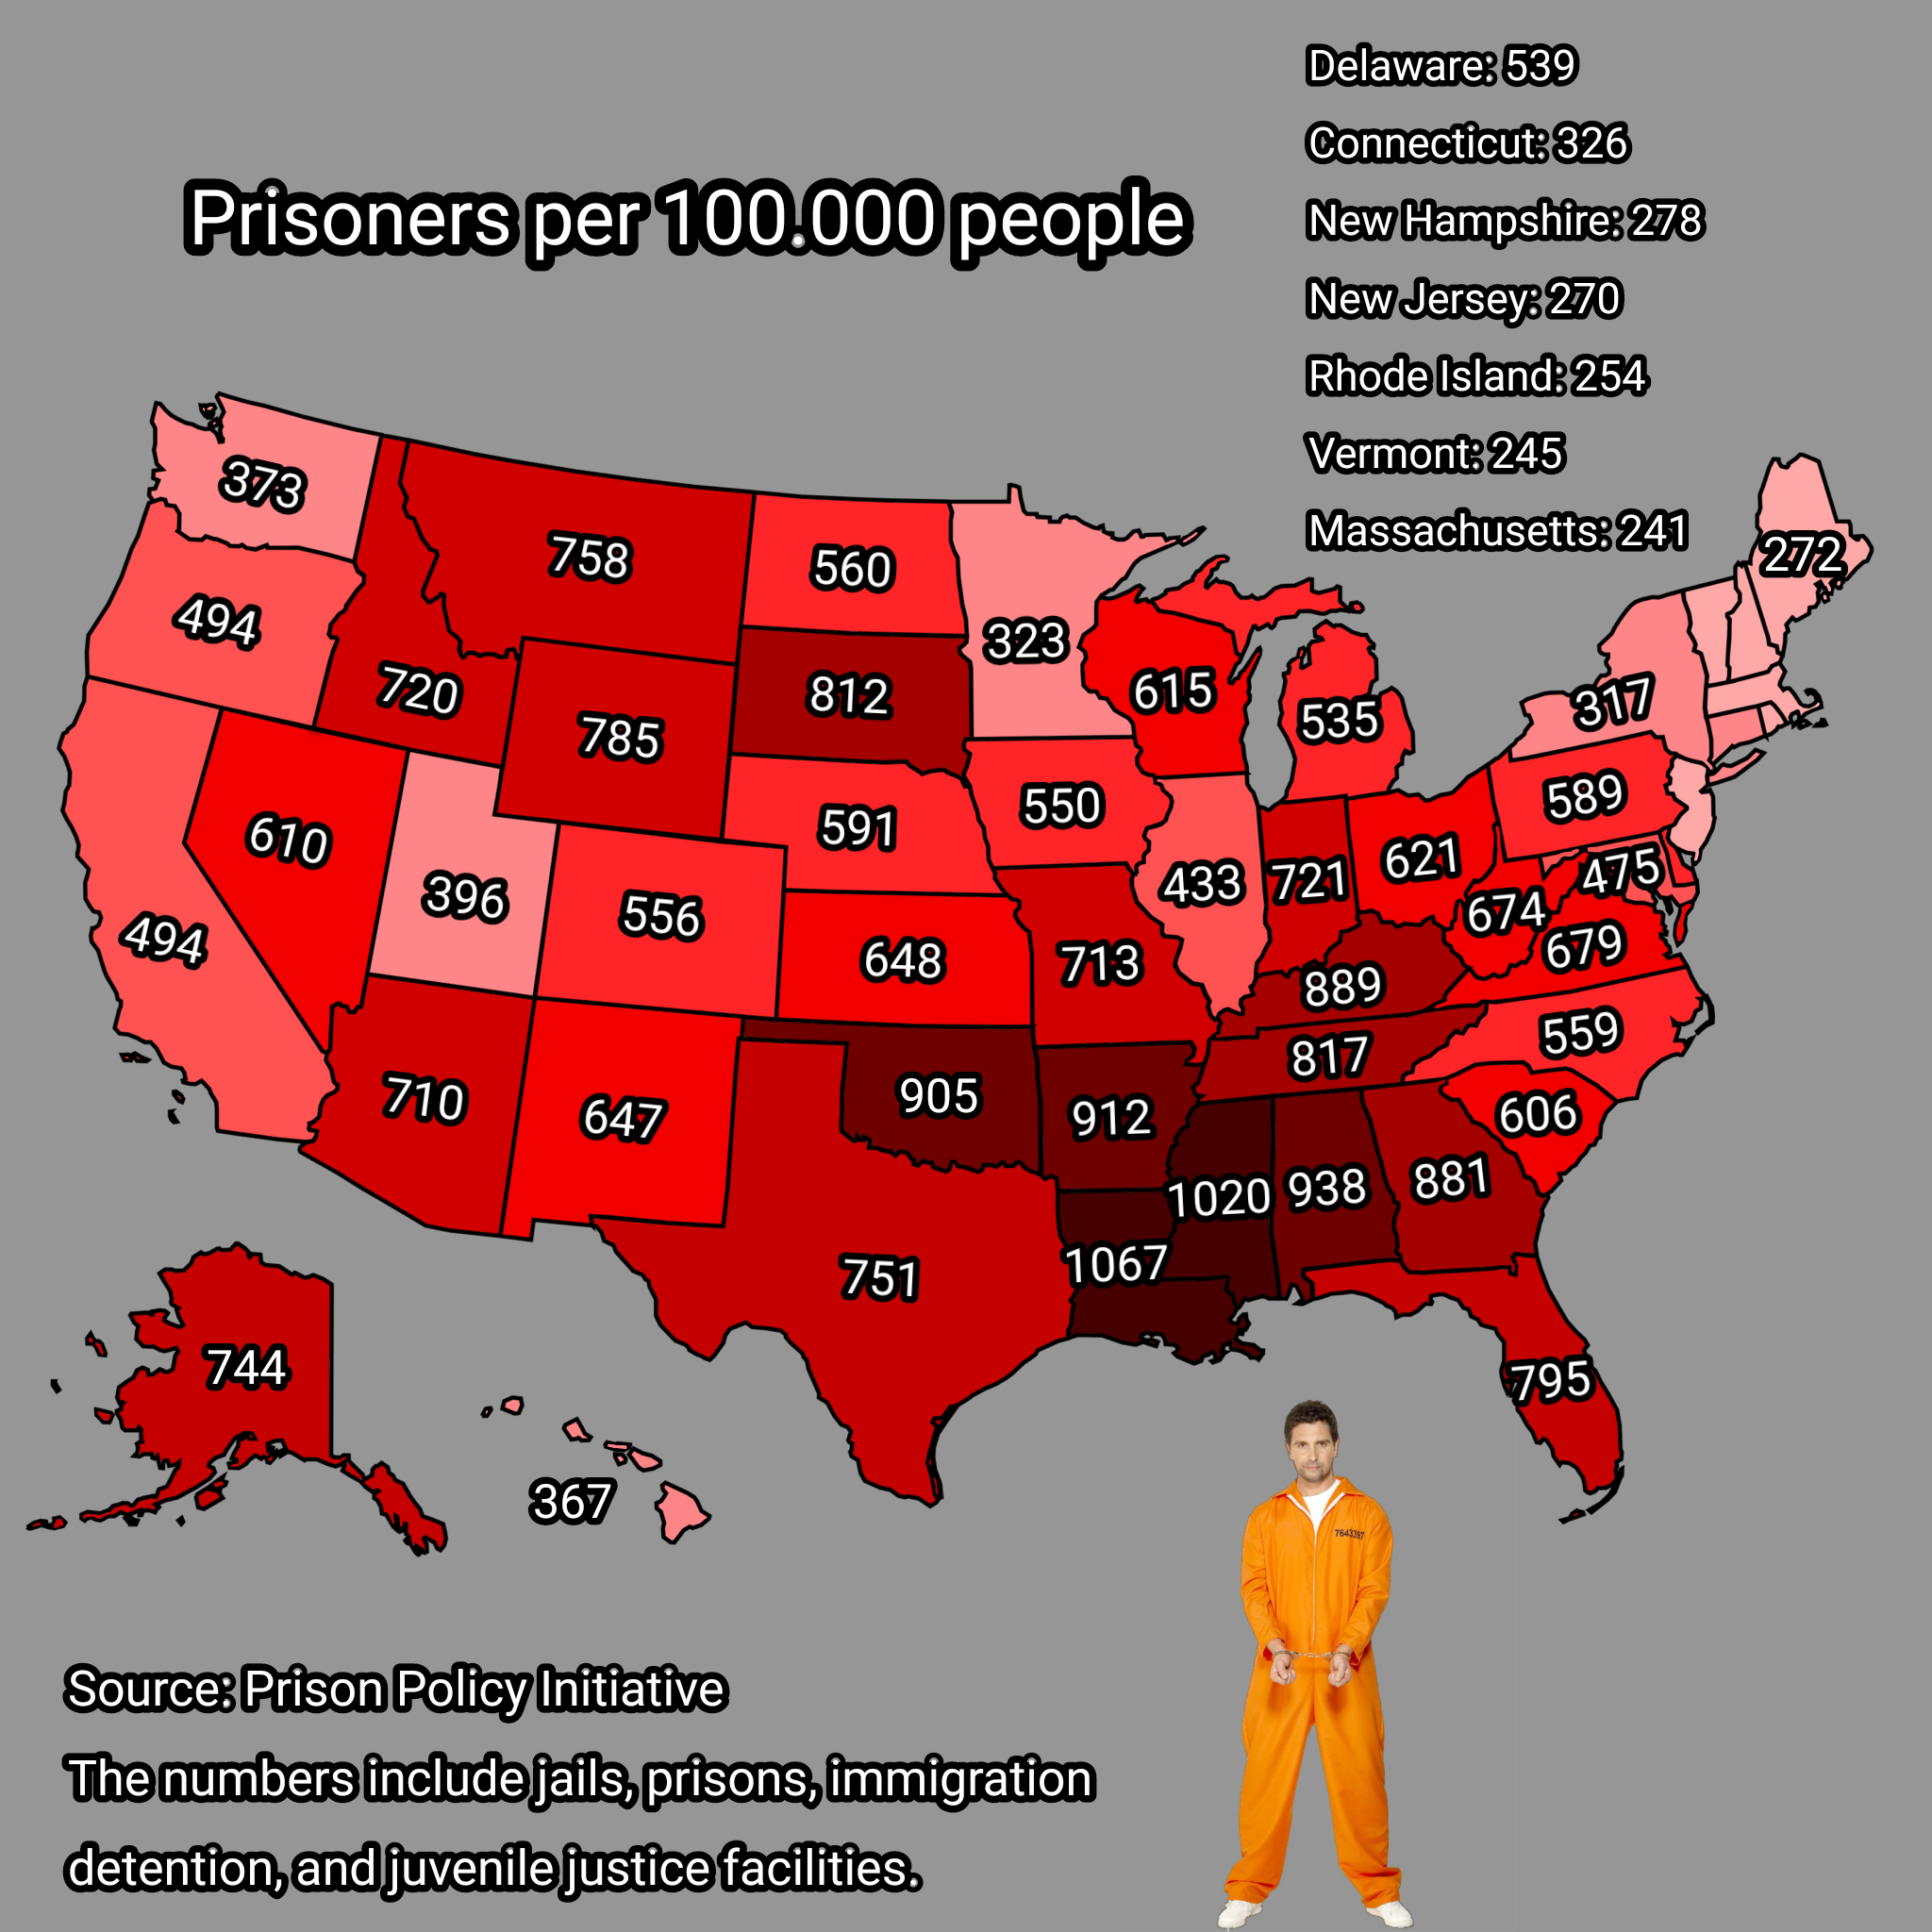
Prisoners per 100,000 People in USA Map
This map illustrates the number of prisoners per 100,000 people across various states in the United States. It provides ...
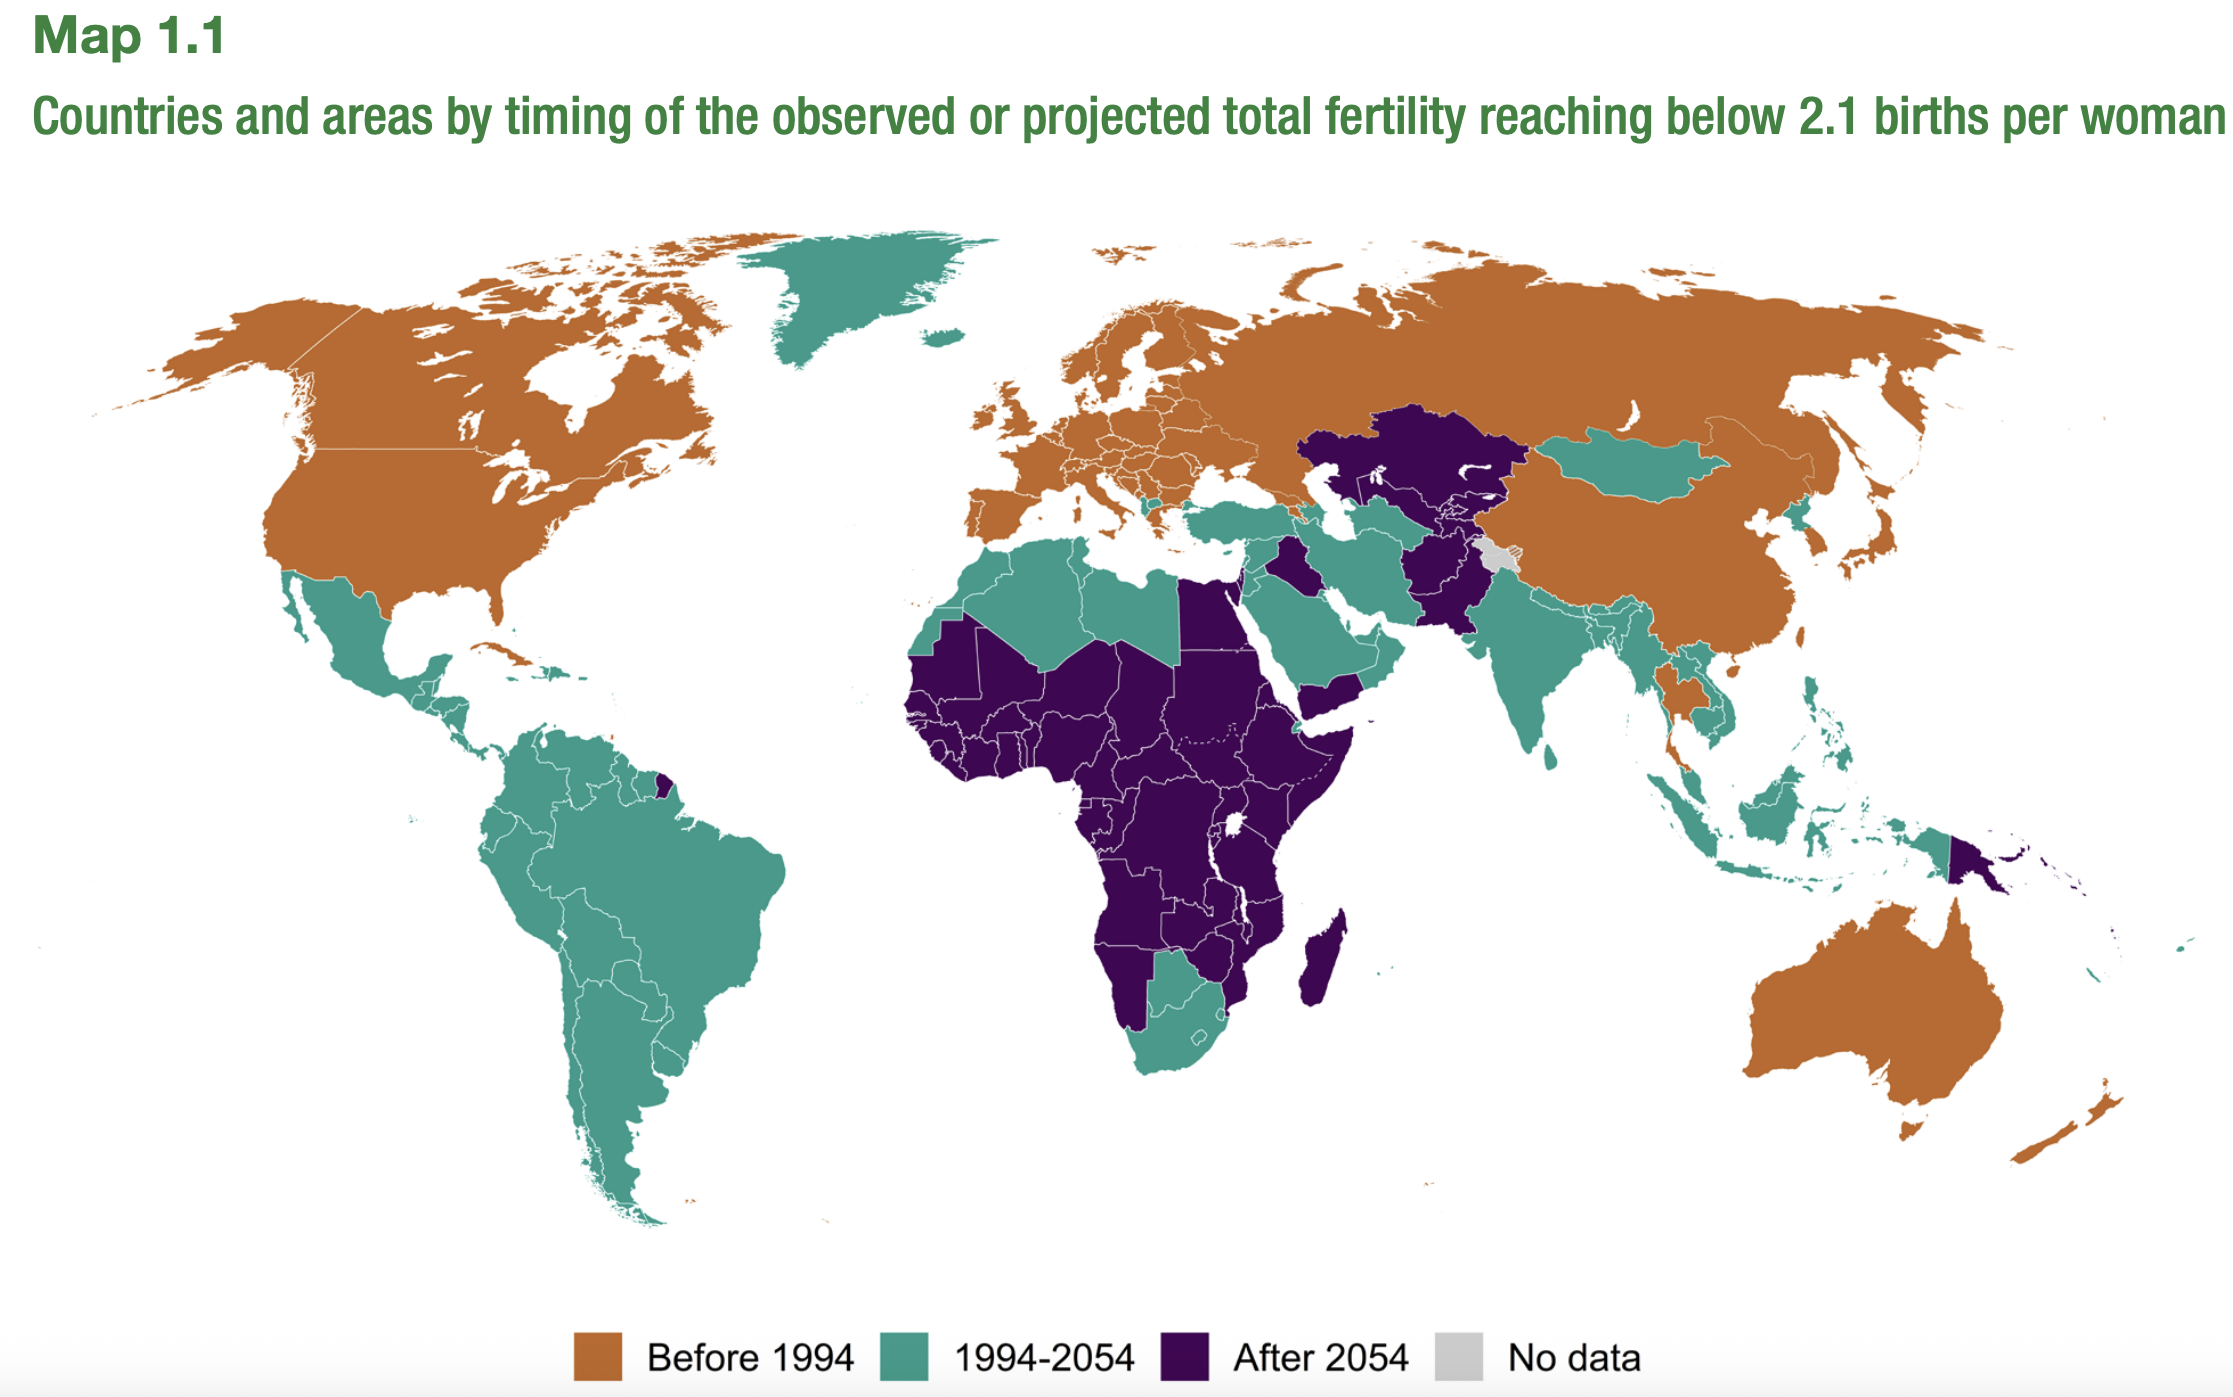
Fertility Rate Decline by Country Map
The visualization titled "Countries and areas by timing of the observed or projected total fertility reaching below the ...
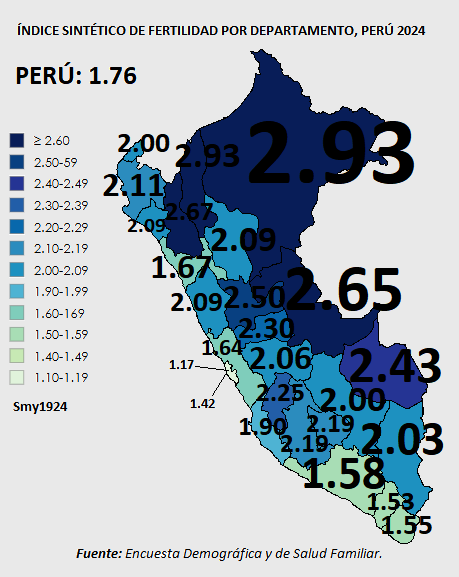
Total Fertility Rate Map of Peru 2024
The map titled "Total Fertility Rate (Children per Woman), Perú 2024" provides a visual representation of the average nu...
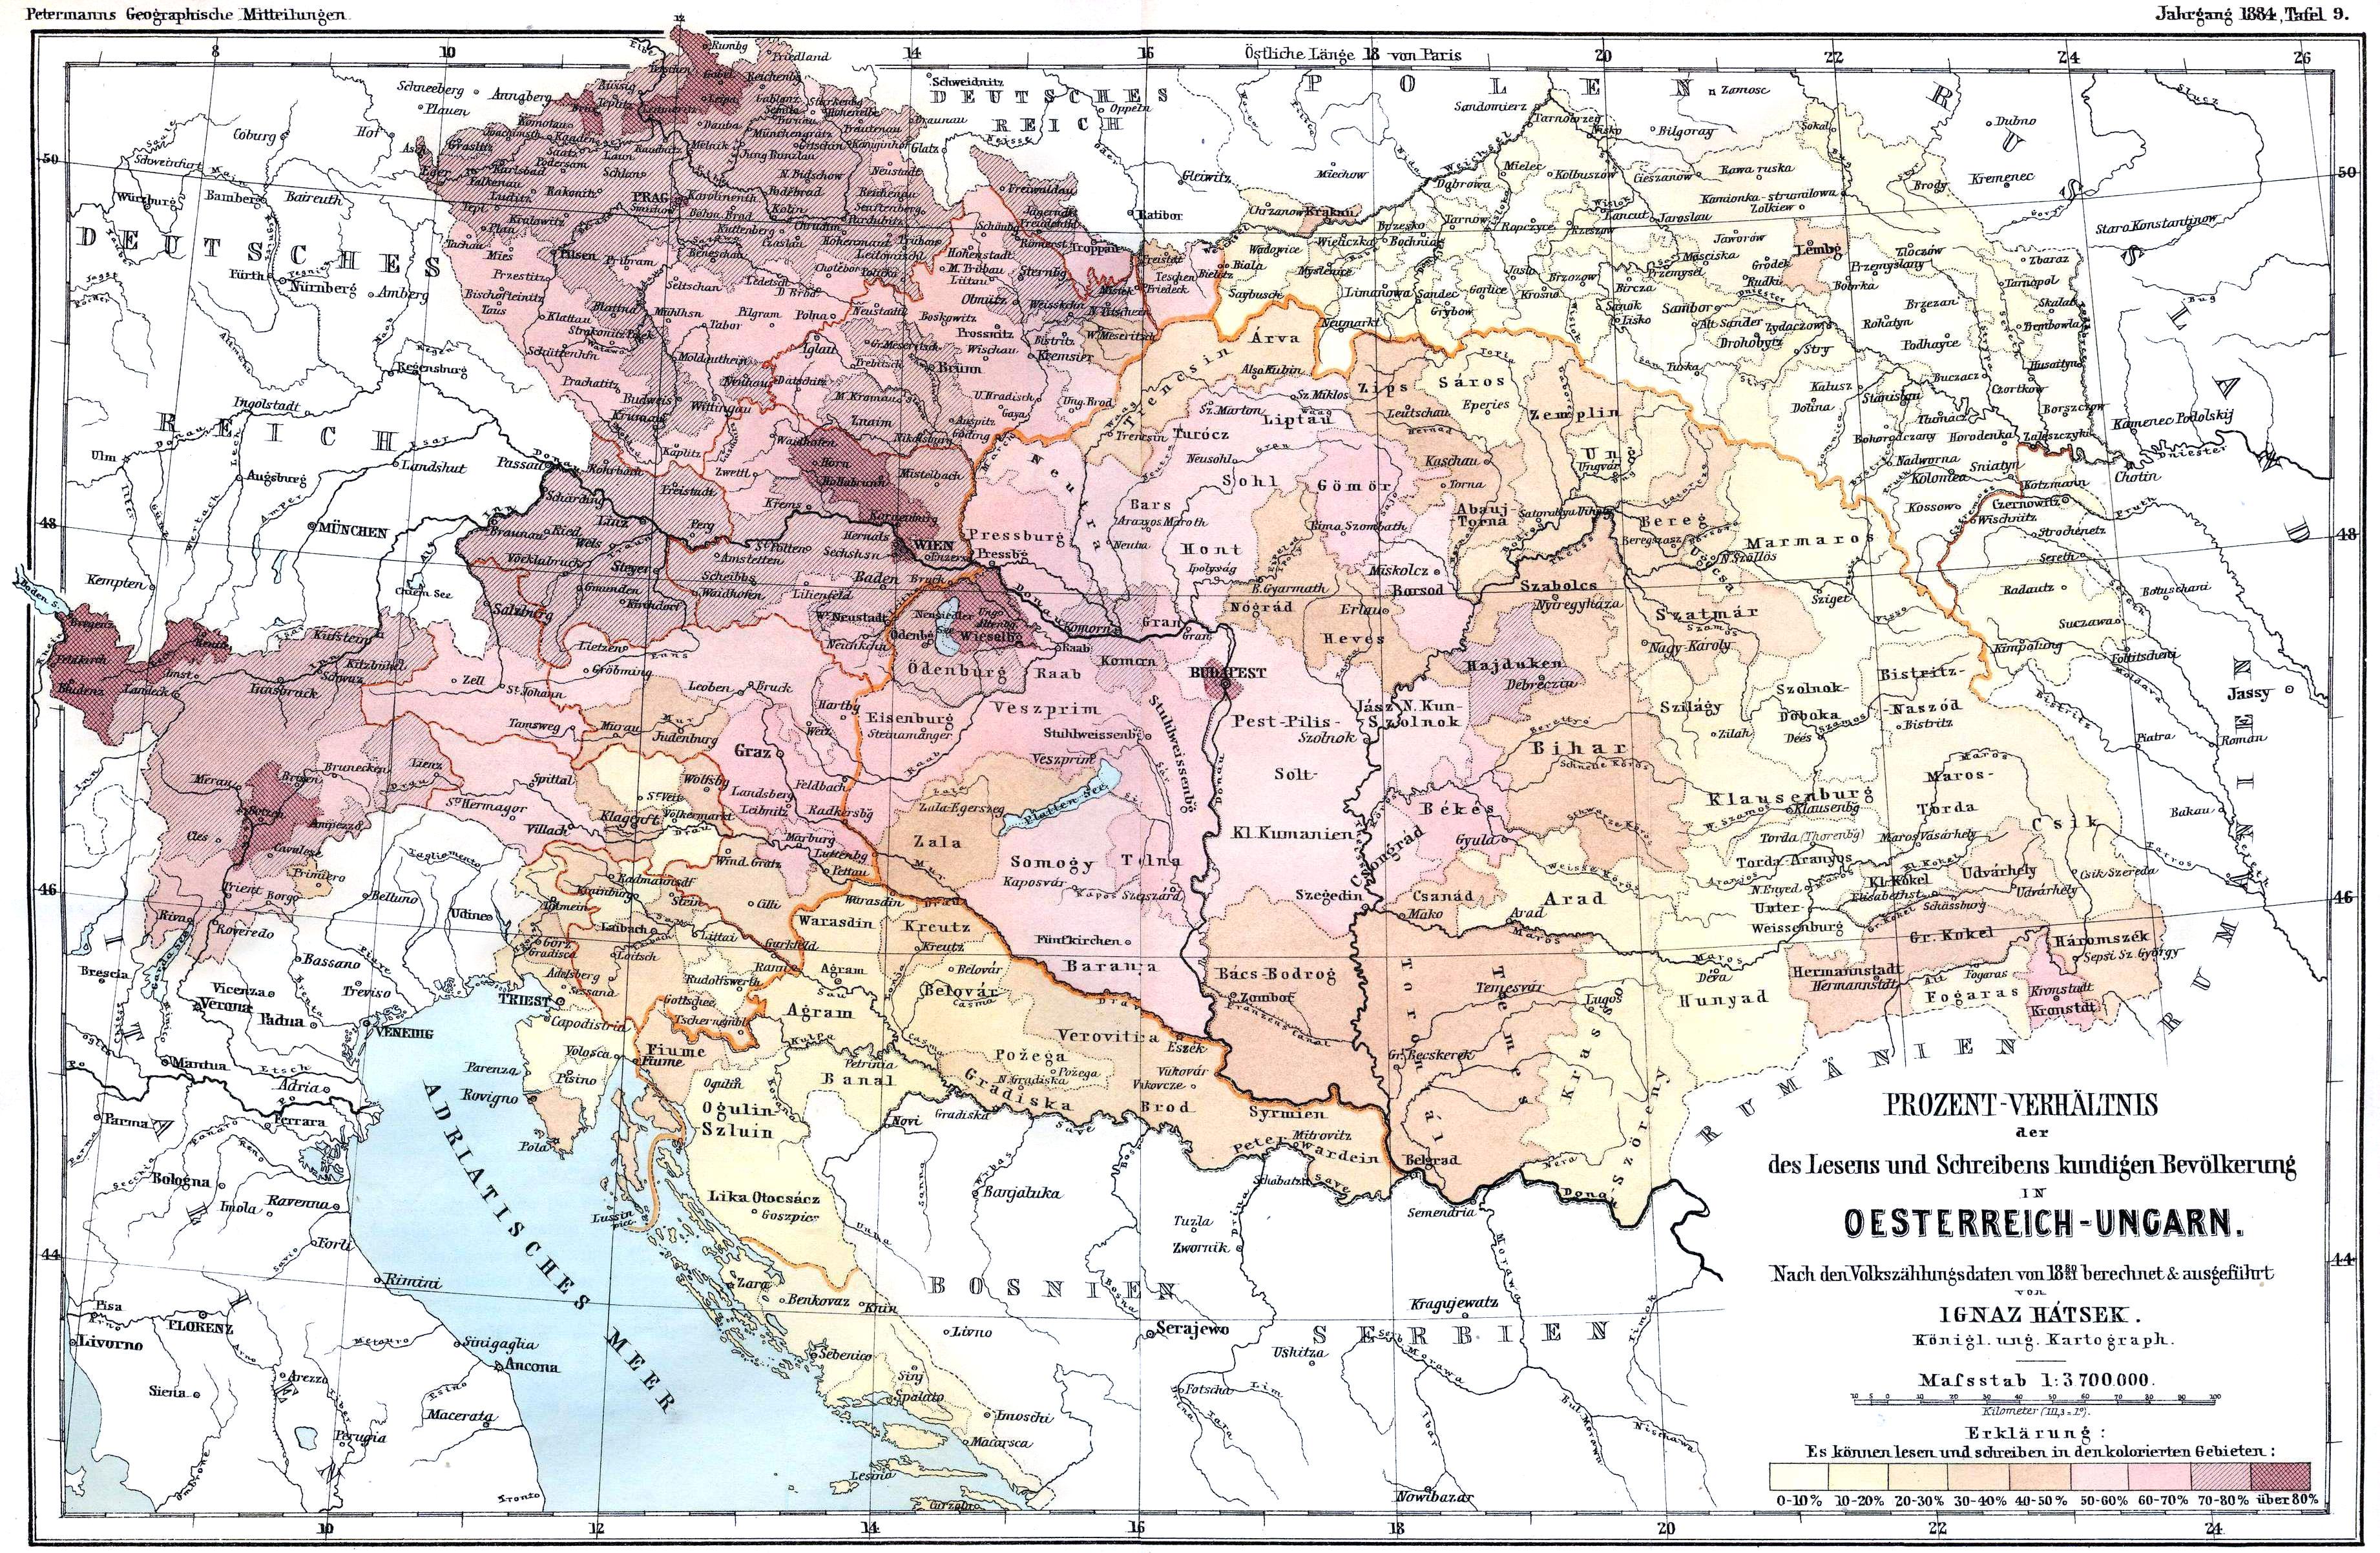
Literacy Rates Map of Austro-Hungarian Empire 1880
The map titled "Literacy Rates in Austro-Hungarian Empire (Census 1880)" visually represents the literacy levels across ...
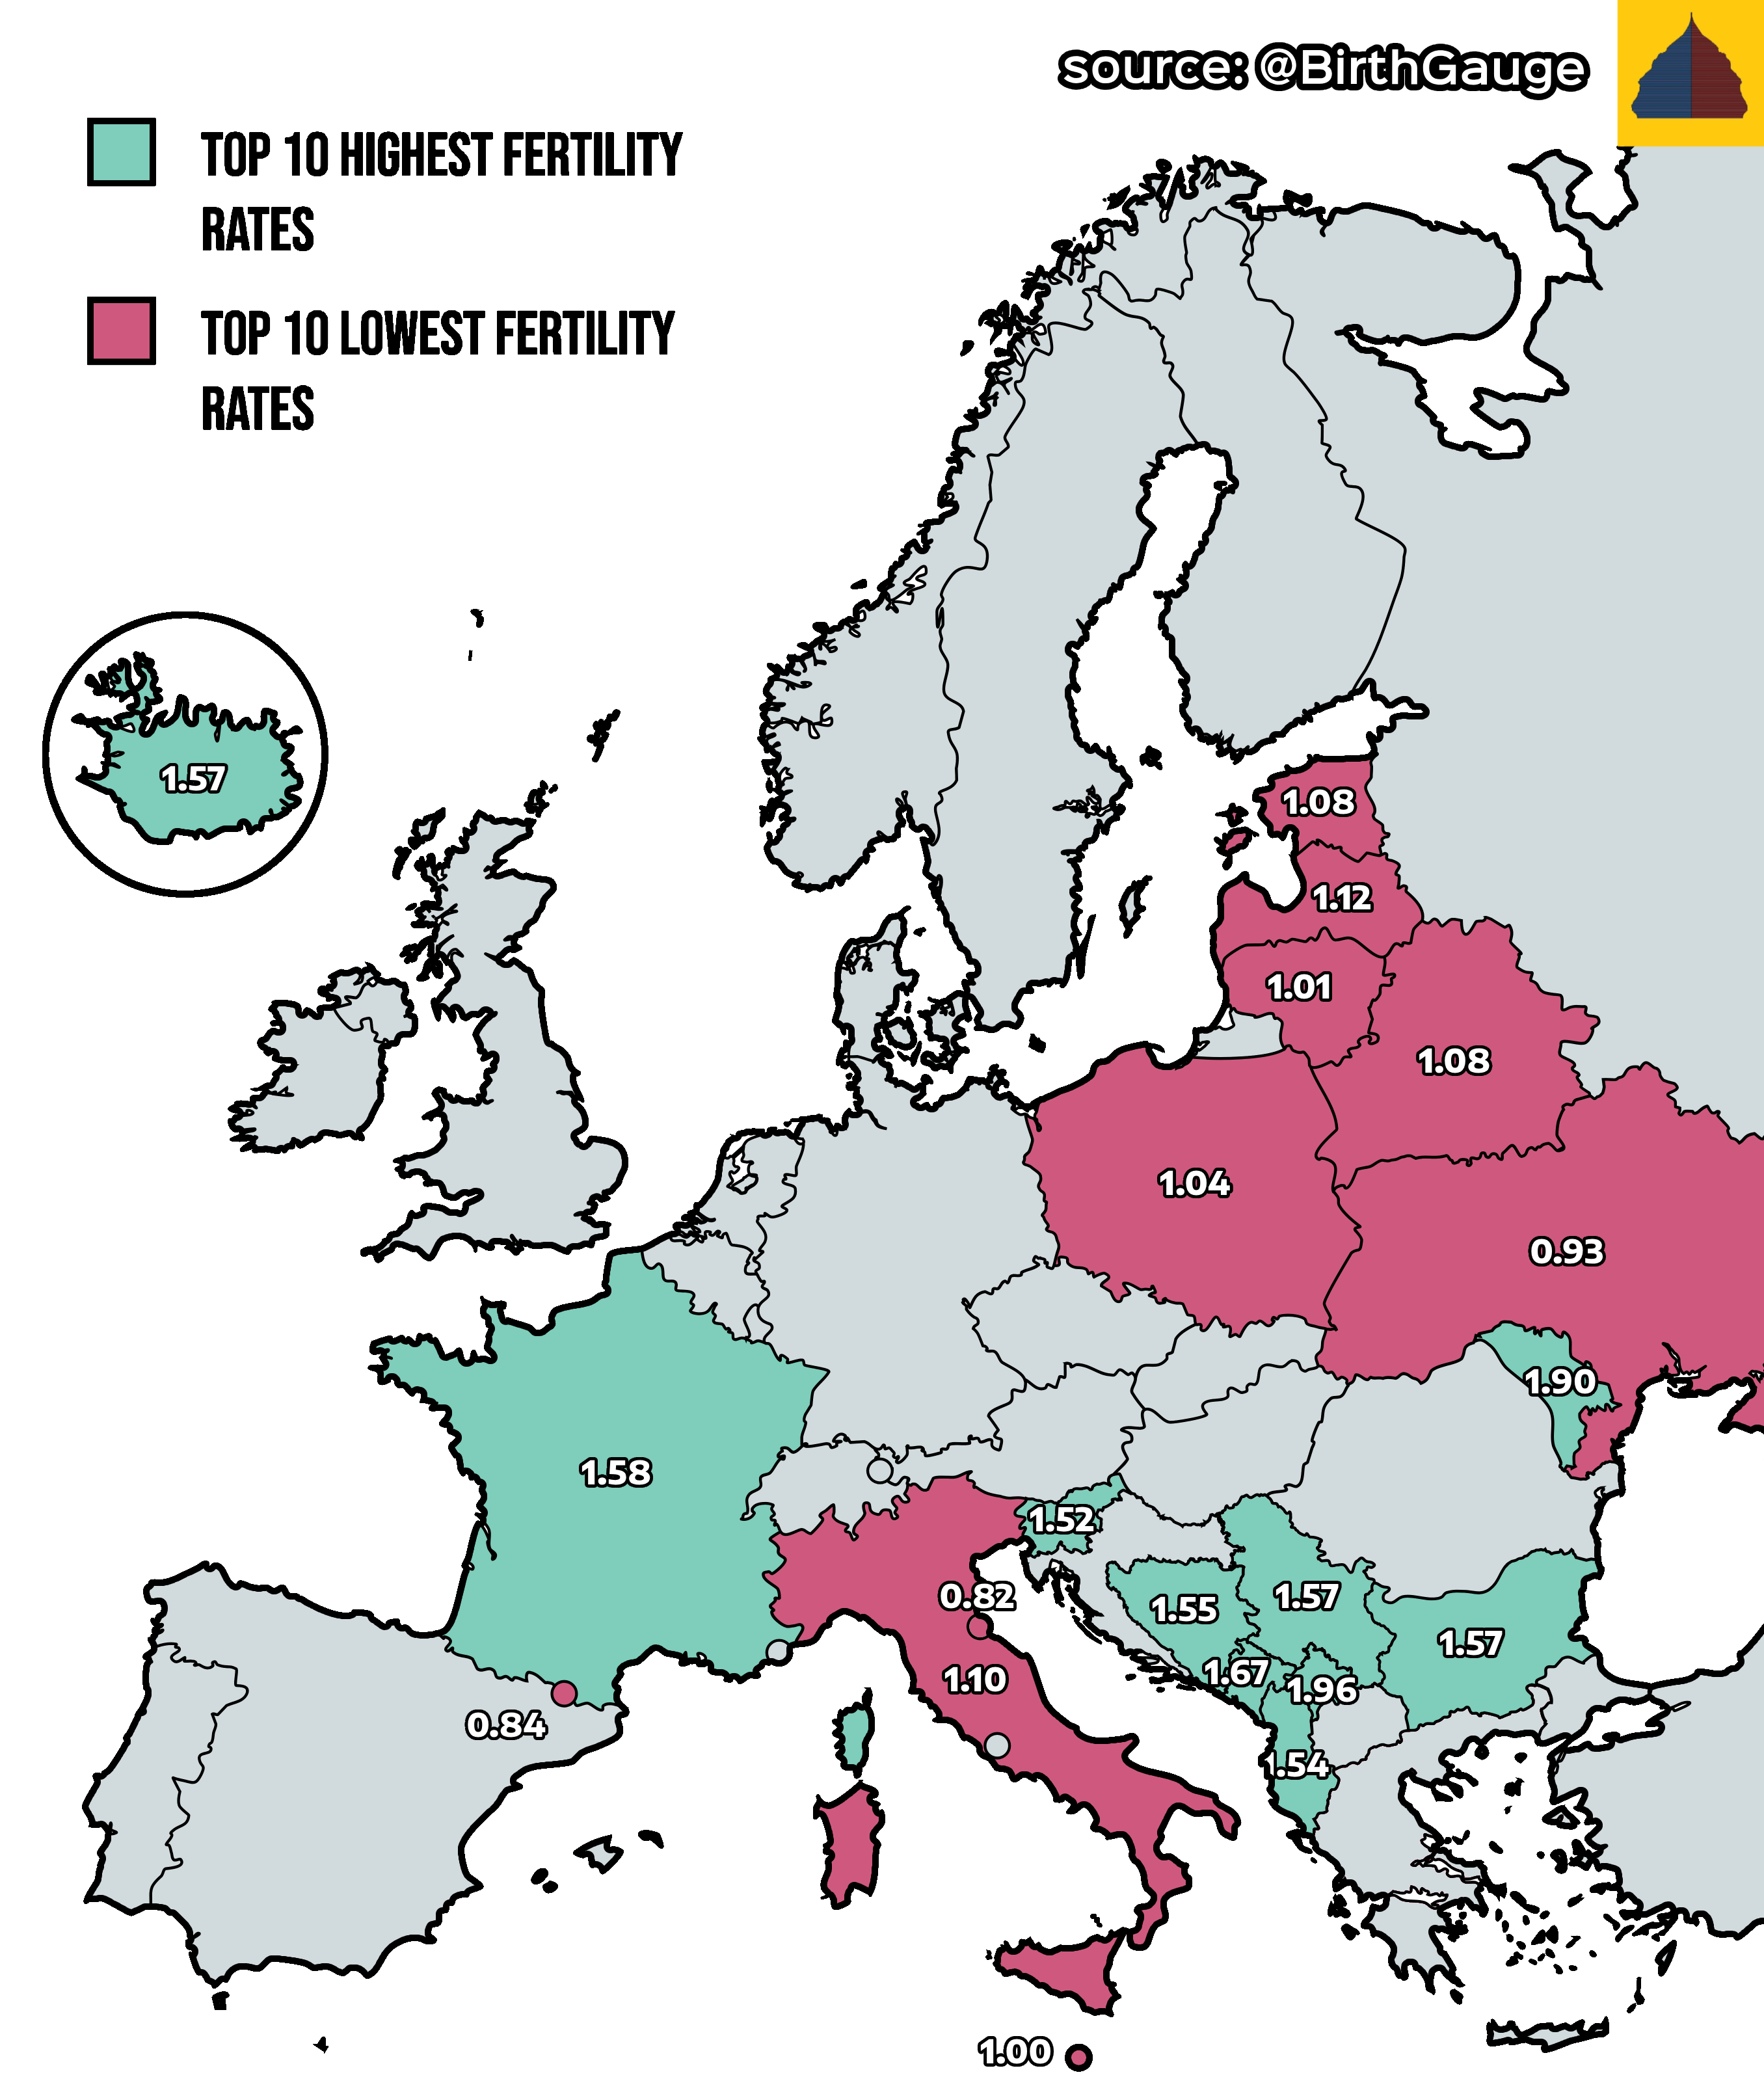
Europe’s Highest and Lowest Fertility Rates Map
The \...