Map of Percent of Commuting Workers Who Commute 60+ Minutes

David Chen
Data Visualization Specialist
David Chen is an expert in transforming complex geographic datasets into compelling visual narratives. He combines his background in computer science ...
Geographic Analysis
What This Map Shows
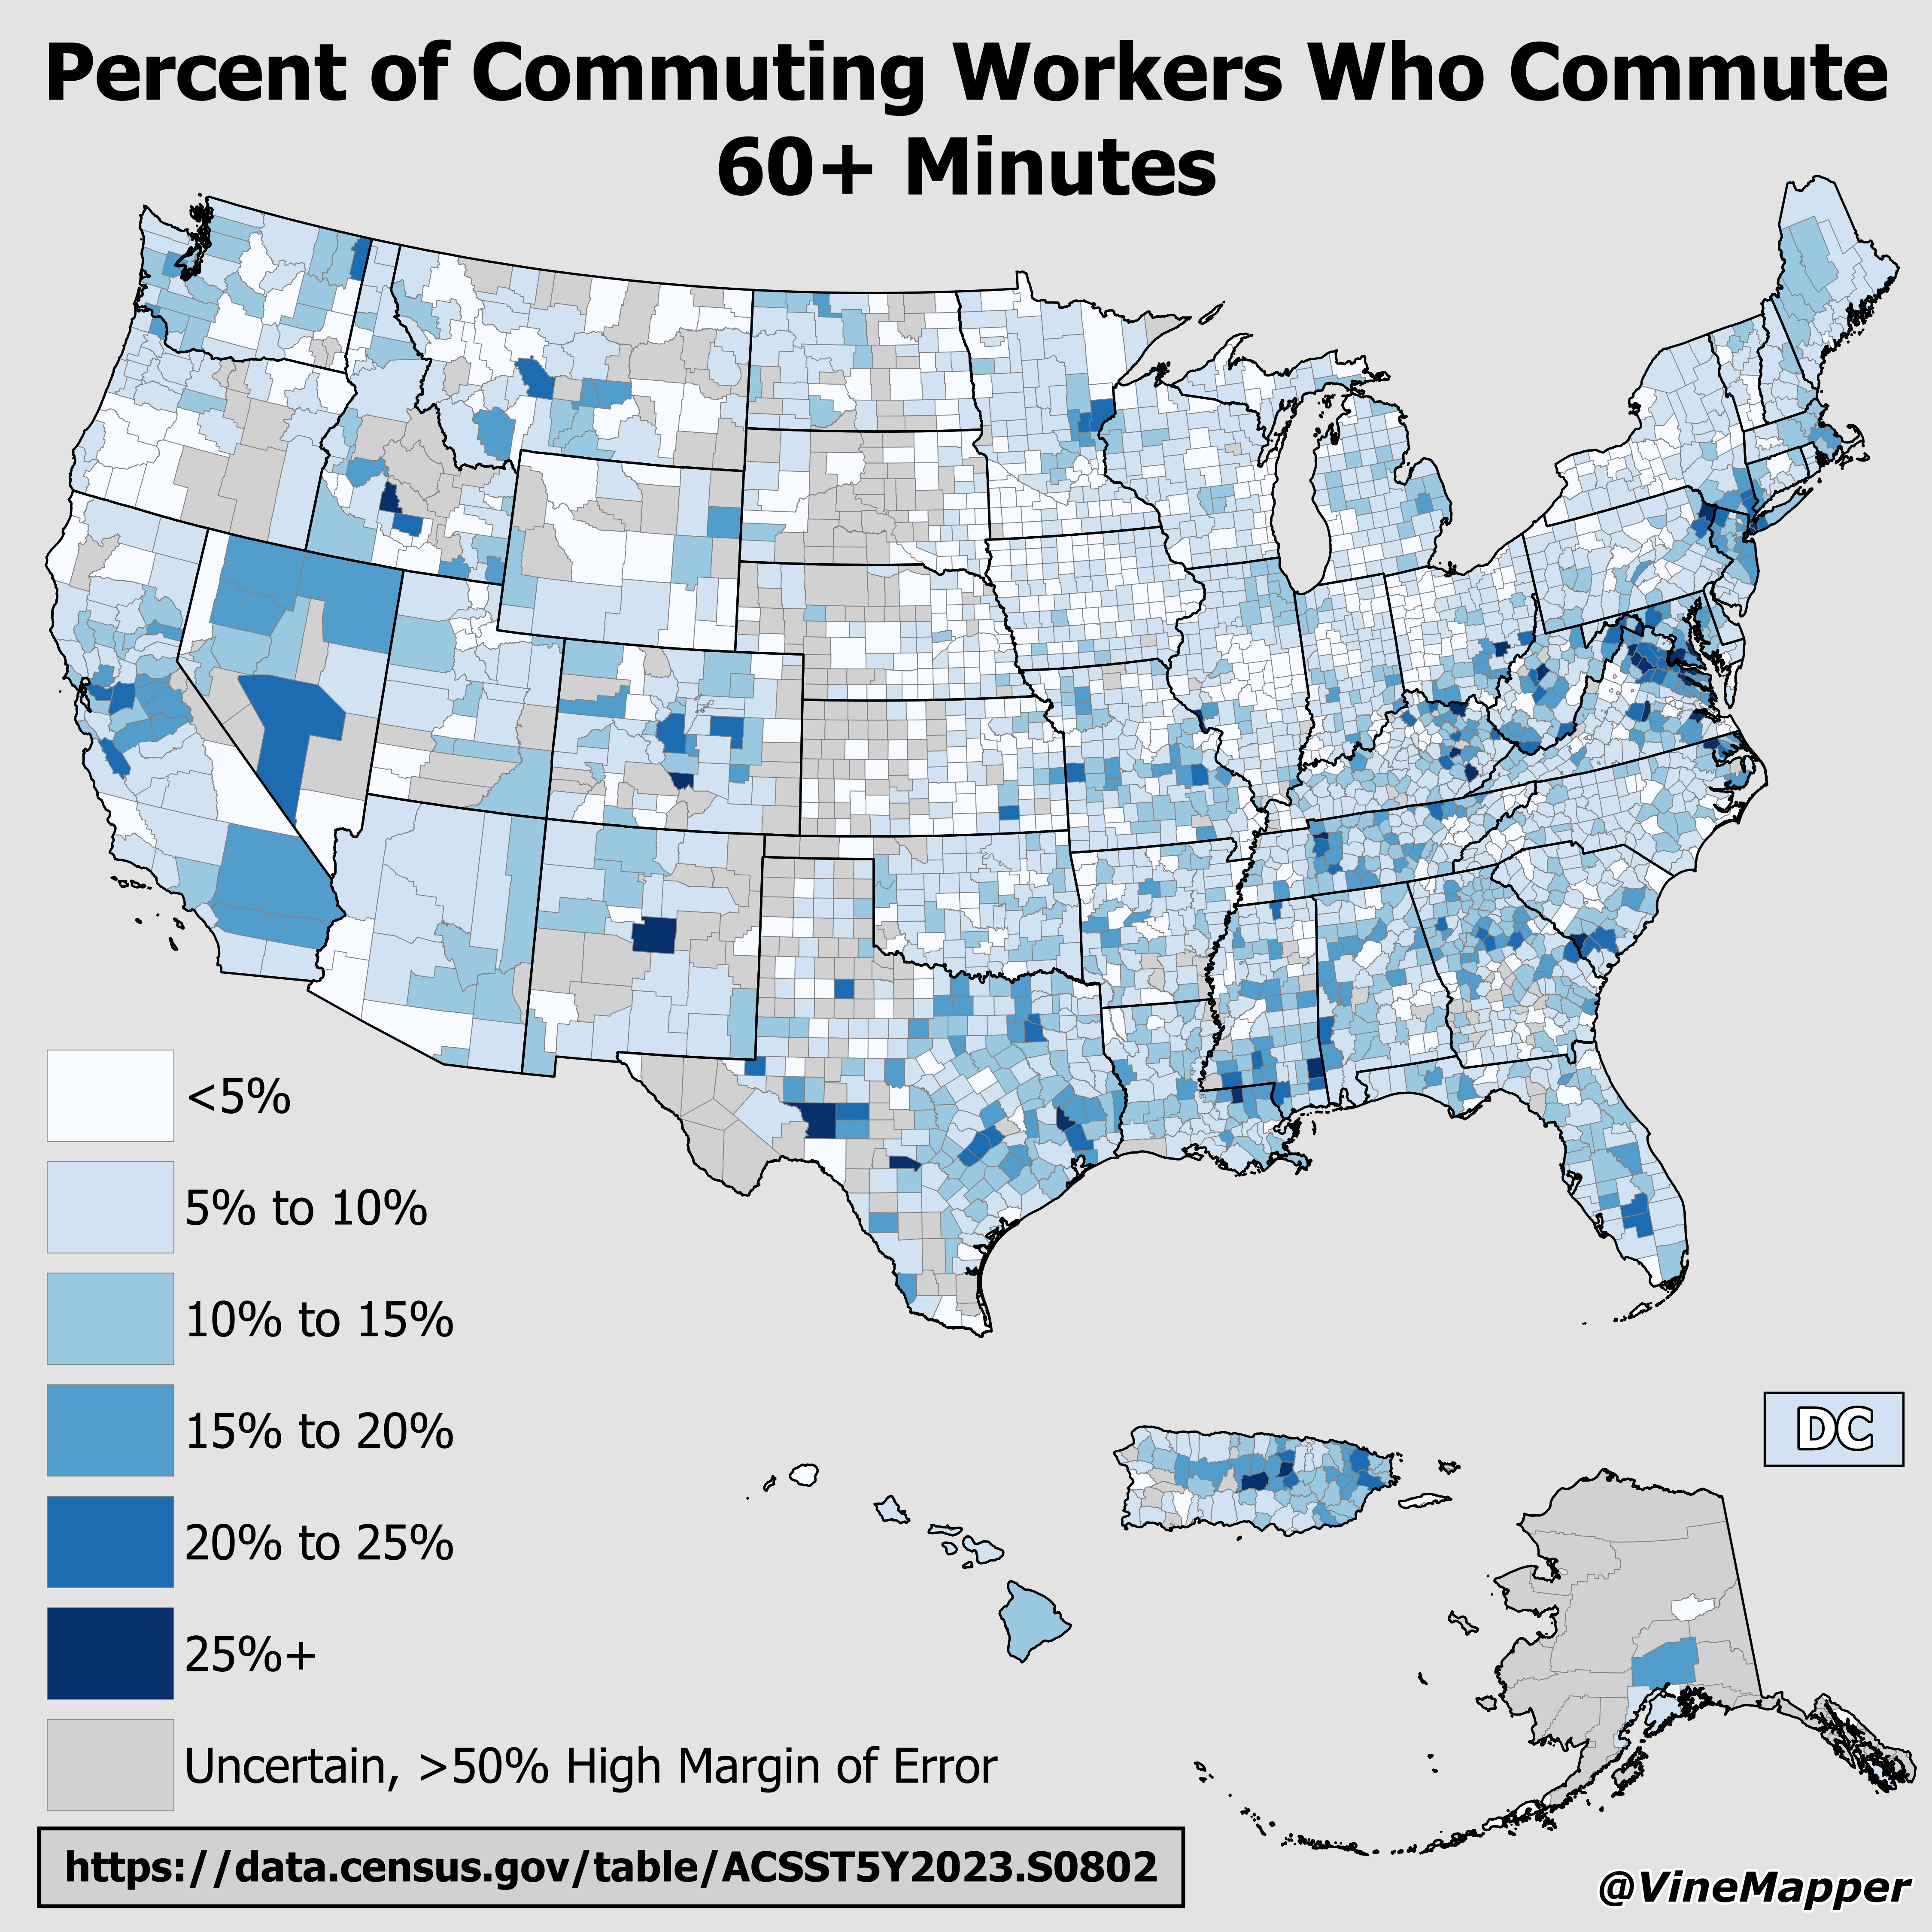
The visualization titled "Percent of Commuting Workers Who Commute 60+ Minutes" provides a clear illustration of the states in the U.S. where a significant portion of workers spend over an hour commuting to their jobs. This map highlights the challenges many Americans face in their daily lives, illustrating how commute times can vary dramatically from one state to another. These long commutes can affect not only individual well-being but also overall economic productivity, making it a crucial topic for discussion.
As we delve into the nature of commuting, we find that it’s more than just a daily routine for many; it’s a reflection of various socio-economic factors, urban planning decisions, and regional characteristics. The map serves as a window into understanding the broader implications of commuting duration across different states.
Deep Dive into Commuting Patterns
Commuting is a significant aspect of modern life, particularly in a country as vast as the United States. According to recent data, approximately 5% of American workers commute for 60 minutes or longer each way. This statistic brings to light a host of factors that contribute to long commute times, including population density, urban sprawl, transportation infrastructure, and economic opportunities.
Interestingly, areas with high rates of long commutes often correlate with major urban centers. For example, cities like New York, San Francisco, and Los Angeles have seen a rise in commuting durations due to their burgeoning job markets. However, the cost of living in these areas has led many workers to seek housing further from the city center, resulting in longer travel times. This phenomenon is not limited to metropolitan areas; suburban expansion often leads to increased commute times as people move away from urban cores in search of more affordable living options.
Moreover, the type of transportation available can greatly influence commuting duration. States with well-developed public transit systems, such as New York and New Jersey, may see lower percentages of long commutes compared to states with limited public transport options. For instance, in states like Utah and Idaho, where public transportation is less prevalent, many commuters rely on personal vehicles, often leading to longer travel times exacerbated by traffic congestion.
Additionally, commuting is not only about distance but also about time spent in transit. Factors like road conditions, traffic patterns, and even weather can impact how long it takes to get to work. Have you noticed that rush hour can add significant time to your travel? This is a common scenario in many urban areas, where the peak traffic times can double or triple commuting durations.
Regional Analysis
When examining the map, it's evident that certain regions exhibit distinct commuting patterns. For example, states like Maryland and Virginia show higher percentages of workers commuting 60 minutes or more, largely due to their proximity to Washington, D.C. Many residents in these states work in the nation's capital, leading to a significant daily influx of commuters. Conversely, states in the Midwest, like Nebraska and Iowa, tend to have lower percentages of long commutes, reflecting their more compact urban layouts and efficient transportation networks.
Furthermore, the South showcases a mixed bag; states such as Georgia, particularly around Atlanta, have seen a surge in long commutes due to rapid population growth and insufficient infrastructure to handle the increased traffic. In contrast, states like Mississippi and Alabama report lower commuting times, reflecting a more rural lifestyle where job opportunities may not require long-distance travel.
Significance and Impact
Understanding the implications of long commuting times is crucial, not just for individual workers but also for policymakers and urban planners. Long commutes can lead to decreased work-life balance, increased stress, and even health problems. They can also contribute to a greater environmental footprint due to increased vehicle emissions and fuel consumption.
Interestingly, trends indicate that telecommuting and remote work options are on the rise, partly in response to the challenges associated with long commutes. The COVID-19 pandemic accelerated this shift, prompting many companies to reconsider traditional work arrangements. Looking forward, it’s essential to consider how these changes will affect commuting patterns in the coming years. Will we see a permanent decline in long commutes, or will the return to office life push workers back into traffic?
In conclusion, the map of commuting workers who travel 60 minutes or longer for work offers more than just a visual representation of data; it opens the door to discussions about urban development, infrastructure planning, and socio-economic trends. As we continue to evolve in our work habits and living situations, the implications of our commute will undoubtedly shape the future of our cities and lifestyles.
Visualization Details
- Published
- October 7, 2025
- Views
- 44
Comments
Loading comments...