Map of Same-Sex Couples per 1000 Households by State

David Chen
Data Visualization Specialist
David Chen is an expert in transforming complex geographic datasets into compelling visual narratives. He combines his background in computer science ...
Geographic Analysis
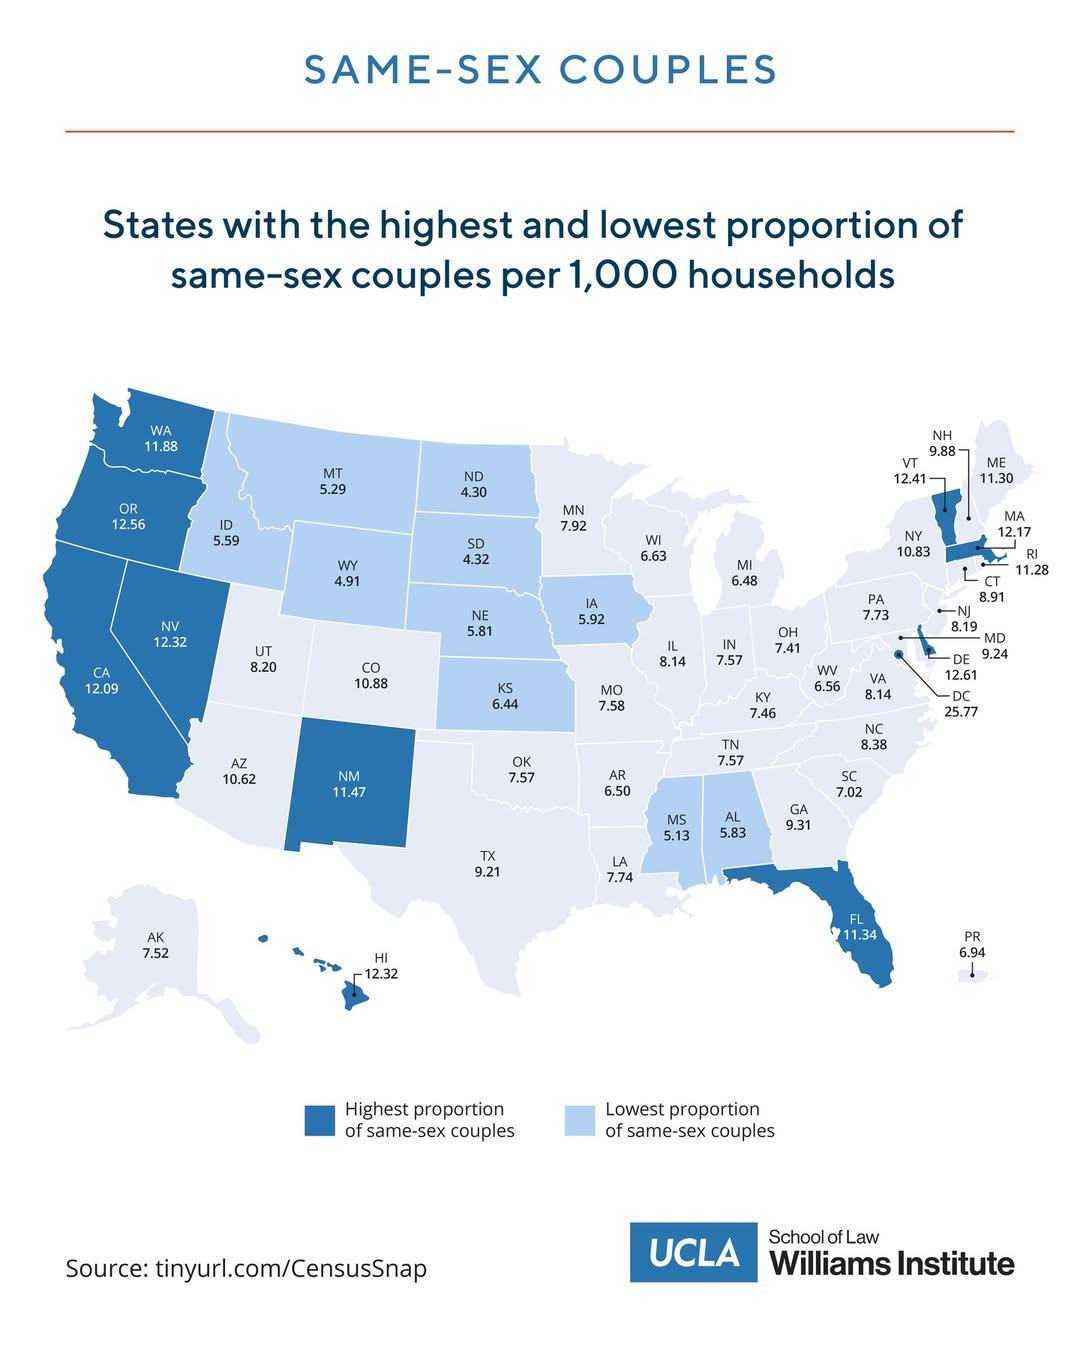
What This Map Shows
This map illustrates the proportion of same-sex couples per 1,000 households based on data from the 2020 Census. Understanding the distribution of same-sex couples across the United States helps shed light on broader social trends, demographic shifts, and the evolving landscape of LGBTQ+ recognition and rights. It highlights which states are more inclusive or supportive environments for same-sex couples and offers a glimpse into the societal acceptance of diverse relationship orientations.
Deep Dive into Same-Sex Couples in the U.S.
The presence of same-sex couples in American society has seen significant changes over the last few decades. According to the 2020 Census, approximately 1.2 million same-sex couples reside in the United States. This is a remarkable increase compared to previous decades, reflecting broader societal acceptance and legal advancements, such as the legalization of same-sex marriage in 2015.
In examining the data, we find that states with higher proportions of same-sex couples often correlate with urban centers, progressive policies, and higher levels of educational attainment. For instance, California, New York, and Illinois top the list with the highest rates of same-sex couples per 1,000 households. These states not only have vibrant urban lifestyles but also robust legal protections for LGBTQ+ individuals, which encourage same-sex couples to form households openly.
Interestingly, the landscape varies drastically in states with lower proportions of same-sex couples. States like Montana, Wyoming, and Mississippi report much lower numbers. This disparity can often be attributed to cultural conservatism, limited legal protections, and fewer resources for LGBTQ+ communities in these regions. For example, in Mississippi, negative attitudes towards same-sex relationships can discourage individuals from disclosing their relationships, leading to underreporting in census data.
It's also important to consider how these numbers relate to broader demographic trends. The percentage of same-sex couples is often higher in densely populated areas, where anonymity and community support can foster a more open lifestyle. Urban centers like San Francisco and New York City have long been recognized as LGBTQ+ hubs, offering not just social acceptance but also economic opportunities that attract diverse populations.
Regional Analysis
When dissecting the map further by region, notable trends emerge. The West Coast, particularly California and Oregon, exhibits the highest proportions of same-sex couples. California leads not only in sheer numbers but also in progressive policies that enhance visibility and rights for LGBTQ+ individuals. Cities like San Francisco and Los Angeles are known for their vibrant LGBTQ+ communities and cultural events, such as Pride parades that promote inclusivity.
In contrast, the Southern states tend to show lower proportions, reflecting more conservative social norms. For instance, states like Alabama and Arkansas report some of the lowest figures. Here, cultural attitudes can significantly impact the visibility and acceptance of same-sex couples, often leading to a reluctance to disclose relationship status.
The Midwest presents a mixed picture. States like Illinois, particularly in metropolitan areas like Chicago, exhibit higher rates of same-sex couples, supported by progressive policies and a strong LGBTQ+ community. Conversely, more rural states like North Dakota show much lower figures, suggesting that geographic isolation may limit social support networks for same-sex couples.
Significance and Impact
Understanding the distribution of same-sex couples is crucial for several reasons. It highlights societal acceptance and the progress made in LGBTQ+ rights while also shedding light on ongoing challenges in less accepting regions. The implications of these statistics are significant for policymakers, community organizations, and advocates working towards equality.
As society continues to evolve, current trends indicate an increasing visibility and acceptance of LGBTQ+ relationships across the country. However, disparities still exist, particularly in more conservative areas. Advocates argue that addressing these disparities is essential for ensuring equal rights and protections for all individuals, regardless of their sexual orientation.
Looking forward, the trajectory suggests a continued increase in the acknowledgment and support of same-sex couples, driven by younger generations who tend to be more progressive. This could lead to shifts in household structures, community dynamics, and even economic impacts as more same-sex couples seek to establish roots in areas that promote inclusivity.
In conclusion, the data on same-sex couples per 1,000 households is more than just numbers; it reflects societal attitudes, cultural norms, and the ongoing journey toward equality in the United States. As we continue to monitor these changes, it becomes increasingly clear that geography plays a critical role in shaping the experiences of same-sex couples across the nation.
Visualization Details
- Published
- September 24, 2025
- Views
- 60
Comments
Loading comments...