California Population Density Map

Alex Cartwright
Senior Cartographer & GIS Specialist
Alex Cartwright is a renowned cartographer and geographic information systems specialist with over 15 years of experience in spatial analysis and data...
Geographic Analysis
What This Map Shows
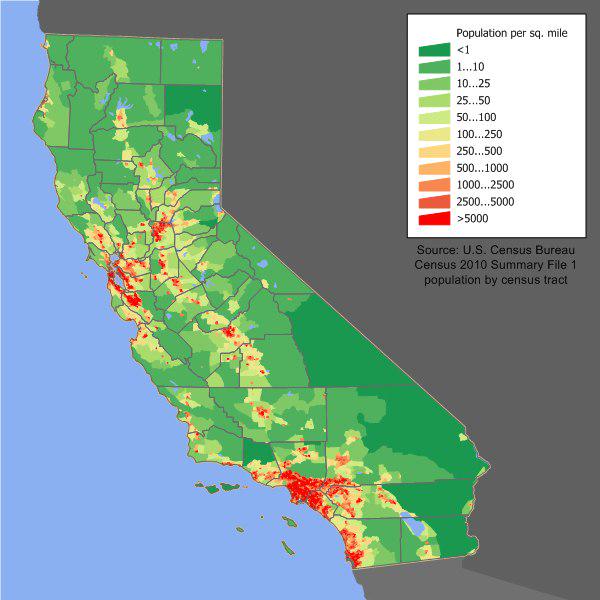
The California Population Density Map provides a clear visual representation of the distribution of people across the state of California. This map illustrates how densely populated certain areas are compared to others, revealing patterns that can be critical for urban planning, resource allocation, and understanding social dynamics.
Deep Dive into Population Density
Population density refers to the number of people living per unit area, typically expressed as people per square mile or square kilometer. In California, the population density varies significantly from urban centers to rural areas. For instance, cities like Los Angeles and San Francisco are among the most densely populated regions in the state, showcasing the importance of urbanization in California’s demographic landscape.
Interestingly, California has a diverse population that reflects a mix of cultures, ethnicities, and socioeconomic backgrounds. According to the U.S. Census Bureau, California's population reached approximately 39.5 million as of 2023. This immense population is distributed unevenly, with about 93% of Californians residing in urban areas, while only 7% live in rural regions. Have you ever wondered why certain areas attract more people than others? Factors such as job availability, climate, and lifestyle options play significant roles in these distribution patterns.
In terms of statistics, Los Angeles County, the most populous county in the United States, has a staggering population density of over 2,600 people per square mile. In contrast, more rural counties like Modoc County have only about 2 people per square mile. This stark difference highlights the influence of economic opportunities and infrastructure on population distribution. Urban areas boast higher population densities due to the availability of jobs, educational institutions, and amenities. Conversely, rural areas often face challenges such as limited job opportunities and amenities, leading to lower population densities.
It’s also worth noting that California's population density is affected by its geographical features. The state is home to various landscapes, including mountains, deserts, and coastal regions, which can either attract residents or deter them. For example, the coastal cities benefit from milder climates and beautiful scenery, making them more desirable places to live. However, the rugged terrain of the Sierra Nevada mountains can limit population growth in those areas.
Regional Analysis
When examining the California Population Density Map, several regions emerge with distinct characteristics. In Southern California, the urban sprawl of Los Angeles and Orange Counties is contrasted by the more suburban nature of counties like San Bernardino and Riverside. Here, density can vary widely; for instance, while downtown Los Angeles is bustling with over 8,000 people per square mile, neighboring Riverside County has an average density of about 350 people per square mile.
Moving north, the Bay Area showcases a different demographic structure. Cities like San Francisco and Oakland are densely populated—San Francisco boasts over 18,000 people per square mile, making it one of the most densely populated cities in the U.S. However, as you venture into the neighboring Marin and Sonoma counties, the population density decreases significantly due to the more suburban and rural nature of these areas.
What’s fascinating is how the Central Valley contrasts with these coastal regions. Despite being an agricultural hub, counties like Fresno and Kern have relatively high population densities compared to rural areas but still lack the density seen in urban settings like San Jose or Los Angeles. This is largely due to the influx of workers in the agriculture sector.
Significance and Impact
Understanding population density is crucial for various reasons. It plays a significant role in urban planning, infrastructure development, and resource management. High-density areas often face challenges like traffic congestion, housing shortages, and environmental concerns. Conversely, regions with lower densities may struggle with economic development and access to services.
Current trends indicate that California's population is expected to continue growing, albeit at a slower rate than in previous decades. This growth can lead to increased pressure on housing markets, public transportation, and essential services. Moreover, with the ongoing discussions about climate change, urban planners and policymakers must consider how population density affects sustainability efforts.
In summary, the California Population Density Map isn’t just a visual tool; it’s a gateway to understanding the intricacies of human settlement patterns, economic viability, and the future of urban development in one of the most populous states in the U.S. As California continues to evolve, so too will its population dynamics, making it imperative for residents and policymakers alike to stay informed on these trends.
Visualization Details
- Published
- September 4, 2025
- Views
- 122
Comments
Loading comments...