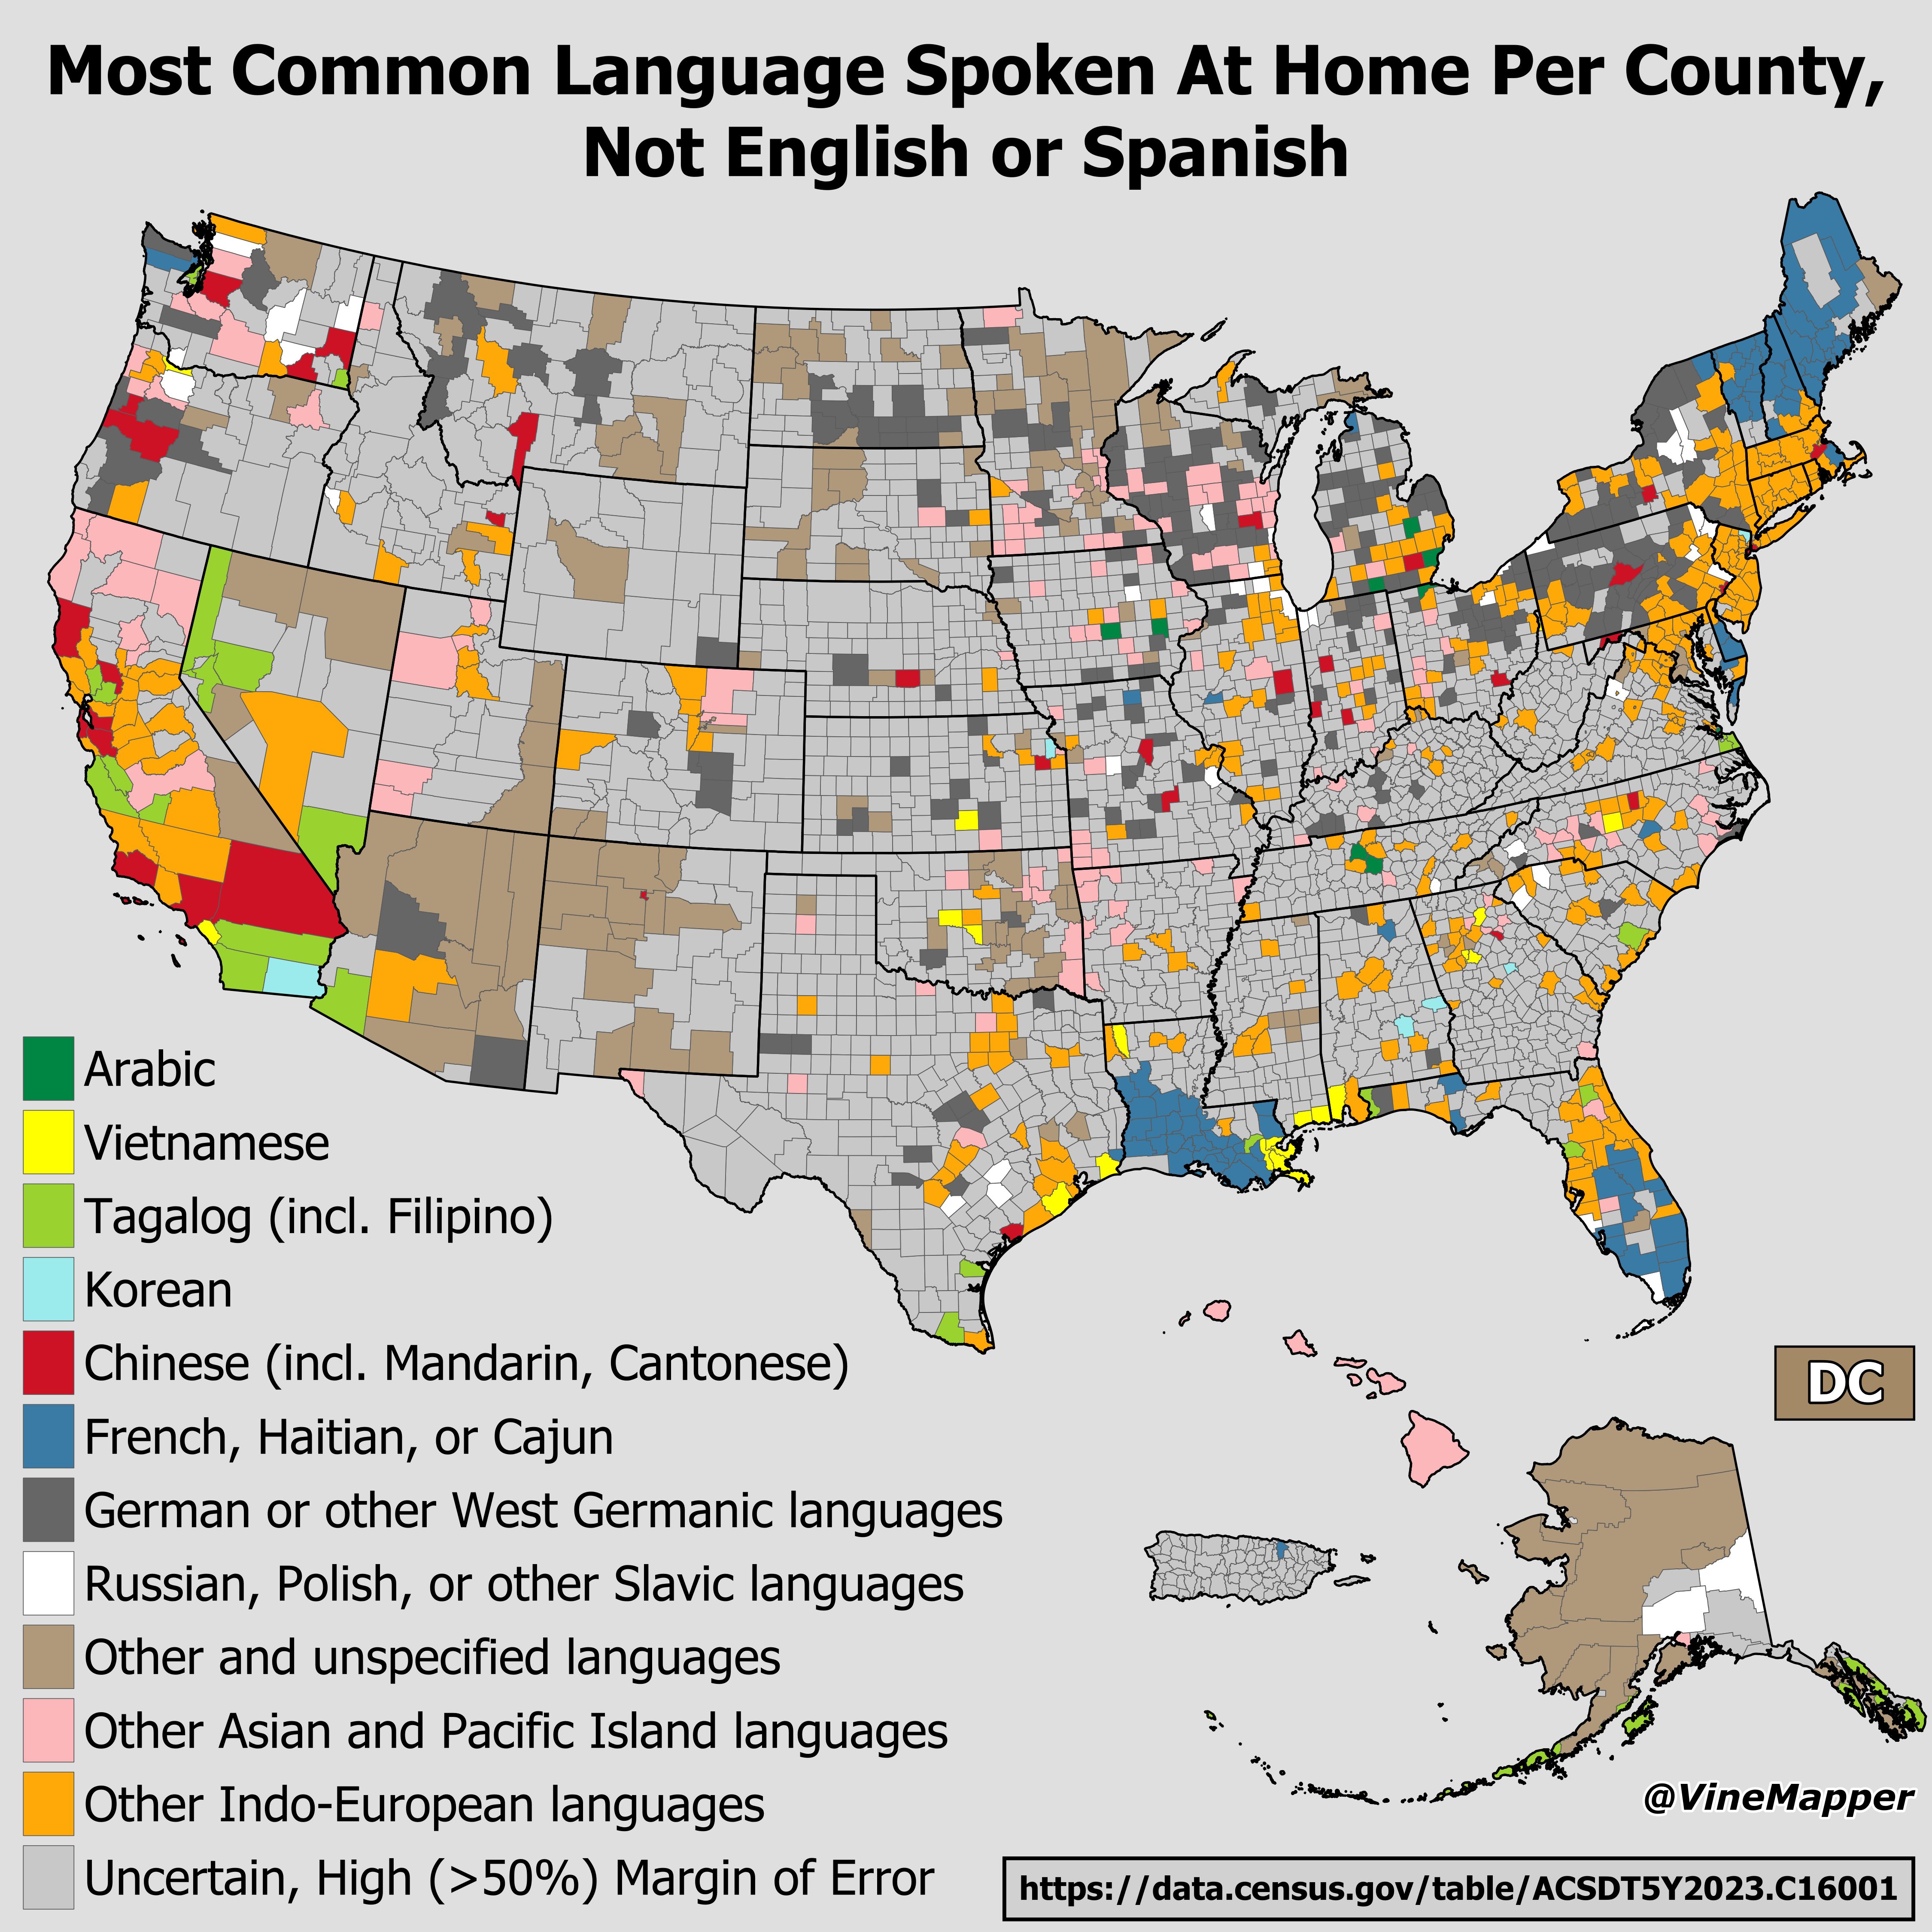
Map of Most Common Language Spoken at Home by County

David Chen
Data Visualization Specialist
David Chen is an expert in transforming complex geographic datasets into compelling visual narratives. He combines his background in computer science ...
Geographic Analysis
What This Map Shows
This map visualizes the most common languages spoken at home across U.S. counties, excluding English and Spanish. It highlights the rich linguistic diversity present in various regions, showcasing languages that reflect the cultural heritage and immigrant populations of specific areas. By examining these languages, we can glean insights into the demographics and cultural identity of communities across the nation.
Deep Dive into Language Diversity
Language is not just a means of communication; it is a window into culture, history, and identity. In the U.S., the predominance of English and Spanish is well-documented, but what’s fascinating is the diversity that exists beyond these two languages. According to the U.S. Census Bureau's American Community Survey, nearly 21% of the population speaks a language other than English at home, and many of these languages tell a unique story about the area's inhabitants.
Interestingly, languages such as Chinese, Tagalog, Vietnamese, French, and Arabic appear frequently as the most spoken languages in various counties. For instance, in Los Angeles County, a significant portion of the population speaks Korean, reflecting the area's large Korean community. Meanwhile, in parts of New York City, languages like Bengali and Mandarin are prevalent due to substantial Asian immigrant populations.
This linguistic tapestry is influenced by various factors including immigration patterns, historical settlement, and economic opportunities. Take, for example, the concentration of Arabic speakers in counties like Dearborn, Michigan. This community has grown significantly over the past few decades, largely due to immigration from countries such as Lebanon and Iraq. Similarly, the presence of Tagalog in areas like San Diego corresponds with the substantial Filipino population in that region.
The implications of language spoken at home extend beyond mere statistics. They can influence education, social services, and community dynamics. Schools in multilingual areas often have to adapt their curricula to meet the needs of students from various linguistic backgrounds, which can lead to innovative educational practices that embrace diversity.
Regional Analysis
When we break down the map by regions, some patterns emerge that deserve attention. In the Northeast, for example, you’ll find a high prevalence of languages such as Russian and Haitian Creole, particularly in urban centers like New York City and Boston. The historical waves of immigration from Eastern Europe and the Caribbean have left a lasting impact on local culture and language use.
Conversely, the Southwest region is characterized by a rich variety of indigenous languages alongside more recent immigrant languages such as Farsi and Punjabi. In counties with a significant Native American population, languages like Navajo and Apache are still actively spoken at home, preserving their cultural heritage amidst modern influences.
Interestingly, in the Midwest, counties with large agricultural communities sometimes show a higher prevalence of German and Polish languages, reflecting the historical settlement patterns of these groups. The robust farming traditions and community ties have allowed these languages to endure over generations.
Significance and Impact
Understanding the languages spoken at home is crucial for several reasons. It illustrates the multicultural fabric of American society and highlights the challenges and opportunities presented by this diversity. Language plays a vital role in shaping community identity, influencing social interactions, and affecting economic integration.
Furthermore, as global migration continues to reshape demographics, the importance of language services in government, healthcare, and education becomes increasingly critical. For instance, local governments may need to provide materials in multiple languages to ensure that all residents have access to essential services. This is not just a matter of convenience; it’s a fundamental right to ensure every individual can participate fully in their community.
Looking ahead, the trends indicate that language diversity will likely continue to grow. As the U.S. becomes more interconnected with the global community, we can expect to see shifts in linguistic patterns, with emerging languages reflecting new waves of immigration and cultural exchange. Have you noticed how many new languages have appeared in your local area? It’s a reminder that language is a living, evolving entity that reflects the world around us.
In essence, this map is more than just a collection of data points; it’s a story of who we are as a nation and how our communities come together through shared languages. By recognizing and embracing this diversity, we can foster a more inclusive society that values the rich tapestry of cultures that make up the United States.
Visualization Details
- Published
- September 2, 2025
- Views
- 14
Comments
Loading comments...