Max Speed Limit by Country Map

Marcus Rodriguez
Historical Geography Expert
Marcus Rodriguez specializes in historical cartography and geographic data analysis. With a background in both history and geography, he brings unique...
Geographic Analysis
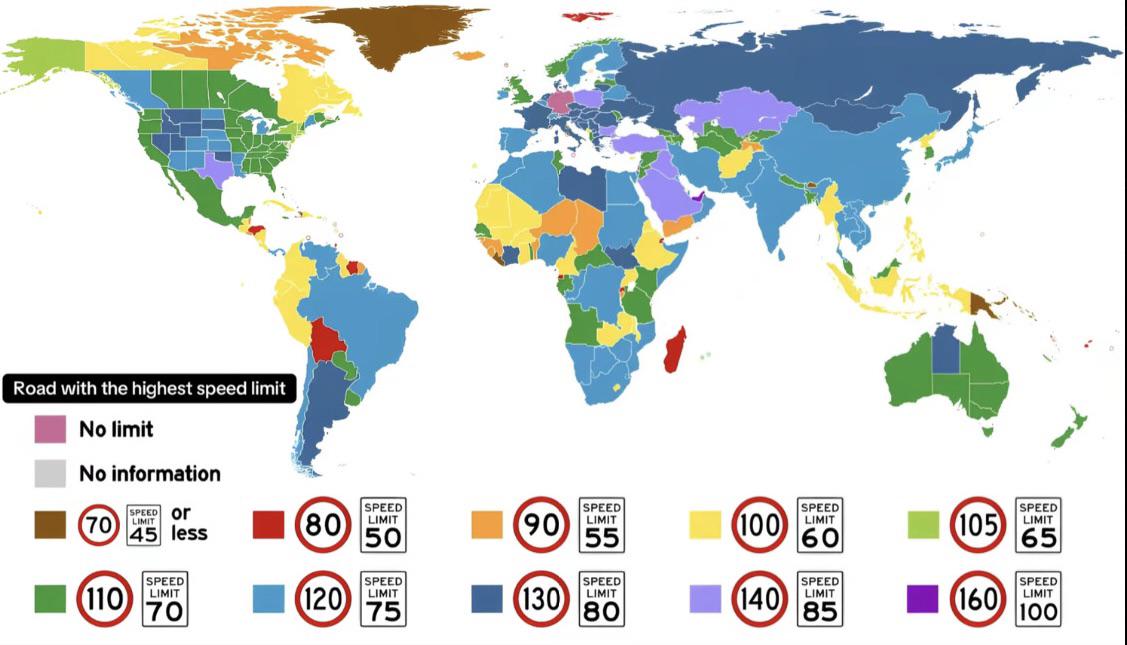
What This Map Shows
The "Max Speed Limit by Country Map" provides a visual representation of the maximum speed limits set across different nations. This geographical visualization highlights how regulations vary significantly from one country to another, reflecting not just safety standards but also cultural attitudes towards driving and transportation. As you explore the map, you may notice stark contrasts between regions, which can be fascinating and telling about the infrastructure and driving culture in those areas.
Deep Dive into Speed Limits
Speed limits play a crucial role in road safety and traffic management. They are established based on various factors, including road conditions, vehicle types, and regional driving habits. In most countries, speed limits are set by government authorities and can differ between urban and rural areas, as well as between types of vehicles. For instance, many European countries have strict speed limits for cars, often ranging from 120 km/h (75 mph) on highways to lower limits in urban areas, often around 50 km/h (31 mph).
Interestingly, some countries, like Germany, have sections of the Autobahn with no enforced speed limit, showcasing a unique approach to driving regulation that emphasizes personal responsibility. On the other hand, countries in the Middle East, such as Saudi Arabia, often have higher speed limits on major highways, sometimes reaching up to 140 km/h (87 mph), which can be attributed to their modern road infrastructure and lower population density.
In the United States, speed limits vary widely, with some states allowing high speeds on highways (up to 80 mph or about 129 km/h) while others enforce much stricter limits. The reasons behind these variations are often linked to local laws, geography, and even political considerations. For example, rural areas may have higher limits due to less traffic, while urban areas implement lower limits to enhance safety.
Speed limits can also have significant implications for road safety. Research shows that higher speed limits correlate with increased accident rates and fatalities. Countries with lower speed limits, like the UK, often have lower road death rates compared to those with higher limits. Thus, the establishment of speed limits is not just a regulatory measure but a critical component of public health policy.
Regional Analysis
When examining the map, one can't help but notice the differences between continents. In Europe, countries like France and Italy have standardized speed limits that are relatively low compared to the speeds permitted in parts of Africa or Asia. For instance, in France, the typical highway speed limit is 130 km/h (81 mph), while in Japan, it is often set at 100 km/h (62 mph).
In Asia, speed limits can also vary greatly. Countries like India have lower limits due to densely populated areas and varying road conditions, while nations such as South Korea have implemented advanced traffic management systems that allow for higher speed limits on well-maintained highways, often up to 120 km/h (75 mph).
Africa presents a mixed picture. While countries like South Africa have speed limits that can reach up to 120 km/h (75 mph) on highways, others may have much lower limits due to poorer road conditions and safety considerations. This divergence highlights the challenges of maintaining road safety and infrastructure development across the continent.
Significance and Impact
Understanding speed limits is essential for various stakeholders, including policymakers, urban planners, and the general public. It affects not only road safety but also fuel consumption, traffic congestion, and environmental impacts. For instance, studies have shown that higher speed limits can lead to increased fuel consumption and greenhouse gas emissions, making it a relevant topic in discussions about climate change and sustainable transport.
Current trends indicate a gradual shift towards reevaluating speed limits in response to safety concerns and environmental challenges. Countries around the world are beginning to adopt more stringent regulations to improve road safety, reduce emissions, and promote alternative forms of transportation. As cities grow and traffic patterns change, the conversation around speed limits will likely continue to evolve.
In conclusion, the "Max Speed Limit by Country Map" is more than just a visual representation; it reflects complex social, cultural, and infrastructural factors that shape our driving experiences. Have you noticed how speed limits in your country compare to those abroad? This map serves as a reminder of the diverse approaches to road safety and the importance of understanding these differences as we move towards a more interconnected world.
Visualization Details
- Published
- August 29, 2025
- Views
- 76
Comments
Loading comments...