U.S. Property Tax Burden by State Map

Marcus Rodriguez
Historical Geography Expert
Marcus Rodriguez specializes in historical cartography and geographic data analysis. With a background in both history and geography, he brings unique...
Geographic Analysis
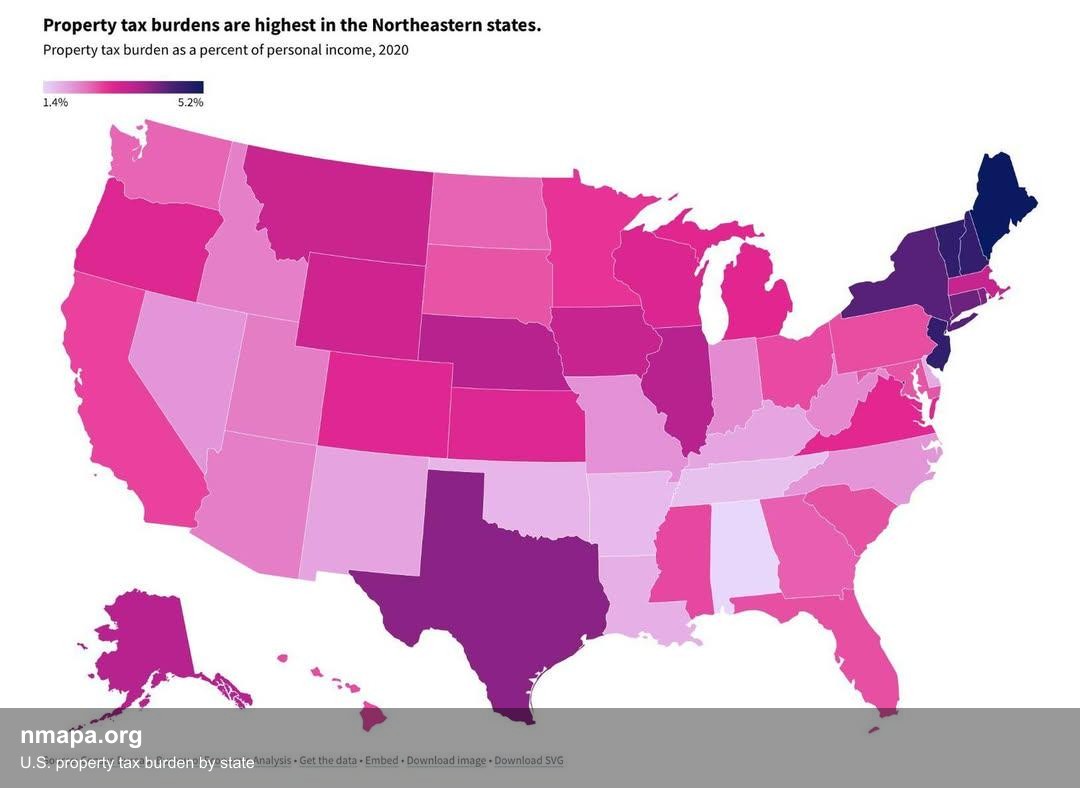
What This Map Shows
The "U.S. Property Tax Burden by State Map" provides a clear visualization of property tax rates across the United States. It highlights the percentage of property taxes relative to the home value in each state, allowing viewers to quickly assess where property taxes are the highest and lowest. Understanding property tax burdens is crucial for potential homeowners, investors, and policymakers, as these taxes significantly impact housing affordability and local funding for essential services.
Deep Dive into Property Taxes
Property taxes play a vital role in local government financing, funding essential services such as education, public safety, and infrastructure. These taxes are levied on real estate properties, based on the assessed value of the property. The rate can vary significantly from one locality to another, influenced by a state's tax policies, local government needs, and economic conditions.
Interestingly, property tax rates do not correlate directly with home values. For example, a state with high property values might have lower rates, while a state with lower property values could impose higher rates. According to the latest data, New Jersey has the highest average property tax rate at approximately 2.21%, while Hawaii boasts the lowest at about 0.28%. This stark contrast raises questions about how different states prioritize taxation and public funding.
Moreover, property tax burdens can disproportionately affect residents based on their income levels. States that levy higher property taxes may pose challenges for lower- to middle-income families, potentially leading to affordability issues. Property taxes are often considered regressive, as they take a larger percentage of income from those who earn less. This raises a fundamental question: How do we balance the need for funding local services with the burden placed on homeowners?
In addition to rates, the administration of property taxes can vary widely. Some states have more progressive systems that allow for exemptions, deductions, or circuit breakers for low-income residents, while others apply a flat rate across the board. Increasingly, states are adopting measures to alleviate the tax burden for certain demographics, particularly the elderly or disabled, to ensure housing remains accessible.
Regional Analysis
Examining the map reveals distinct regional trends in property tax burdens. For instance, the Northeast region, particularly states like New Jersey, Connecticut, and New York, consistently shows high tax rates. These states often rely on property taxes to fund robust public services, including extensive public school systems and healthcare facilities. In contrast, Southern states such as Alabama and Arkansas exhibit lower property tax rates, reflecting different funding mechanisms and legislative priorities.
Interestingly, Midwestern states like Illinois and Wisconsin also feature higher property tax rates, which can be attributed to their reliance on local taxes to support schools and municipalities. In comparison, states in the West, particularly those like Nevada and Utah, tend to have lower property taxes, aided by strong sales tax revenue streams.
The map also highlights that states with a higher percentage of rental properties often have different tax structures in place. For instance, states like California, which have substantial rental markets, may implement measures to reduce tax burdens on renters, resulting in a more favorable environment for tenants.
Significance and Impact
Understanding property tax burdens is crucial for various stakeholders. For homeowners, a high property tax rate can significantly influence the decision to purchase a home, especially for first-time buyers. Furthermore, local governments depend on these taxes to fund essential services that impact community well-being. As housing markets fluctuate, so do property values and, consequently, tax revenue. This dynamic creates a feedback loop where rising property taxes can lead to more affordable housing challenges, pushing residents to seek homes in areas with lower taxes.
As we look to the future, it's essential to consider how changing demographics and economic conditions will impact property tax structures. With the increasing movement of populations toward urban areas, local governments may need to rethink their tax strategies to maintain funding while ensuring housing remains affordable. Have you noticed that many cities are grappling with this issue? How will they balance growth and affordability in the years to come?
In conclusion, the property tax burden map is more than just a collection of numbers; it reflects broader economic and social trends that affect the lives of millions of Americans. As we continue to navigate these complex issues, understanding property taxes will remain a critical aspect of the conversation about housing affordability and community support.
Visualization Details
- Published
- August 2, 2025
- Views
- 174
Comments
Loading comments...