nmapa.org logo
nmapa.org
HomeGalleryTagsAboutPrivacyDisclaimer
Home›Tags›housing affordability

housing affordability Maps

3 geographic visualizations tagged with "housing affordability"
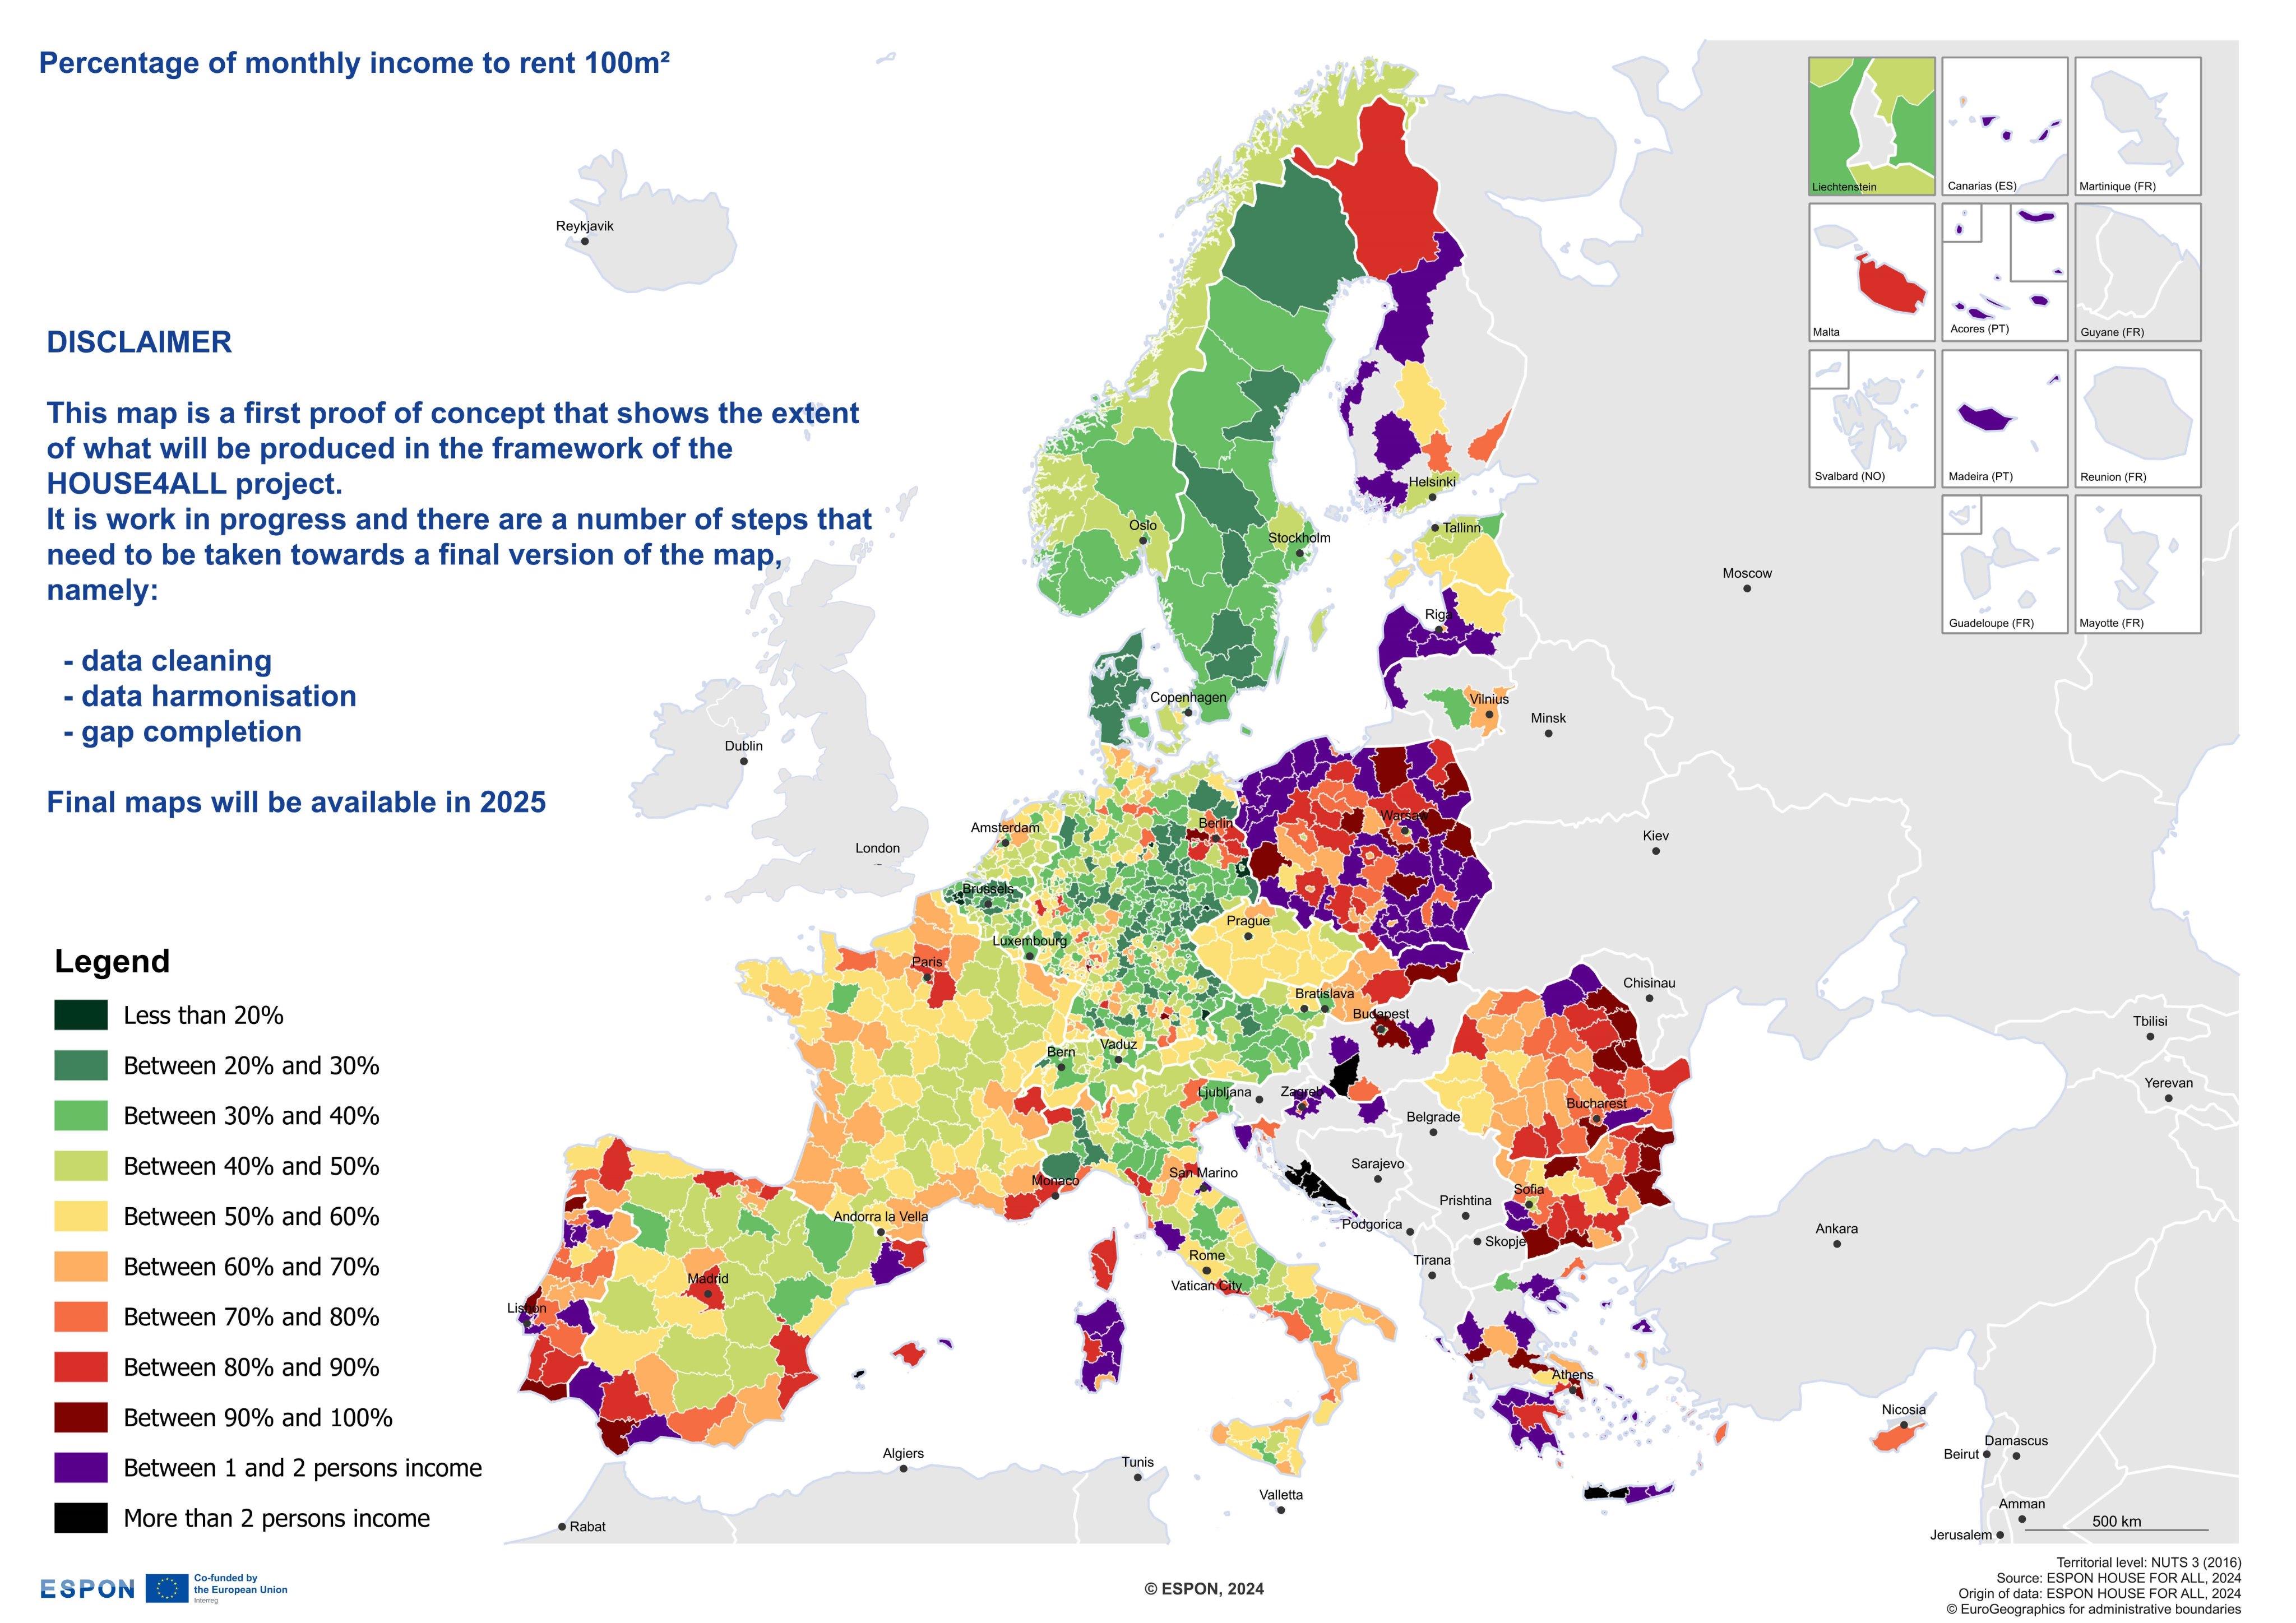
Monthly Income Percentage for Renting 100m2 Map

Monthly Income Percentage for Renting 100m2 Map

The visualization titled "Percentage of Monthly Income Needed to Rent 100m2 by European Region" offers a compelling look...

👁 116📅 10/15/2025
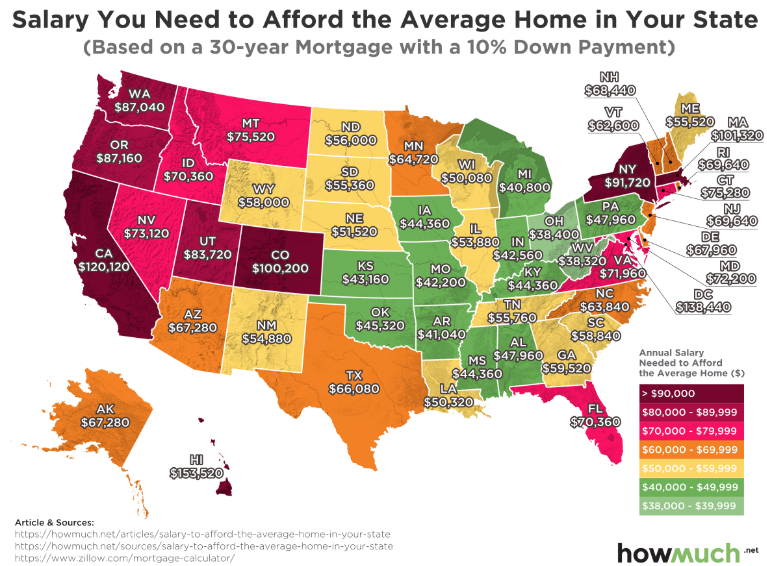
Salary Needed to Afford a Home Map

Salary Needed to Afford a Home Map

Interestingly, the map illustrates how salaries vary dramatically across different regions, affecting home affordability...

👁 90📅 8/28/2025
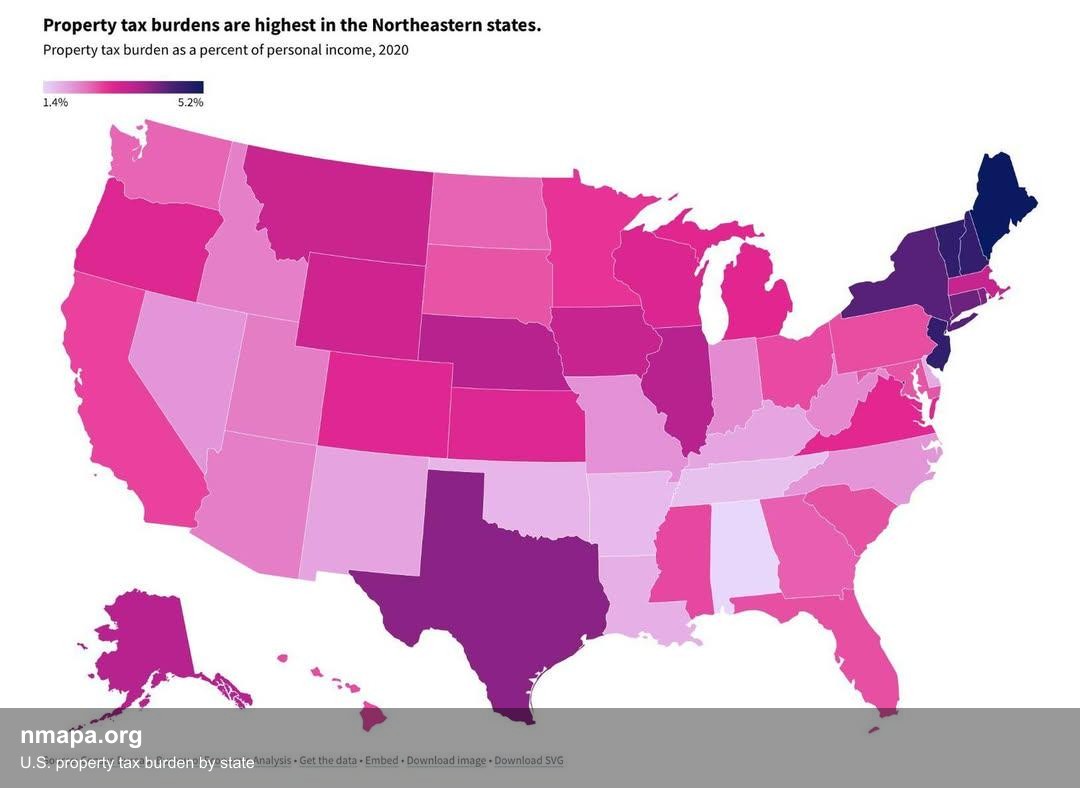
U.S. Property Tax Burden by State Map

U.S. Property Tax Burden by State Map

The "U.S. Property Tax Burden by State Map" provides a clear visualization of property tax rates across the United State...

👁 176📅 8/2/2025
← Browse All TagsBrowse All Maps
nmapa.org logo

nmapa.org

Your premium gateway to the world's most fascinating maps and geographical visualizations. Explore, discover, and understand our planet through the art of cartography.

Explore

  • Home
  • About
  • Gallery

Legal

  • Privacy Policy
  • Disclaimer
  • Terms of Service

© 2025 nmapa.org. All rights reserved. Made with ❤️ for geography enthusiasts worldwide.