Visualizing Faith: The Latter-day Saints Map of America

Marcus Rodriguez
Historical Geography Expert
Marcus Rodriguez specializes in historical cartography and geographic data analysis. With a background in both history and geography, he brings unique...
Geographic Analysis
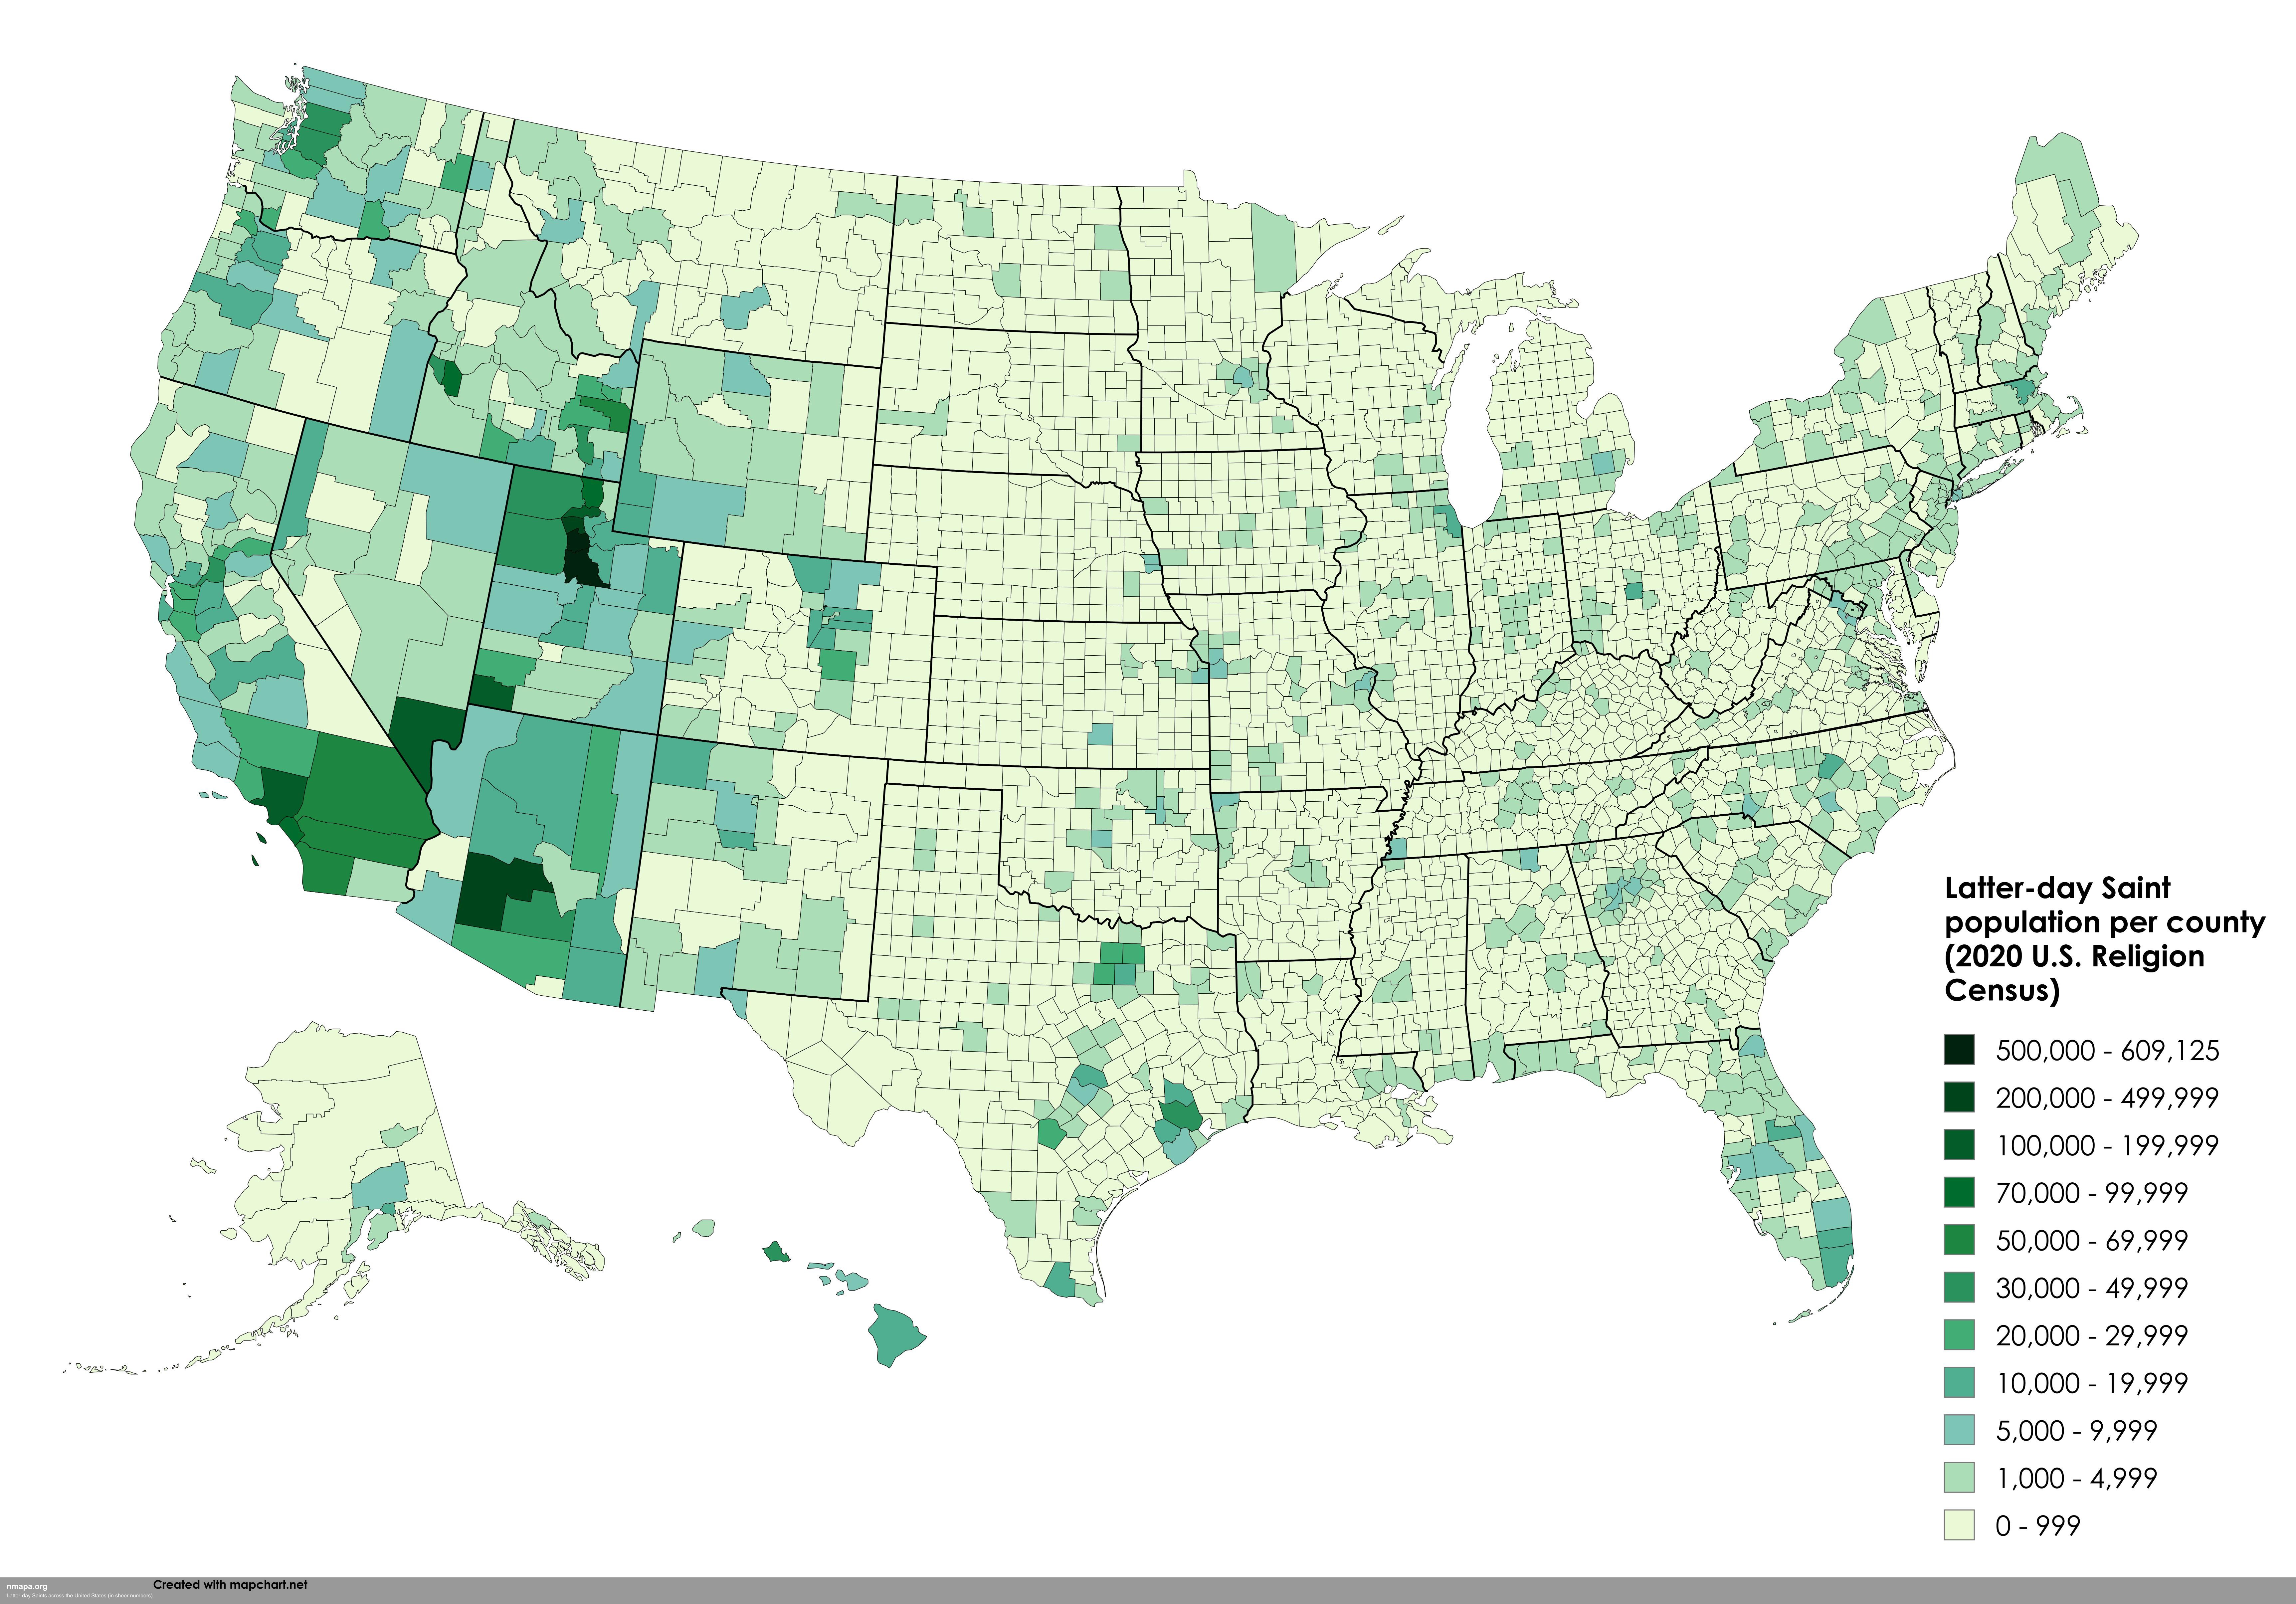
In recent years, the Church of Jesus Christ of Latter-day Saints (LDS) has experienced a remarkable surge in growth, evidenced by a significant increase in convert baptisms and church attendance. A comprehensive visualization, "Latter-day Saints across the United States (in sheer numbers)," offers a detailed look at the distribution of approximately 6.9 million American Latter-day Saints, drawing data from the 2020 U.S. Religion Census. This map not only highlights where these adherents are located but also invites viewers to explore the geographical significance of their presence across the nation.
This map displays the population density and distribution of Latter-day Saints throughout the United States, showcasing areas with the highest concentrations. States such as Utah, Idaho, and Arizona emerge prominently, reflecting long-standing historical roots and cultural ties to the church. The visualization provides a clear picture of how the LDS community is spread across the country, revealing clusters where the faith has flourished and areas where it is still growing. By visualizing these data points, viewers can easily discern patterns that might otherwise be overlooked in a mere statistical report.
The geographical significance of this visualization cannot be understated. Understanding the distribution of Latter-day Saints across the U.S. opens a window into the cultural and social dynamics at play within these communities. For instance, Utah, often recognized as the heart of the LDS faith, is home to a staggering majority of Latter-day Saints, with approximately 62% of the state's population identifying with the church. This concentration shapes not only the state's cultural identity but also its political landscape, educational systems, and social services.
Historically, the growth of the LDS church in America can be traced back to the 19th century, when its founder, Joseph Smith, established the faith in upstate New York. Subsequent migrations, particularly to the Salt Lake Valley in Utah, solidified a strong community that continues to thrive today. This historical context enriches the map's significance, as it encapsulates over a century of religious evolution, migration, and community development, reflecting broader themes of religious liberty and cultural resilience.
The map also reveals intriguing regional patterns and insights. For example, while the western states show higher populations, areas like the Midwest and parts of the Southeast are also witnessing growth, especially among new converts. This trend indicates a shift in the LDS church's outreach strategies and a renewed focus on member retention, which has seen a notable uptick in church attendance, even outpacing the increase in baptisms. Such insights highlight the adaptive nature of religious communities in the face of changing demographics and societal values.
The educational value of this visualization is significant. It serves as an excellent resource for students, researchers, and anyone interested in understanding the interplay between geography and religion. By examining the map, viewers can learn about the factors that contribute to the growth of religious populations, including migration patterns, socio-economic influences, and the importance of community engagement. Furthermore, it encourages discussions about the role of faith in shaping geographical landscapes and how religious communities impact local cultures.
Geographical visualizations like this one also help in understanding broader geographical concepts such as population density, regional development, and cultural geography. By employing cartographic techniques to represent complex data, one can gain insights into how religious affiliations can influence demographic trends, urban planning, and resource distribution.
In conclusion, the "Latter-day Saints across the United States (in sheer numbers)" map is more than just a collection of data points; it is a vivid representation of a dynamic and evolving community. It invites viewers to explore the geographical significance of the Latter-day Saints, understand the historical and cultural context, and appreciate the insights gained from such visualizations. As the LDS church continues to grow and adapt, this map serves as a valuable tool for understanding the intricate relationship between geography and faith in America today.
Visualization Details
- Published
- August 1, 2025
- Views
- 148
Comments
Loading comments...